
CHAPTER 1
FINANCIAL STATEMENT ANALYSIS: AN INTRODUCTION
After completing this chapter, you will be able to do the following:
- Describe the roles of financial reporting and financial statement analysis.
- Describe the roles of the key financial statements (statement of financial position, statement of comprehensive income, statement of changes in equity, and statement of cash flows) in evaluating a company’s performance and financial position.
- Describe the importance of financial statement notes and supplementary information—including disclosures of accounting policies, methods, and estimates—and management’s commentary.
- Describe the objective of audits of financial statements, the types of audit reports, and the importance of effective internal controls.
- Identify and explain information sources that analysts use in financial statement analysis besides annual financial statements and supplementary information.
- Describe the steps in the financial statement analysis framework.
Financial analysis is the process of examining a company’s performance in the context of its industry and economic environment in order to arrive at a decision or recommendation. Often, the decisions and recommendations addressed by financial analysts pertain to providing capital to companies—specifically, whether to invest in the company’s debt or equity securities and at what price. An investor in debt securities is concerned about the company’s ability to pay interest and to repay the principal lent. An investor in equity securities is an owner with a residual interest in the company and is concerned about the company’s ability to pay dividends and the likelihood that its share price will increase. Overall, a central focus of financial analysis is evaluating the company’s ability to earn a return on its capital that is at least equal to the cost of that capital, to profitably grow its operations, and to generate enough cash to meet obligations and pursue opportunities. Fundamental financial analysis starts with the information found in a company’s financial reports. These financial reports include audited financial statements, additional disclosures required by regulatory authorities, and any accompanying (unaudited) commentary by management. Basic financial statement analysis—as presented in this chapter—provides a foundation that enables the analyst to better understand information gathered from research beyond the financial reports.
This chapter is organized as follows: Section 2 discusses the scope of financial statement analysis. Section 3 describes the sources of information used in financial statement analysis, including the primary financial statements (balance sheet, statement of comprehensive income, statement of changes in equity, and cash flow statement). Section 4 provides a framework for guiding the financial statement analysis process, and Section 5 summarizes the key points of the chapter. Practice problems in the CFA Institute multiple-choice format conclude the chapter.
2. SCOPE OF FINANCIAL STATEMENT ANALYSIS
The role of financial reporting by companies is to provide information about a company’s performance, financial position, and changes in financial position that is useful to a wide range of users in making economic decisions.1 The role of financial statement analysis is to use financial reports prepared by companies, combined with other information, to evaluate the past, current, and potential performance and financial position of a company for the purpose of making investment, credit, and other economic decisions. (Managers within a company perform financial analysis to make operating, investing, and financing decisions but do not necessarily rely on analysis of related financial statement. They have access to additional financial information that can be reported in whatever format is most useful to their decision.)
In evaluating financial reports, analysts typically have a specific economic decision in mind. Examples of these decisions include the following:
- Evaluating an equity investment for inclusion in a portfolio.
- Evaluating a merger or acquisition candidate.
- Evaluating a subsidiary or operating division of a parent company.
- Deciding whether to make a venture capital or other private equity investment.
- Determining the creditworthiness of a company in order to decide whether to extend a loan to the company and if so, what terms to offer.
- Extending credit to a customer.
- Examining compliance with debt covenants or other contractual arrangements.
- Assigning a debt rating to a company or bond issue.
- Valuing a security for making an investment recommendation to others.
- Forecasting future net income and cash flow.
These decisions demonstrate certain themes in financial analysis. In general, analysts seek to examine the past and current performance and financial position of a company in order to form expectations about its future performance and financial position. Analysts are also concerned about factors that affect risks to a company’s future performance and financial position. An examination of performance can include an assessment of a company’s profitability (the ability to earn a profit from delivering goods and services) and its ability to generate positive cash flows (cash receipts in excess of cash disbursements). Profit and cash flow are not equivalent. Profit (or loss) represents the difference between the prices at which goods or services are provided to customers and the expenses incurred to provide those goods and services. In addition, profit (or loss) includes other income (such as investing income or income from the sale of items other than goods and services) minus the expenses incurred to earn that income. Overall, profit (or loss) equals income minus expenses, and its recognition is mostly independent from when cash is received or paid. Example 1-1 illustrates the distinction between profit and cash flow.
EXAMPLE 1-1 Profit versus Cash Flow
Sennett Designs (SD) sells furniture on a retail basis. SD began operations during December 2009 and sold furniture for €250,000 in cash. The furniture sold by SD was purchased on credit for €150,000 and delivered by the supplier during December. The credit terms granted by the supplier required SD to pay the €150,000 in January for the furniture it received during December. In addition to the purchase and sale of furniture, in December, SD paid €20,000 in cash for rent and salaries.
1. How much is SD’s profit for December 2009 if no other transactions occurred?
2. How much is SD’s cash flow for December 2009?
3. If SD purchases and sells exactly the same amount in January 2010 as it did in December and under the same terms (receiving cash for the sales and making purchases on credit that will be due in February), how much will the company’s profit and cash flow be for the month of January?
Solution to 1: SD’s profit for December 2009 is the excess of the sales price (€250,000) over the cost of the goods that were sold (€150,000) and rent and salaries (€20,000), or €80,000.
Solution to 2: The December 2009 cash flow is €230,000, the amount of cash received from the customer (€250,000) less the cash paid for rent and salaries (€20,000).
Solution to 3: SD’s profit for January 2010 will be identical to its profit in December: €80,000, calculated as the sales price (€250,000) minus the cost of the goods that were sold (€150,000) and minus rent and salaries (€20,000). SD’s cash flow in January 2010 will also equal €80,000, calculated as the amount of cash received from the customer (€250,000) minus the cash paid for rent and salaries (€20,000) and minus the €150,000 which SD owes for the goods it had purchased on credit in the prior month.
Although profitability is important, so is a company’s ability to generate positive cash flow. Cash flow is important because, ultimately, the company needs cash to pay employees, suppliers, and others in order to continue as a going concern. A company that generates positive cash flow from operations has more flexibility in funding needed investments and taking advantage of attractive business opportunities than an otherwise comparable company without positive operating cash flow. Additionally, a company needs cash to pay returns (interest and dividends) to providers of debt and equity capital. Therefore, the expected magnitude of future cash flows is important in valuing corporate securities and in determining the company’s ability to meet its obligations. The ability to meet short-term obligations is generally referred to as liquidity, and the ability to meet long-term obligations is generally referred to as solvency. Cash flow in any given period is not, however, a complete measure of performance for that period because, as shown in Example 1-1, a company may be obligated to make future cash payments as a result of a transaction that generates positive cash flow in the current period.
Profits may provide useful information about cash flows, past and future. If the transaction of Example 1-1 were repeated month after month, the long-term average monthly cash flow of SD would equal €80,000, its monthly profit. Analysts typically not only evaluate past profitability but also forecast future profitability.
Exhibit 1-1 shows how news coverage of corporate earnings announcements places corporate results in the context of analysts’ expectations. Panel A shows the earnings announcement, and Panel B shows a sample of the news coverage of the announcement. Earnings are also frequently used by analysts in valuation. For example, an analyst may value shares of a company by comparing its price-to-earnings ratio (P/E) to the P/Es of peer companies and/or may use forecasted future earnings as direct or indirect inputs into discounted cash flow models of valuation.
Analysts are also interested in the current financial position of a company. The financial position can be measured by comparing the resources controlled by the company (assets) in relation to the claims against those resources (liabilities and equity). An example of a resource is cash. In Example 1-1, if no other transactions occur, the company should have €230,000 more in cash at 31 December 2009 than at the start of the period. The cash can be used by the company to pay its obligation to the supplier (a claim against the company) and may also be used to make distributions to the owner (who has a residual claim against the company’s assets, net of liabilities). Financial position is particularly important in credit analysis, as depicted in Exhibit 1-2. Panel A of the exhibit is an excerpt from an April 2010 announcement by a credit rating agency of an upgrade in the credit ratings of Teck Resources Ltd., a Canadian mining company. The rating agency explained that it upgraded the credit rating of the company (its “corporate credit rating”) and the credit rating of the company’s debt securities (the “issue-level rating”) because the company had repaid its debt quickly (“accelerated debt repayment”). Panel B of the exhibit is an excerpt from the company’s second quarter 2010 earnings announcement in which the company’s CEO describes the company’s repayment of debt. Panel C of the exhibit is an excerpt from the company’s financial report illustrating the change in the company’s financial position in June 2010 compared with December 2009. As shown, the amount of the company’s debt liabilities relative to the amount of its equity declined substantially over the period.
EXHIBIT 1-1 An Earnings Release and News Media Comparison with Analysts’ Expectations
Panel A. Excerpt from Apple Earnings Release
Apple Reports Second Quarter Results
Record March Quarter Revenue and Profit
iPhone Sales More Than Double
CUPERTINO, California—April 20, 2010—Apple® today announced financial results for its fiscal 2010 second quarter ended March 27, 2010. The Company posted revenue of $13.50 billion and net quarterly profit of $3.07 billion, or $3.33 per diluted share. These results compare to revenue of $9.08 billion and net quarterly profit of $1.62 billion, or $1.79 per diluted share, in the year-ago quarter. Gross margin was 41.7 percent, up from 39.9 percent in the year-ago quarter. International sales accounted for 58 percent of the quarter’s revenue.
Apple sold 2.94 million Macintosh® computers during the quarter, representing a 33 percent unit increase over the year-ago quarter. The Company sold 8.75 million iPhones in the quarter, representing 131 percent unit growth over the year-ago quarter. Apple sold 10.89 million iPods during the quarter, representing a one percent unit decline from the year-ago quarter.
“We’re thrilled to report our best nonholiday quarter ever, with revenues up 49 percent and profits up 90 percent,” said Steve Jobs, Apple’s CEO. “We’ve launched our revolutionary new iPad and users are loving it, and we have several more extraordinary products in the pipeline for this year.”
“Looking ahead to the third fiscal quarter of 2010, we expect revenue in the range of about $13.0 billion to $13.4 billion and we expect diluted earnings per share in the range of about $2.28 to $2.39,” said Peter Oppenheimer, Apple’s CFO.
Source: www.apple.com/pr/library/2010/04/20results.html.
Panel B. Excerpt downloaded from FOXBusiness.com Report: Tuesday, 20 April 2010
“Apple Earnings Surge by 90% in Second Quarter” by Kathryn Glass
In what’s beginning to become its trademark, Apple Inc. (AAPL: 238.7911, −9.5489, −3.85 percent) delivered much better-than-expected second-quarter earnings, but gave third-quarter guidance below expectations.
The personal-technology behemoth said it expects third-quarter earnings in the range of $2.28 to $2.39 per share on revenue between $13 billion and $13.4 billion. Analysts were expecting third-quarter earnings of $2.70 a share on revenue of $12.97 billion, according to a poll by Thomson Reuters.
Apple reported second quarter profit of $3.07 billion, or $3.33 per share, compared with year-ago profit of $1.62 billion, or $1.79 per share. Revenue rose to $13.5 billion, compared with revenue of $9.08 billion, one year ago. The tech giant said 58 percent of revenue came from international sales.
The results soared above expectations; analysts’ second-quarter profit estimates were for $2.45 per share on revenue of $12.04 billion.
Exhibit 1-2 Panel A. Excerpt from Announcement by Standard & Poor’s Ratings Services: 16 April 2010
Teck Resources Ltd. Upgraded to “BBB” from “BB+” on Improved Financial Risk Profile; Removed From CreditWatch
We are raising our long-term corporate credit rating on Vancouver-based mining company Teck Resources Ltd. to “BBB” from “BB+”. . .. We are also raising the issue-level rating on the company’s notes outstanding to “BBB” from “BB+”. . .. We base the upgrade on Teck’s materially improved financial risk profile following the accelerated debt repayment in the past year. The stable outlook reflects our opinion that Teck will maintain relatively stable credit metrics in the medium term, despite inherent volatility in the commodities market.
Source: Market News Publishing.
Panel B. Excerpt from Earnings Announcement by Teck Resources Limited: 28 July 2010
TECK REPORTS SECOND QUARTER RESULTS FOR 2010
Vancouver, BC – Teck Resources Limited (TSX: TCK.A and TCK.B, NYSE: TCK) announced quarterly earnings of $260 million, or $0.44 per share, for the second quarter of 2010. Our operating profit before depreciation was approximately $1.0 billion and EBITDA was $844 million in the second quarter.
Don Lindsay, President and CEO said, “During the quarter we eliminated the outstanding balance of our term bank loan and have now repaid the US$9.8 billion bank debt related to the Fording acquisition in less than 18 months, just over two years ahead of schedule. In addition, all of our operations performed well, and we met or exceeded the guidance given in our previous quarterly report. Our second quarter benefitted from a substantial increase in coal sales to 6.4 million tonnes and the higher benchmark prices negotiated for the second quarter. In addition, in the quarter we re-established our investment grade credit ratings from all of the major rating agencies and declared a semi-annual dividend of $0.20 per share.”
Source: Teck Resources Form 6-K, filed 11 August 2010.
Panel C. Financial Position of Teck Resources Limited: 28 July 2010 and 31 December 2009
| (in millions of Canadian $) | 28 July 2010 | 31 December 2009 |
| ASSETS | $28,570 | $29,873 |
| LIABILITIES | ||
| Debt | 5,678 | 8,004 |
| All other liabilities | 7,273 | 7,288 |
| Total liabilities | 12,951 | 15,292 |
| EQUITY | 15,619 | 14,581 |
| Debt divided by equity | 0.36 | 0.55 |
In conducting a financial analysis of a company, the analyst will regularly refer to the company’s financial statements, financial notes, and supplementary schedules and a variety of other information sources. The next section introduces the major financial statements and some commonly used information sources.
3. MAJOR FINANCIAL STATEMENTS AND OTHER INFORMATION SOURCES
In order to perform an equity or credit analysis of a company, an analyst collects a great deal of information. The nature of the information collected will vary on the basis of the individual decision to be made (or the specific purpose of the analysis) but will typically include information about the economy, industry, and company as well as information about comparable peer companies. Much of the information will likely come from outside the company, such as economic statistics, industry reports, trade publications, and databases containing information on competitors. The company itself provides some of the core information for analysis in its financial reports, press releases, investor conference calls, and webcasts.
Companies prepare financial reports at regular intervals (annually, semiannually, and/or quarterly depending on the applicable regulatory requirements). Financial reports include financial statements along with supplemental disclosures necessary to assess the company’s financial position and periodic performance. Financial statements are the result of an accounting recordkeeping process that records economic activities of a company, following the applicable accounting standards and principles. These statements summarize the accounting information, mainly for users outside the company (such as investors, creditors, analysts, and others) because users of financial information inside a company have direct access to the underlying financial data that are summarized in the financial statements and to other information that is collected but not included in the financial reporting process. Financial statements are almost always audited by independent accountants who provide an opinion on whether the financial statements present fairly the company’s performance and financial position in accordance with a specified, applicable set of accounting standards and principles.
3.1 Financial Statements and Supplementary Information
A complete set of financial statements includes a statement of financial position (i.e., a balance sheet), a statement of comprehensive income (i.e., a single statement of comprehensive income or an income statement and a statement of comprehensive income), a statement of changes in equity, and a statement of cash flows.2 The balance sheet portrays the company’s financial position at a given point in time. The statement of comprehensive income and statement of cash flows present different aspects of a company’s performance over a period of time. The statement of changes in equity provides additional information regarding the changes in a company’s financial position. In addition, the accompanying notes or footnotes to the financial statements are required and considered an integral part of a complete set of financial statements.
Along with the required financial statements, a company typically provides additional information in its financial reports. In many jurisdictions, some or all of this additional information is mandated by regulators or accounting standards boards. The additional information provided may include a letter from the chairman of the company, a report from management discussing the results (typically called management discussion and analysis [MD&A] or management commentary), an external auditor’s report providing assurances, a governance report describing the structure of the company’s board of directors, and a corporate responsibility report. As part of his or her analysis, the financial analyst should read and assess this additional information along with the financial statements. The following sections describe and illustrate each financial statement and some of the additional information.
3.1.1. Balance Sheet
The balance sheet (also called the statement of financial position or statement of financial condition) presents a company’s current financial position by disclosing the resources the company controls (assets) and its obligations to lenders and other creditors (liabilities) at a specific point in time. Owners’ equity represents the excess of assets over liabilities. This amount is attributable to the company’s owners or shareholders. Owners’ equity is the owners’ residual interest in (i.e., residual claim on) the company’s assets after deducting its liabilities.
The relationship among the three parts of the balance sheet (assets, liabilities, and owners’ equity) can be expressed in the following equation form: Assets=Liabilities+Owners’ equity. This equation (sometimes called the accounting equation or the balance sheet equation) shows that the total amount of assets must equal or balance to the combined total amounts of liabilities and owners’ equity. Alternatively, the equation may be rearranged as follows: Assets−Liabilities=Owners’ equity. This formulation emphasizes the residual claim aspect of owners’ equity. Depending on the form of the organization, owners’ equity may be referred to as “partners’ capital” or “shareholders’ equity.”
Exhibit 1-3 presents the balance sheet of the Volkswagen Group (FWB: VOW) from its Annual Report 2009.
EXHIBIT 1-3 Balance Sheet of the Volkswagen Group
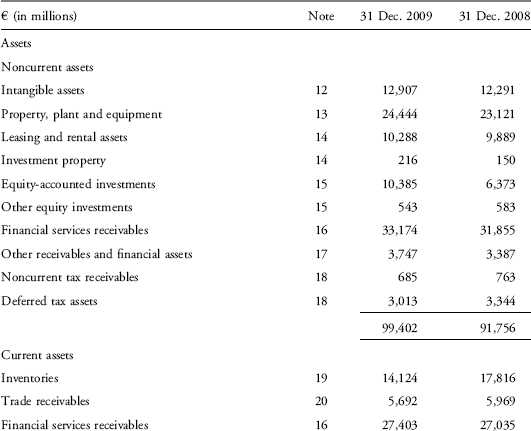
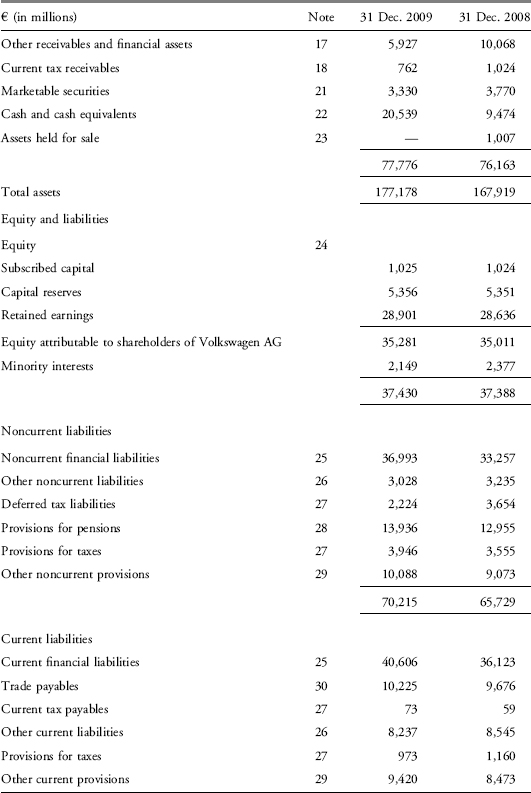
In Exhibit 1-3, the balance sheet is presented with the most recent year in the first column and the earlier year in the second column. Although this is a common presentation, analysts should be careful when reading financial statements. In some cases, the ordering may be reversed, with years listed from most distant to most recent.
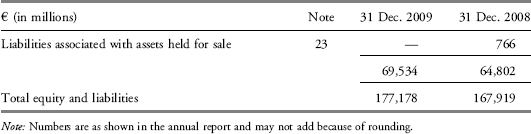
At 31 December 2009, Volkswagen’s total resources or assets were €177 billion. This number is the sum of noncurrent assets of €99 billion and current assets of €78 billion.3 Total equity was €37 billion. Although Volkswagen does not give a total amount for all the balance sheet liabilities, it can be determined by adding the noncurrent and current liabilities, €70,215 million+€69,534 million=€139,749 million, or €140 billion.4
Referring back to the basic accounting equation, Assets=Liabilities+Equity, we have €177 billion=€140 billion+€37 billion. In other words, Volkswagen has assets of €177 billion, owes €140 billion, and thus has equity of €37 billion. Using the balance sheet and applying financial statement analysis, the analyst can answer such questions as
- Has the company’s liquidity (ability to meet short-term obligations) improved?
- Is the company solvent (does it have sufficient resources to cover its obligations)?
- What is the company’s financial position relative to the industry?
Volkswagen, a German-based automobile manufacturer, prepares its financial statements in accordance with International Financial Reporting Standards (IFRS). IFRS require companies to present classified balance sheets that show current and noncurrent assets and current and noncurrent liabilities as separate classifications. However, IFRS do not prescribe a particular ordering or format, and the order in which companies present their balance sheet items is largely a function of tradition. As shown, Volkswagen presents noncurrent assets before current assets, owners’ equity before liabilities, and within liabilities, noncurrent liabilities before current liabilities. This method generally reflects a presentation from least liquid to most liquid. In other countries, the typical order of presentation may differ. For example, in the United States, Australia, and Canada, companies usually present their assets and liabilities from most liquid to least liquid. Cash is typically the first asset shown, and equity is presented after liabilities.
As a basis for comparison, Exhibit 1-4 presents the balance sheet of Wal-Mart Stores, Inc., or Walmart (NYSE: WMT) from its 2010 Annual Report.
EXHIBIT 1-4 Walmart Consolidated Balance Sheet
| 31 January | ||
| (Amounts in millions except per share data) | 2010 | 2009 |
| ASSETS | ||
| Current assets: | ||
| Cash and cash equivalents | $7,907 | $7,275 |
| Receivables, net | 4,144 | 3,905 |
| Inventories | 33,160 | 34,511 |
| Prepaid expenses and other | 2,980 | 3,063 |
| Current assets of discontinued operations | 140 | 195 |
| Total current assets | 48,331 | 48,949 |
| Property and equipment: | ||
| Land | 22,591 | 19,852 |
| Buildings and improvements | 77,452 | 73,810 |
| Fixtures and equipment | 35,450 | 29,851 |
| Transportation equipment | 2,355 | 2,307 |
| Property and equipment | 137,848 | 125,820 |
| Less accumulated depreciation | (38,304) | (32,964) |
| Property and equipment, net | 99,544 | 92,856 |
| Property under capital leases: | ||
| Property under capital leases | 5,669 | 5,341 |
| Less accumulated amortization | (2,906) | (2,544) |
| Property under capital leases, net | 2,763 | 2,797 |
| Goodwill | 16,126 | 15,260 |
| Other assets and deferred charges | 3,942 | 3,567 |
| Total assets | $170,706 | $163,429 |
| LIABILITIES AND EQUITY | ||
| Current liabilities: | ||
| Short-term borrowings | $523 | $1,506 |
| Accounts payable | 30,451 | 28,849 |
| Accrued liabilities | 18,734 | 18,112 |
| Accrued income taxes | 1,365 | 677 |
| Long-term debt due within one year | 4,050 | 5,848 |
| Obligations under capital leases due within one year | 346 | 315 |
| Current liabilities of discontinued operations | 92 | 83 |
| Total current liabilities | 55,561 | 55,390 |
| Long-term debt | 33,231 | 31,349 |
| Long-term obligations under capital leases | 3,170 | 3,200 |
| Deferred income taxes and other | 5,508 | 6,014 |
| Redeemable noncontrolling interest | 307 | 397 |
| Commitments and contingencies | ||
| Equity: | ||
| Preferred stock ($0.10 par value; 100 shares authorized, none issued) | — | — |
| Common stock ($0.10 par value; 11,000 shares authorized, 3,786 and 3,925 issued and outstanding at 31 January 2010 and 31 January 2009, respectively) | 378 | 393 |
| Capital in excess of par value | 3,803 | 3,920 |
| Retained earnings | 66,638 | 63,660 |
| Accumulated other comprehensive loss | (70) | (2,688) |
| Total Walmart shareholders’ equity | 70,749 | 65,285 |
| Noncontrolling interest | 2,180 | 1,794 |
| Total equity | 72,929 | 67,079 |
| Total liabilities and equity | $170,706 | $163,429 |
Walmart has total assets of $170.7 billion. Liabilities and other nonequity claims total $97.8 billion, and equity is $72.9 billion. A later chapter will cover the analysis of the balance sheet in more depth. The next section describes and illustrates the statement of comprehensive income.
3.1.2. Statement of Comprehensive Income
The statement of comprehensive income, under IFRS, can be presented as a single statement of comprehensive income or as two statements, an income statement and a statement of comprehensive income that begins with profit or loss from the income statement. The Volkswagen Group chose the latter form of presentation rather than a single statement.
3.1.2.1 Income Statement
The income statement presents information on the financial results of a company’s business activities over a period of time. The income statement communicates how much revenue and other income the company generated during a period and the expenses it incurred to generate that revenue and other income. Revenue typically refers to amounts charged for the delivery of goods or services in the ordinary activities of a business. Other income includes gains, which may or may not arise in the ordinary activities of the business. Expenses reflect outflows, depletions of assets, and incurrences of liabilities that decrease equity. Expenses typically include such items as cost of sales (cost of goods sold), administrative expenses, and income tax expenses and may be defined to include losses. Net income (revenue plus other income minus expenses) on the income statement is often referred to as the “bottom line” because of its proximity to the bottom of the income statement. Net income may also be referred to as “net earnings,” “net profit,” and “profit or loss.” In the event that expenses exceed revenues and other income, the result is referred to as “net loss.”
Income statements are reported on a consolidated basis, meaning that they include the income and expenses of subsidiary companies under the control of the parent (reporting) company. The income statement is sometimes referred to as a statement of operations or profit and loss (P&L) statement. The basic equation underlying the income statement is Revenue+Other income−Expenses=Income−Expenses=Net income.
In general terms, when one company (the parent) controls another company (the subsidiary), the parent presents its own financial statement information consolidated with that of the subsidiary. (When a parent company owns more than 50 percent of the voting shares of a subsidiary company, it is presumed to control the subsidiary and thus presents consolidated financial statements.) Each line item of the consolidated income statement includes the entire amount from the relevant line item on the subsidiary’s income statement (after removing any intercompany transactions); however, if the parent does not own 100 percent of the subsidiary, it is necessary for the parent to present an allocation of net income to the minority interests. Minority interests, also called noncontrolling interests, refer to owners of the remaining shares of the subsidiary that are not owned by the parent. The share of consolidated net income attributable to minority interests is shown at the bottom of the income statement along with the net income attributable to shareholders of the parent company. Exhibit 1-5 presents the income statement of the Volkswagen Group from its Annual Report 2009.
Exhibit 1-5 shows that Volkswagen’s sales revenue for the fiscal year ended 31 December 2009 was €105,187 million. Subtracting cost of sales from revenue gives gross profit of €13,579 million. After subtracting operating costs and expenses and adding other operating income, the company’s operating profit totals €1,855 million. Operating profit represents the results of the company’s usual business activities before deducting interest expense or taxes. Operating profit (also called operating income) is thus often referred to as earnings before interest and taxes (EBIT). Next, operating profit is increased by Volkswagen’s share of the profits generated by certain of its investments (€701 million) and by profits from its other financial activities (€972 million) and decreased by finance costs (i.e., interest expense) of €2,268 million, resulting in profit before tax of €1,261 million. Total income tax expense for 2009 was €349 million, resulting in profit after tax (net income) of €911 million.
After allocating the losses attributable to minority interest ownership in Volkswagen subsidiary companies, the profit attributable to shareholders of Volkswagen for 2009 was €960 million. Allocating the losses attributable to minority interest ownership resulted in the allocation to shareholders of the parent company, Volkswagen AG, exceeding net income (profit after tax). Volkswagen’s disclosures indicate that its minority interests relate primarily to Scania AB, a subsidiary in which Volkswagen owns about 72 percent of the voting rights (with the minority interests owning the remaining 28 percent).
Companies present both basic and diluted earnings per share on the face of the income statement. Earnings per share numbers represent net income attributable to the class of shareholders divided by the relevant number of shares of stock outstanding during the period. Basic earnings per share is calculated using the weighted-average number of common (ordinary) shares that were actually outstanding during the period and the profit or loss attributable to the common shareowners. Diluted earnings per share uses diluted shares—the number of shares that would hypothetically be outstanding if potentially dilutive claims on common shares (e.g., stock options or convertible bonds) were exercised or converted by their holders, and an appropriately adjusted profit or loss attributable to the common shareowners.
EXHIBIT 1-5 Income Statement of the Volkswagen Group for the Period 1 January to 31 December
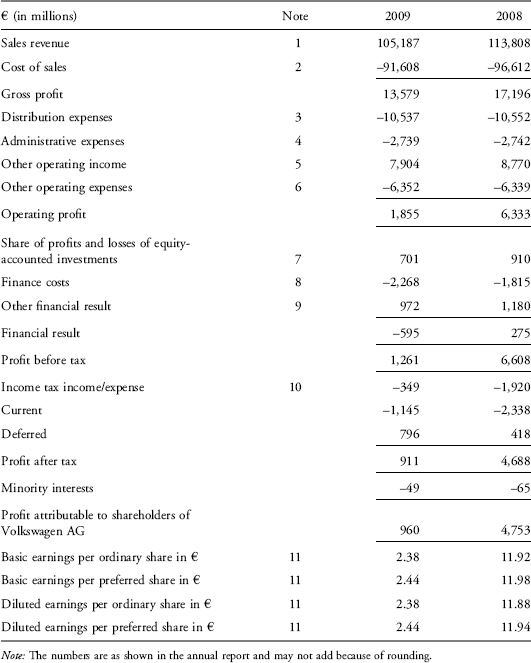
Volkswagen has two types of shareholders, ordinary and preferred, and presents earnings per share information for both, although there is no requirement to present earnings per share information for preferred shareowners. Volkswagen’s basic earnings per ordinary share was €2.38. A note to the company’s financial statements explains that this number was calculated as follows: €960 million profit attributable to shareholders of Volkswagen, of which €703 million is attributable to ordinary shareholders and €257 million is attributable to preferred shareholders. The €703 million attributable to ordinary shareholders divided by the weighted-average number of ordinary shares of 295 million shares equals basic earnings per share for 2009 of €2.38. Similar detail is provided in the notes for each of the earnings per share numbers.
An analyst examining the income statement might note that Volkswagen was profitable in both years. The company’s profitability declined substantially in 2009, primarily because of lower sales and reduced gross profit. This was not unexpected given the global financial and economic crisis in that year. A better understanding of Volkswagen’s profitability could likely be gained by examining income statements over a longer time period. The analyst might formulate questions related to profitability, such as the following:
- Is the change in revenue related to an increase in units sold, an increase in prices, or some combination?
- If the company has multiple business segments (for example, Volkswagen’s segments include passenger cars, light commercial vehicles, and financial services, among others), how are the segments’ revenue and profits changing?
- How does the company compare with other companies in the industry?
Answering such questions requires the analyst to gather, analyze, and interpret information from a number of sources, including, but not limited to, the income statement.
3.1.2.2. Other Comprehensive Income
Comprehensive income includes all items that impact owners’ equity but are not the result of transactions with shareowners. Some of these items are included in the calculation of net income, and some are included in other comprehensive income (OCI). Under IFRS, when comprehensive income is presented in two statements, the statement of comprehensive income begins with the profit or loss from the income statement and then presents the components of other comprehensive income. Although U.S. generally accepted accounting principles (U.S. GAAP) indicate a preference for this type of presentation when a single statement of comprehensive income is not presented, they permit companies to present the components of other comprehensive income in the statement of changes in equity.5
Exhibit 1-6 presents the statement of comprehensive income of the Volkswagen Group from its Annual Report 2009.
Exhibit 1-6 shows that other comprehensive income, although smaller in absolute terms than profit after tax (net income), had a significant effect on total comprehensive income. In 2009, other comprehensive income represented approximately 31 percent of total comprehensive income and was approximately 45 percent of the size of profit after tax (net income). In 2008, other comprehensive income was negative (a loss) and was approximately 41 percent of the size of profit after tax (net income) in absolute terms. The statement of comprehensive income will be discussed in greater detail in a later chapter. The next section briefly describes the statement of changes in equity.
3.1.3. Statement of Changes in Equity
The statement of changes in equity, variously called the “statement of changes in owners’ equity” or “statement of changes in shareholders’ equity,” primarily serves to report changes in the owners’ investment in the business over time. The basic components of owners’ equity are paid-in capital and retained earnings. Retained earnings include the cumulative amount of the company’s profits that have been retained in the company. In addition, noncontrolling or minority interests and reserves that represent accumulated other comprehensive income items are included in equity. The latter items may be shown separately or included in retained earnings. Volkswagen includes reserves as components of retained earnings.
EXHIBIT 1-6 Statement of Comprehensive Income of the Volkswagen Group for the Period 1 January to 31 December
| € (in millions) | 2009 | 2008 |
| Profit after tax | 911 | 4,688 |
| Exchange differences on translating foreign operations: | ||
| Fair value changes recognized in other comprehensive income | 917 | −1,445 |
| Transferred to profit or loss | 57 | |
| Actuarial gains/losses | −860 | 190 |
| Cash flow hedges: | ||
| Fair value changes recognized in other comprehensive income | 683 | 1,054 |
| Transferred to profit or loss | −908 | −1,427 |
| Available-for-sale financial assets (marketable securities): | ||
| Fair value changes recognized in other comprehensive income | 200 | −330 |
| Transferred to profit or loss | 71 | 100 |
| Deferred taxes | 216 | 145 |
| Share of profits and losses of equity-accounted investments recognized directly in equity, after tax | 30 | −188 |
| Other comprehensive income | 406 | −1,901 |
| Total comprehensive income | 1,317 | 2,787 |
| Of which attributable to | ||
| Shareholders of Volkswagen AG | 1,138 | 3,310 |
| Minority interests | 179 | −523 |
The statement of changes in equity is organized to present, for each component of equity, the beginning balance, any increases during the period, any decreases during the period, and the ending balance. For paid-in capital, an example of an increase is a new issuance of equity and an example of a decrease is a repurchase of previously issued stock. For retained earnings, income (both net income as reported on the income statement and other comprehensive income) is the most common increase and a dividend payment is the most common decrease.
Volkswagen’s balance sheet in Exhibit 1-7 shows that equity at the end of 2009 totaled €37,430 million, compared with €37,388 million at the end of 2008. The company’s statement of changes in equity presents additional detail on the change in each line item. Exhibit 1-7 presents an excerpt of the statement of changes in equity of the Volkswagen Group from its Annual Report 2009.
EXHIBIT 1-7 Excerpt from Statement of Changes in Equity of the Volkswagen Group for the Period 1 January to 31 December 2009
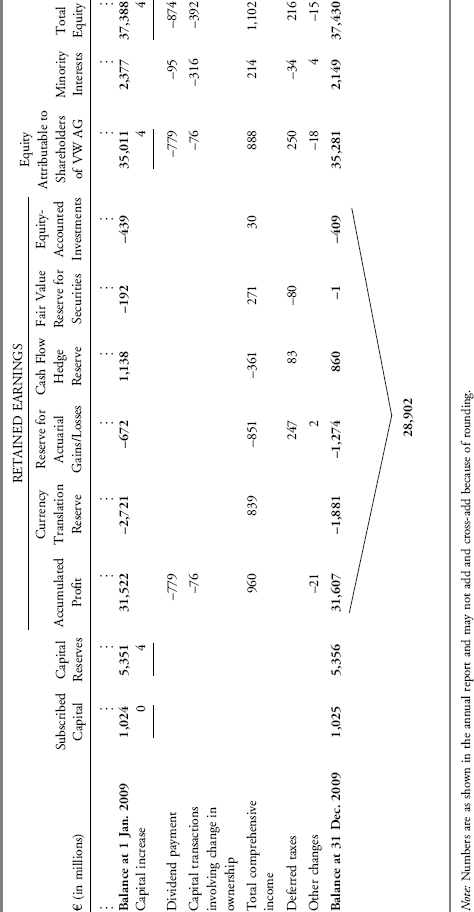
In Exhibit 1-7, the sum of the line items total comprehensive income (€1,102 million) and deferred taxes (€216 million) equals the amount of total comprehensive income reported in the statement of comprehensive income, except for a rounding difference. Using the balance at 31 December 2009, the sum of the columns accumulated profit through equity-accounted investment equals the amount of retained earnings on the balance sheet (€28,901 million in Exhibit 1-3), except for a rounding difference. Dividends (€779 million) are reported in this statement and reduce retained earnings. Explanatory notes on equity are included in the notes to the consolidated financial statements. The next section describes the cash flow statement.
3.1.4. Cash Flow Statement
Although the income statement and balance sheet provide measures of a company’s success in terms of performance and financial position, cash flow is also vital to a company’s long-term success. Disclosing the sources and uses of cash helps creditors, investors, and other statement users evaluate the company’s liquidity, solvency, and financial flexibility. Financial flexibility is the ability of the company to react and adapt to financial adversities and opportunities. The cash flow statement classifies all cash flows of the company into three categories: operating, investing, and financing. Cash flows from operating activities are those cash flows not classified as investing or financing and generally involve the cash effects of transactions that enter into the determination of net income and, hence, comprise the day-to-day operations of the company. Cash flows from investing activities are those cash flows from activities associated with the acquisition and disposal of long-term assets, such as property and equipment. Cash flows from financing activities are those cash flows from activities related to obtaining or repaying capital to be used in the business. IFRS permit more flexibility than U.S. GAAP in classifying dividend and interest receipts and payments within these categories.
Exhibit 1-8 presents Volkswagen’s statement of cash flows for the fiscal years ended 31 December 2009 and 2008.
EXHIBIT 1-8 Cash Flow Statement of the Volkswagen Group: 1 January to 31 December
| € (in millions) | 2009 | 2008 |
| Cash and cash equivalents at beginning of period(excluding time deposit investments) | 9,443 | 9,914 |
| Profit before tax | 1,261 | 6,608 |
| Income taxes paid | −529 | −2,075 |
| Depreciation and amortization of property, plant and equipment, intangible assets and investment property | 5,028 | 5,198 |
| Amortization of capitalized development costs | 1,586 | 1,392 |
| Impairment losses on equity investments | 16 | 32 |
| Depreciation of leasing and rental assets | 2,247 | 1,816 |
| Gain/loss on disposal of noncurrent assets | −547 | 37 |
| Share of profit or loss of equity-accounted investments | −298 | −219 |
| Other noncash expense/income | 727 | 765 |
| Change in inventories | 4,155 | −3,056 |
| Change in receivables (excluding financial services) | 465 | −1,333 |
| Change in liabilities (excluding financial liabilities) | 260 | 815 |
| Change in provisions | 1,660 | 509 |
| Change in leasing and rental assets | −2,571 | −2,734 |
| Change in financial services receivables | −719 | −5,053 |
| Cash flows from operating activities | 12,741 | 2,702 |
| Investments in property, plant and equipment, intangible assets and investment property | −5,963 | −6,896 |
| Additions to capitalized development costs | −1,948 | −2,216 |
| Acquisition of equity investments | −3,989 | −2,597 |
| Disposal of equity investments | 1,320 | 1 |
| Proceeds from disposal of property, plant and equipment, intangible assets and investment property | 153 | 95 |
| Change in investments in securities | 989 | 2,041 |
| Change in loans and time deposit investments | −236 | −1,611 |
| Cash flows from investing activities | −9,675 | −11,183 |
| Capital contributions | 4 | 218 |
| Dividends paid | −874 | −722 |
| Capital transactions with minority interests | −392 | −362 |
| Other changes | 23 | −3 |
| Proceeds from issue of bonds | 15,593 | 7,671 |
| Repayment of bonds | −10,202 | −8,470 |
| Change in other financial liabilities | 1,405 | 9,806 |
| Finance lease payments | −23 | −15 |
| Cash flows from financing activities | 5,536 | 8,123 |
| Effect of exchange rate changes on cash and cash equivalents | 190 | −113 |
| Net change in cash and cash equivalents | 8,792 | −471 |
| Cash and cash equivalents at end of period (excluding time deposit investments) | 18,235 | 9,443 |
| Cash and cash equivalents at end of period (excluding time deposit investments) | 18,235 | 9,443 |
| Securities and loans (including time deposit investments) | 7,312 | 7,875 |
| Gross liquidity | 25,547 | 17,318 |
| Total third-party borrowings | −77,599 | −69,555 |
| Net liquidity | −52,052 | −52,237 |
The operating activities section of Volkswagen’s cash flow statement begins with profit before tax,6 €1,261 million, subtracts actual income tax payments, and then adjusts this amount for the effects of noncash transactions, accruals and deferrals, and transactions of an investing and financing nature to arrive at the amount of cash generated from operating activities of €12,741 million. This approach to reporting cash flow from operating activities is termed the indirect method. The direct method of reporting cash flows from operating activities discloses major classes of gross cash receipts and gross cash payments. Examples of such classes are cash received from customers and cash paid to suppliers and employees.
The indirect method emphasizes the different perspectives of the income statement and cash flow statement. On the income statement, income is reported when earned, not necessarily when cash is received, and expenses are reported when incurred, not necessarily when paid. The cash flow statement presents another aspect of performance: the ability of a company to generate cash flow from running its business. Ideally, for an established company, the analyst would like to see that the primary source of cash flow is from operating activities as opposed to investing or financing activities.
The sum of the net cash flows from operating, investing, and financing activities and the effect of exchange rates on cash equals the net change in cash during the fiscal year. For Volkswagen, the sum of these four items was €8,792 million in 2009, which thus increased the company’s cash, excluding amounts held in time deposit investments, from €9,443 million at the beginning of the period to €18,235 million at the end of the period. As disclosed in a note to the financial statements, the time deposit investments are €42 million and €2,304 million for the years 2008 and 2009, respectively. The note also disclosed that €11 million of cash and cash equivalents held for sale [sic] are included in the cash and cash equivalents as reported in cash flow statement but are not included in the cash and cash equivalents as reported in the balance sheet in 2008. When these amounts are included with the amounts shown on the cash flow statement, the total cash and cash equivalents for the years 2008 and 2009 are €9,474 (=9443+42−11) million and €20,539 million. These are the same amounts reported as cash and cash equivalents on the balance sheets in Exhibit 1-3. The cash flow statement will be covered in more depth in a later chapter.
3.1.5. Financial Notes and Supplementary Schedules
The notes (also sometimes referred to as footnotes) that accompany the four financial statements are required and are an integral part of the complete set of financial statements. The notes provide information that is essential to understanding the information provided in the primary statements. Volkswagen’s 2009 financial statements, for example, include 91 pages of notes.
The notes disclose the basis of preparation for the financial statements. For example, Volkswagen discloses in its first note that its fiscal year corresponds to the calendar year, that its financial statements are prepared in accordance with IFRS as adopted by the European Union, that the statements are prepared in compliance with German law, that the statements are denominated in millions of euros unless otherwise specified, and that the figures have been rounded, which might give rise to minor discrepancies when figures are added. Volkswagen also discloses that its financial statements are on a consolidated basis—that is, including Volkswagen AG and all of the subsidiary companies it controls.
The notes also disclose information about the accounting policies, methods, and estimates used to prepare the financial statements. As will be discussed in later chapters, both IFRS and U.S. GAAP allow some flexibility in choosing among alternative policies and methods when accounting for certain items. This flexibility aims to meet the divergent needs of many businesses for reporting a variety of economic transactions. In addition to differences in accounting policies and methods, differences arise as a result of estimates needed to record and measure transactions, events, and financial statement line items.
Overall, flexibility in accounting choices is necessary because, ideally, a company will select those policies, methods, and estimates that are allowable and most relevant and that fairly reflect the unique economic environment of the company’s business and industry. Flexibility can, however, create challenges for the analyst because the use of different policies, methods, and estimates reduces comparability across different companies’ financial statements. Comparability occurs when different companies’ information is measured and reported in a similar manner over time. Comparability helps the analyst identify and analyze the real economic differences across companies, rather than differences that arise solely from different accounting choices. Because comparability of financial statements is a critical requirement for objective financial analysis, an analyst should be aware of the potential for differences in accounting choices even when comparing two companies that use the same set of accounting standards.
For example, if a company acquires a piece of equipment to use in its operations, accounting standards require that the cost of the equipment be reported as an expense by allocating its cost less any residual value in a systematic manner over the equipment’s useful life. This allocation of the cost is known as depreciation. Accounting standards permit flexibility, however, in determining the manner in which each year’s expense is determined. Two companies may acquire similar equipment but use different methods and assumptions to record the expense over time. An analyst’s ability to compare the companies’ performance is hindered by the difference. Analysts must understand reporting choices in order to make appropriate adjustments when comparing companies’ financial positions and performance.
A company’s significant accounting choices (policies, methods, and estimates) must be discussed in the notes to the financial statements. For example, a note containing a summary of significant accounting policies includes how the company recognizes its revenues and depreciates its noncurrent tangible assets. Analysts must understand the accounting choices a company makes and determine whether they are similar to those of other companies identified and used as benchmarks or comparables. If the policies of the companies being compared are different, the analyst who understands accounting and financial reporting can often make necessary adjustments so that the financial statement data used are more comparable.
For many companies, the financial notes and supplemental schedules provide explanatory information about every line item (or almost every line item) on the balance sheet and income statement, as illustrated by the note references in Volkswagen’s balance sheet and income statement in Exhibits 1-3 and 1-5. In addition, note disclosures include information about the following (this is not an exhaustive list):
- Financial instruments and risks arising from financial instruments.
- Commitments and contingencies.
- Legal proceedings.
- Related-party transactions.
- Subsequent events (i.e., events that occur after the balance sheet date).
- Business acquisitions and disposals.
- Operating segments’ performance.
EXHIBIT 1-9 Excerpt from Notes to the Consolidated Financial Statements of the Volkswagen Group for Fiscal Year Ended 31 December 2009
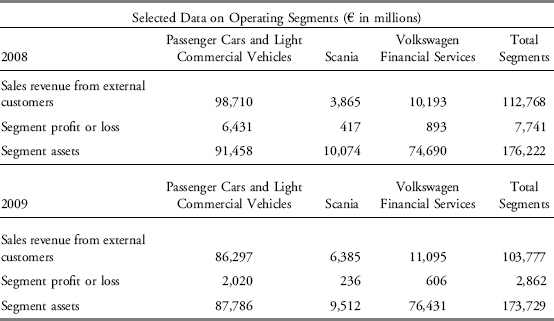
An analyst uses a significant amount of judgment in deciding how to incorporate information from note disclosures into the analysis. For example, such information as financial instrument risk, contingencies, and legal proceedings can alert an analyst to risks that can affect a company’s financial position and performance in the future and that require monitoring over time. As another example, information about a company’s operating segments can be useful as a means of quickly understanding what a company does and how and where it earns money. The operating segment data shown in Exhibit 1-9 appear in the notes to the financial statements for Volkswagen. (The totals of the segment data do not equal the amounts reported in the company’s financial statements because the financial statement data are adjusted for intersegment activities and unallocated items. The note provides a complete reconciliation of the segment data to the reported data.) From the data in Exhibit 1-9, an analyst can quickly see that most of the company’s revenues and operating profits come from the sale of passenger cars and light commercial vehicles. Over 80 percent of the company’s revenues was generated by this segment in both years. In 2008, this segment accounted for over 80 percent of the company’s total segment operating profits, although the percentage declined to 70 percent in 2009 because of higher sales growth in the other two segments. Experience using the disclosures of a company and its competitors typically enhances an analyst’s judgment about the relative importance of different disclosures and the ways in which they can be helpful.
3.1.6. Management Commentary or Management’s Discussion and Analysis
Publicly held companies typically include a section in their annual reports where management discusses a variety of issues of concern, including the nature of the business, past results, and future outlook. This section is referred to by a variety of names, including management report(ing), management commentary, operating and financial review, and management’s discussion and analysis. Inclusion of a management report is recommended by the International Organization of Securities Commissions and frequently required by regulatory authorities, such as the U.S. Securities and Exchange Commission (SEC) or the U.K. Financial Services Authority. In Germany, management reporting has been required since 1931 and is audited. The discussion by management is arguably one of the most useful parts of a company’s annual report besides the financial statements themselves; however, other than excerpts from the financial statements, information included in the management commentary is typically unaudited. When using information from the management report, an analyst should be aware of whether the information is audited or unaudited.
To help improve the quality of the discussion by management, the International Accounting Standards Board (IASB) issued an exposure draft in June 2009 that proposed a framework for the preparation and presentation of management commentary. Per the exposure draft, that framework will provide guidance rather than set forth requirements in a standard. The exposure draft identifies five content elements of a “decision-useful management commentary.” Those content elements include (1) the nature of the business; (2) management’s objectives and strategies; (3) the company’s significant resources, risks, and relationships; (4) results of operations; and (5) critical performance measures.
In the United States, the SEC requires listed companies to provide an MD&A and specifies the content.7 Management must highlight any favorable or unfavorable trends and identify significant events and uncertainties that affect the company’s liquidity, capital resources, and results of operations. The MD&A must also provide information about the effects of inflation, changing prices, or other material events and uncertainties that may cause the future operating results and financial condition to materially depart from the current reported financial information. In addition, the MD&A must provide information about off-balance-sheet obligations and about contractual commitments such as purchase obligations. Companies should also provide disclosure in the MD&A that discusses the critical accounting policies that require management to make subjective judgments and that have a significant impact on reported financial results.
The management commentary or MD&A is a good starting place for understanding information in the financial statements. In particular, the forward-looking disclosures in an MD&A, such as those about planned capital expenditures, new store openings, or divestitures, can be useful in projecting a company’s future performance. However, the commentary is only one input for the analyst seeking an objective and independent perspective on a company’s performance and prospects.
The management report in the Annual Report 2009 of Volkswagen Group includes much information of potential interest to an analyst. The 78-page management report contains sections titled Business Development; Shares and Bonds; Net Assets; Financial Position; Results of Operations; Volkswagen AG (condensed, according to German Commercial Code); Value-Enhancing Factors; Risk Report; and Report on Expected Developments.
3.1.7. Auditor’s Reports
Financial statements presented in companies’ annual reports are generally required to be audited (examined) by an independent accounting firm in accordance with specified auditing standards. The independent auditor then provides a written opinion on the financial statements. This opinion is referred to as the audit report. Audit reports take slightly different forms in different jurisdictions, but the basic components, including a specific statement of the auditor’s opinion, are similar. Audits of financial statements may be required by contractual arrangement, law, or regulation.
International standards for auditing have been developed by the International Auditing and Assurance Standards Board of the International Federation of Accountants. These standards have been adopted by many countries and are referenced in audit reports issued in those countries. Other countries, such as the United States, specify their own auditing standards. With the enactment of the Sarbanes–Oxley Act of 2002 in the United States, auditing standards for public companies are promulgated by the Public Company Accounting Oversight Board.
Under international standards for auditing (ISAs), the objectives of an auditor in conducting an audit of financial statements are
(a) To obtain reasonable assurance about whether the financial statements as a whole are free from material misstatement, whether due to fraud or error, thereby enabling the auditor to express an opinion on whether the financial statements are prepared, in all material respects, in accordance with an applicable financial reporting framework; and
(b) To report on the financial statements, and communicate as required by the ISAs, in accordance with the auditor’s findings.8
Publicly traded companies may also have requirements set by regulators or stock exchanges, such as appointing an independent audit committee within its board of directors to oversee the audit process. The audit process provides a basis for the independent auditor to express an audit opinion on whether the information presented in the audited financial statements present fairly the financial position, performance, and cash flows of the company in accordance with a specified set of accounting standards. Because audits are designed and conducted using audit sampling techniques and financial statement line items may be based on estimates and assumptions, independent auditors cannot express an opinion that provides absolute assurance about the accuracy or precision of the financial statements. Instead, the independent audit report provides reasonable assurance that the financial statements are fairly presented, meaning that there is a high probability that the audited financial statements are free from material error, fraud, or illegal acts that have a direct effect on the financial statements.
The standard independent audit report for a publicly traded company normally has several paragraphs under both the international and U.S. auditing standards. The first or “introductory” paragraph describes the financial statements that were audited and the responsibilities of both management and the independent auditor. The second or “scope” paragraph describes the nature of the audit process and provides the basis for the auditor’s expression about reasonable assurance on the fairness of the financial statements. The third or “opinion” paragraph expresses the auditor’s opinion on the fairness of the audited financial statements.
An unqualified audit opinion states that the financial statements give a “true and fair view” (international) or are “fairly presented” (international and U.S.) in accordance with applicable accounting standards. This is often referred to as a “clean” opinion and is the one that analysts would like to see in a financial report. There are several other types of opinions. A qualified audit opinion is one in which there is some scope limitation or exception to accounting standards. Exceptions are described in the audit report with additional explanatory paragraphs so that the analyst can determine the importance of the exception. An adverse audit opinion is issued when an auditor determines that the financial statements materially depart from accounting standards and are not fairly presented. An adverse opinion makes analysis of the financial statements easy: Do not bother analyzing these statements, because the company’s financial statements cannot be relied on. Finally, a disclaimer of opinion occurs when, for some reason, such as a scope limitation, the auditors are unable to issue an opinion. Exhibit 1-10 presents the independent auditor’s report for Volkswagen. Note that Volkswagen received an unqualified or clean audit opinion from PricewaterhouseCoopers for the company’s fiscal year ended 31 December 2009.
EXHIBIT 1-10 Volkswagen’s Independent Audit Report
Auditors’ Report
On completion of our audit, we issued the following unqualified auditors’ report dated February 17, 2010. This report was originally prepared in German. In case of ambiguities the German version takes precedence:
Auditors’ Report
We have audited the consolidated financial statements prepared by VOLKSWAGEN AKTIENGESELLSCHAFT, Wolfsburg, comprising the income statement and statement of comprehensive income, the balance sheet, the statement of changes in equity, the cash flow statement and the notes to the consolidated financial statements, together with the group management report, which is combined with the management report of the Company for the business year from January 1 to December 31, 2009. The preparation of the consolidated financial statements and the combined management report in accordance with the IFRSs, as adopted by the EU, and the additional requirements of German commercial law pursuant to § (article) 315a Abs. (paragraph) 1 HGB (“Handelsgesetzbuch”: German Commercial Code) are the responsibility of the Company’s Board of Management. Our responsibility is to express an opinion on the consolidated financial statements and on the combined management report based on our audit.
We conducted our audit of the consolidated financial statements in accordance with § 317 HGB and German generally accepted standards for the audit of financial statements promulgated by the Institut der Wirtschaftsprüfer (Institute of Public Auditors in Germany) (IDW). Those standards require that we plan and perform the audit such that misstatements materially affecting the presentation of the net assets, financial position and results of operations in the consolidated financial statements in accordance with the applicable financial reporting framework and in the combined management report are detected with reasonable assurance. Knowledge of the business activities and the economic and legal environment of the Group and expectations as to possible misstatements are taken into account in the determination of audit procedures. The effectiveness of the accounting-related internal control system and the evidence supporting the disclosures in the consolidated financial statements and the combined management report are examined primarily on a test basis within the framework of the audit. The audit includes assessing the annual financial statements of those entities included in consolidation, the determination of the entities to be included in consolidation, the accounting and consolidation principles used and significant estimates made by the Company’s Board of Management, as well as evaluating the overall presentation of the consolidated financial statements and the combined management report. We believe that our audit provides a reasonable basis for our opinion.
Our audit has not led to any reservations.
In our opinion, based on the findings of our audit, the consolidated financial statements comply with the IFRSs as adopted by the EU and the additional requirements of German commercial law pursuant to Article 315a paragraph 1 HGB and give a true and fair view of the net assets, financial position and results of operations of the Group in accordance with these requirements. The combined management report is consistent with the consolidated financial statements and as a whole provides a suitable view of the Group’s position and suitably presents the opportunities and risks of future development.
Hanover, February 17, 2010
PricewaterhouseCoopers
Aktiengesellschaft
Wirtschaftsprüfungsgesellschaft
Harald Kayser ppa. Martin Schröder
Wirtschaftsprüfer Wirtschaftsprüfer
Source: Volkswagen’s Annual Report 2009.
In the United States, under the Sarbanes–Oxley Act, the auditors must also express an opinion on the company’s internal control systems. This information may be provided in a separate opinion or incorporated as a paragraph in the opinion related to the financial statements. The internal control system is the company’s internal system that is designed, among other things, to ensure that the company’s process for generating financial reports is sound. Although management has always been responsible for maintaining effective internal control, the Sarbanes–Oxley Act greatly increases management’s responsibility for demonstrating that the company’s internal controls are effective. Management of publicly traded companies in the United States are now required by securities regulators to explicitly accept responsibility for the effectiveness of internal control, evaluate the effectiveness of internal control using suitable control criteria, support the evaluation with sufficient competent evidence, and provide a report on internal control.
Although these reports and attestations provide some assurances to analysts, they are not infallible. The analyst must always use a degree of healthy skepticism when analyzing financial statements.
3.2. Other Sources of Information
The information described in Section 3.1 is generally provided to shareholders at least annually. In addition, companies also provide information on management and director compensation, company stock performance, and any potential conflicts of interest that may exist between management, the board, and shareholders. This information may appear in the company’s annual report or other publicly available documents. Public companies often provide this information in proxy statements, which are statements distributed to shareholders about matters that are to be put to a vote at the company’s annual (or special) meeting of shareholders.
Interim reports are also provided by the company either semiannually or quarterly, depending on the applicable regulatory requirements. Interim reports generally present the four basic financial statements and condensed notes but are not audited. These interim reports provide updated information on a company’s performance and financial position since the last annual period.
Companies also provide relevant current information on their websites, in press releases, and in conference calls with analysts and investors. One type of press release, which analysts often consider to be particularly important, is the periodic earnings announcement. The earnings announcement often happens well before the company files its formal financial statements. Such earnings announcements are often followed by a conference call in which the company’s senior executives describe the company’s performance and answer questions posed by conference call participants. Following the earnings conference call, the investor relations portion of the company’s website may post a recording of the call accompanied by slides and supplemental information discussed during the call.
When performing financial statement analysis, analysts should review all these company sources of information as well as information from external sources regarding the economy, the industry, the company, and peer (comparable) companies. Information on the economy, industry, and peer companies is useful in putting the company’s financial performance and position in perspective and in assessing the company’s future. In most cases, information from sources apart from the company is crucial to an analyst’s effectiveness. For example, an analyst studying a consumer-oriented company will typically seek direct experience with the products (taste the food or drink, use the shampoo or soap, visit the stores or hotels). An analyst following a highly regulated industry will study the existing and expected relevant regulations. An analyst following a highly technical industry will gain relevant expertise personally or seek input from a technical specialist. In sum, thorough research goes beyond financial reports.
The next section presents a framework for using all this information in financial statement analysis.
4. FINANCIAL STATEMENT ANALYSIS FRAMEWORK
Analysts work in a variety of positions within the investment management industry. Some are equity analysts whose main objective is to evaluate potential investments in a company’s equity securities (i.e., the shares or stock it issues) as a basis for deciding whether a prospective investment is attractive and what an appropriate purchase price might be. Others are credit analysts who evaluate the creditworthiness of a company to decide whether (and with what terms) a loan should be made or what credit rating should be assigned. Analysts may also be involved in a variety of other tasks, such as evaluating the performance of a subsidiary company, evaluating a private equity investment, or finding stocks that are overvalued for purposes of taking a short position. This section presents a generic framework for financial statement analysis that can be used in these various tasks. The framework is summarized in Exhibit 1-11.9
The following sections discuss the individual phases of financial statement analysis.
4.1. Articulate the Purpose and Context of Analysis
Prior to undertaking any analysis, it is essential to understand the purpose of the analysis. An understanding of the purpose is particularly important in financial statement analysis because of the numerous available techniques and the substantial amount of data.
Some analytical tasks are well defined, in which case articulating the purpose of the analysis requires little decision making by the analyst. For example, a periodic credit review of an investment-grade debt portfolio or an equity analyst’s report on a particular company may be guided by institutional norms such that the purpose of the analysis is given. Furthermore, the format, procedures, and/or sources of information may also be given.
EXHIBIT 1-11 Financial Statement Analysis Framework
| Phase | Sources of Information | Output |
| 1. Articulate the purpose and context of the analysis. | The nature of the analyst’s function, such as evaluating an equity or debt investment or issuing a credit rating. Communication with client or supervisor on needs and concerns. Institutional guidelines related to developing specific work product. |
Statement of the purpose or objective of analysis. A list (written or unwritten) of specific questions to be answered by the analysis. Nature and content of report to be provided. Timetable and budgeted resources for completion. |
| 2. Collect data. | Financial statements, other financial data, questionnaires, and industry/economic data. Discussions with management, suppliers, customers, and competitors. Company site visits (e.g., to production facilities or retail stores). |
Organized financial statements. Financial data tables. Completed questionnaires, if applicable. |
| 3. Process data. | Data from the previous phase. | Adjusted financial statements. Common-size statements. Ratios and graphs. Forecasts. |
| 4. Analyze/interpret the processed data. | Input data as well as processed data. | Analytical results. |
| 5. Develop and communicate conclusions and recommendations (e.g., with an analysis report). | Analytical results and previous reports. Institutional guidelines for published reports. |
Analytical report answering questions posed in Phase 1. Recommendation regarding the purpose of the analysis, such as whether to make an investment or grant credit. |
| 6. Follow-up. | Information gathered by periodically repeating earlier steps as necessary to determine whether changes to holdings or recommendations are necessary. | Updated reports and recommendations. |
For other analytical tasks, articulating the purpose of the analysis requires the analyst to make decisions. The purpose of an analysis guides further decisions about the approach, the tools, the data sources, the format in which to report the results of the analysis, and the relative importance of different aspects of the analysis.
When facing a substantial amount of data, a less experienced analyst may be tempted to just start making calculations and generating financial ratios without considering what is relevant for the decision at hand. It is generally advisable to resist this temptation and thus avoid unnecessary or pointless efforts. Consider the questions: If you could have all the calculations and ratios completed instantly, what conclusion would you be able to draw? What question would you be able to answer? What decision would your answer support?
The analyst should also define the context at this stage. Who is the intended audience? What is the end product—for example, a final report explaining conclusions and recommendations? What is the time frame (i.e., when is the report due)? What resources and resource constraints are relevant to completion of the analysis? Again, the context may be predefined (i.e., standard and guided by institutional norms).
Having clarified the purpose and context of the financial statement analysis, the analyst should next compile the specific questions to be answered by the analysis. For example, if the purpose of the financial statement analysis (or, more likely, the particular stage of a larger analysis) is to compare the historical performance of three companies operating in a particular industry, specific questions would include the following: What has been the relative growth rate of the companies, and what has been the relative profitability of the companies?
4.2. Collect Data
Next, the analyst obtains the data required to answer the specific questions. A key part of this step is obtaining an understanding of the company’s business, financial performance, and financial position (including trends over time and in comparison with peer companies). For historical analyses, financial statement data alone are adequate in some cases. For example, to screen a large number of alternative companies to find those with a minimum level of profitability, financial statement data alone would be adequate. But to address more in-depth questions, such as why and how one company performed better or worse than its competitors, additional information would be required. As another example, to compare the historical performance of two companies in a particular industry, the historical financial statements would be sufficient to determine which had faster-growing sales or earnings and which was more profitable; however, a broader comparison with overall industry growth and profitability would obviously require industry data.
Furthermore, information on the economy and industry is necessary to understand the environment in which the company operates. Analysts often take a top-down approach whereby they (1) gain an understanding of the macroeconomic environment, such as prospects for growth in the economy and inflation, (2) analyze the prospects of the industry in which the subject company operates based on the expected macroeconomic environment, and (3) determine the prospects for the company in the expected industry and macroeconomic environments. For example, an analyst may need to forecast future growth in earnings for a company. To project future growth, past company data provide one basis for statistical forecasting; however, an understanding of economic and industry conditions can improve the analyst’s ability to forecast a company’s earnings on the basis of forecasts of overall economic and industry activity.
4.3. Process Data
After obtaining the requisite financial statement and other information, the analyst processes these data using appropriate analytical tools. For example, processing the data may involve computing ratios or growth rates; preparing common-size financial statements; creating charts; performing statistical analyses, such as regressions or Monte Carlo simulations; performing equity valuation; performing sensitivity analyses; or using any other analytical tools or combination of tools that are available and appropriate for the task. A comprehensive financial analysis at this stage would include the following:
- Reading and evaluating financial statements for each company being analyzed. This includes reading the notes and understanding what accounting standards have been used (for example, IFRS or U.S. GAAP), what accounting choices have been made (for example, when to report revenue on the income statement), and what operating decisions have been made that affect reported financial statements (for example, leasing versus purchasing equipment).
- Making any needed adjustments to the financial statements to facilitate comparison when the unadjusted statements of the subject companies reflect differences in accounting standards, accounting choices, or operating decisions. Note that commonly used databases do not make such analyst adjustments.
- Preparing or collecting common-size financial statement data (which scale data to directly reflect percentages [e.g., of sales] or changes [e.g., from the prior year]) and financial ratios (which are measures of various aspects of corporate performance based on financial statement elements). On the basis of common-size financial statements and financial ratios, analysts can evaluate a company’s relative profitability, liquidity, leverage, efficiency, and valuation in relation to past results and/or peers’ results.
4.4. Analyze/Interpret the Processed Data
Once the data have been processed, the next step—critical to any analysis—is to interpret the output. The answer to a specific financial analysis question is seldom the numerical answer alone. Rather, the answer to the analytical question relies on the analyst’s interpretation of the output and the use of this interpreted output to support a conclusion or recommendation. The answers to the specific analytical questions may themselves achieve the underlying purpose of the analysis, but usually, a conclusion or recommendation is required. For example, an equity analysis may require a buy, hold, or sell decision or a conclusion about the value of a share of stock. In support of the decision, the analysis would cite such information as target value, relative performance, expected future performance given a company’s strategic position, quality of management, and whatever other information was important in reaching the decision.
4.5. Develop and Communicate Conclusions/Recommendations
Communicating the conclusion or recommendation in an appropriate format is the next step. The appropriate format will vary by analytical task, by institution, and/or by audience. For example, an equity analyst’s report would typically include the following components:10
- Summary and investment conclusion.
- Earnings projections.
- Valuation.
- Business summary.
- Risk, industry, and competitive analysis.
- Historical performance.
- Forecasts.
The contents of reports may also be specified by regulatory agencies or professional standards. For example, the CFA Institute Standards of Practice Handbook (SOPH) dictates standards that must be followed in communicating recommendations. According to the SOPH:
Standard V(B) states that members and candidates should communicate in a recommendation the factors that were instrumental in making the investment recommendation. A critical part of this requirement is to distinguish clearly between opinions and facts. In preparing a research report, the member or candidate must present the basic characteristics of the security(ies) being analyzed, which will allow the reader to evaluate the report and incorporate information the reader deems relevant to his or her investment decision making process.11
The SOPH requires that limitations to the analysis and any risks inherent to the investment be disclosed. Furthermore, the SOPH requires that any report include elements important to the analysis and conclusions so that readers can evaluate the conclusions themselves.
4.6. Follow-Up
The process does not end with the report. If an equity investment is made or a credit rating is assigned, periodic review is required to determine if the original conclusions and recommendations are still valid. In the case of a rejected investment, follow-up may not be necessary but may be useful in determining whether the analysis process is adequate or should be refined (for example, if a rejected investment turns out to be successful in the market, perhaps the rejection was due to inadequate analysis). Follow-up may involve repeating all the previous steps in the process on a periodic basis.
The information presented in financial and other reports, including the financial statements, notes, and management’s commentary, help the financial analyst to assess a company’s performance and financial position. An analyst may be called on to perform a financial analysis for a variety of reasons, including the valuation of equity securities, the assessment of credit risk, the performance of due diligence in an acquisition, and the evaluation of a subsidiary’s performance relative to other business units. Major considerations in both equity analysis and credit analysis are evaluating a company’s financial position, its ability to generate profits and cash flow, and its ability to generate future growth in profits and cash flow.
This chapter has presented an overview of financial statement analysis. Among the major points covered are the following:
- The primary purpose of financial reports is to provide information and data about a company’s financial position and performance, including profitability and cash flows. The information presented in financial reports—including the financial statements and notes—and other reports—including management’s commentary or management’s discussion and analysis—allows the financial analyst to assess a company’s financial position and performance and trends in that performance.
- The basic financial statements are the statement of financial position (i.e., the balance sheet), the statement of comprehensive income (i.e., a single statement of comprehensive income or two statements consisting of an income statement and a statement of comprehensive income), the statement of changes in equity, and the statement of cash flows.
- The balance sheet discloses what resources a company controls (assets) and what it owes (liabilities) at a specific point in time. Owners’ equity represents the net assets of the company; it is the owners’ residual interest in or residual claim on the company’s assets after deducting its liabilities. The relationship among the three parts of the balance sheet (assets, liabilities, and owners’ equity) may be shown in equation form as follows: Assets=Liabilities+Owners’ equity.
- The income statement presents information on the financial results of a company’s business activities over a period of time. The income statement communicates how much revenue and other income the company generated during a period and what expenses, including losses, it incurred in connection with generating that revenue and other income. The basic equation underlying the income statement is Revenue+Other income−Expenses=Net income.
- The statement of comprehensive income includes all items that change owners’ equity except transactions with owners. Some of these items are included as part of net income, and some are reported as OCI.
- The statement of changes in equity provides information about increases or decreases in the various components of owners’ equity.
- Although the income statement and balance sheet provide measures of a company’s success, cash and cash flow are also vital to a company’s long-term success. Disclosing the sources and uses of cash helps creditors, investors, and other statement users evaluate the company’s liquidity, solvency, and financial flexibility.
- The notes (also referred to as footnotes) that accompany the financial statements are an integral part of those statements and provide information that is essential to understanding the statements. Analysts should evaluate note disclosures regarding the use of alternative accounting methods, estimates, and assumptions.
- In addition to the financial statements, a company provides other sources of information that are useful to the financial analyst. As part of his or her analysis, the financial analyst should read and assess this additional information, particularly that presented in the management commentary (also called management report[ing], operating and financial review, and MD&A).
- A publicly traded company must have an independent audit performed on its annual financial statements. The auditor’s report expresses an opinion on the financial statements and provides some assurance about whether the financial statements fairly present a company’s financial position, performance, and cash flows. In addition, for U.S. publicly traded companies, auditors must also express an opinion on the company’s internal control systems.
- Information on the economy, industry, and peer companies is useful in putting the company’s financial performance and position in perspective and in assessing the company’s future. In most cases, information from sources apart from the company are crucial to an analyst’s effectiveness.
- The financial statement analysis framework provides steps that can be followed in any financial statement analysis project. These steps are:
- Articulate the purpose and context of the analysis.
- Collect input data.
- Process data.
- Analyze/interpret the processed data.
- Develop and communicate conclusions and recommendations.
- Follow up.
1. Providing information about the performance and financial position of companies so that users can make economic decisions best describes the role of:
A. auditing.
B. financial reporting.
C. financial statement analysis.
2. A company’s current financial position would best be evaluated using the:
A. balance sheet.
B. income statement.
C. statement of cash flows.
3. A company’s profitability for a period would best be evaluated using the:
A. balance sheet.
B. income statement.
C. statement of cash flows.
4. Accounting policies, methods, and estimates used in preparing financial statements are most likely found in the:
A. auditor’s report.
B. management commentary.
C. notes to the financial statements.
5. Information about management and director compensation would least likely be found in the:
A. auditor’s report.
B. proxy statement.
C. notes to the financial statements.
6. Information about a company’s objectives, strategies, and significant risks would most likely be found in the:
A. auditor’s report.
B. management commentary.
C. notes to the financial statements.
7. What type of audit opinion is preferred when analyzing financial statements?
A. Qualified
B. Adverse
C. Unqualified
8. Ratios are an input into which step in the financial statement analysis framework?
A. Process data
B. Collect input data
C. Analyze/interpret the processed data
1The role of financial reporting is specified in International Accounting Standard (IAS) 1 Presentation of Financial Statements, paragraph 9, and paragraph 12 of the Framework for the Preparation and Presentation of Financial Statements. An updated framework is currently a joint project between the International Accounting Standards Board (IASB), which issues International Financial Reporting Standards (IFRS), and the Financial Accounting Standards Board (FASB). The FASB issues U.S. generally accepted accounting principles (U.S. GAAP) contained in the FASB Accounting Standards CodificationTM (FASB ASC). The set of accounting standards that a company uses to prepare its financial reports depends on its jurisdiction. The IASB and FASB will be discussed further in a later chapter.
2The names of the financial statements are those in IAS 1. Commonly used terms for these financial statements are indicated in parentheses. Later chapters will elaborate on each of these financial statements.
3Current assets are defined, in general, as those that are cash or cash equivalents; are held for trading; or are expected to be converted to cash (realized), sold, or consumed within 12 months or the company’s normal operating cycle. All other assets are classified as noncurrent.
4Current liabilities are defined, in general, as those that are expected to be settled within 12 months or the company’s normal operating cycle. All other liabilities are classified as noncurrent.
5See FASB ASC paragraphs 220-10-45-8 to 220-10-45-10. However, the IASB and the FASB have each issued a jointly developed proposal that would require entities to present a continuous statement of total comprehensive income. The continuous statement would include separate sections for profit or loss and other comprehensive income.
6Other companies may choose to begin with net income.
7Relevant sections of SEC requirements are included for reference in the FASB ASC. The FASB ASC does not include sections of SEC requirements that deal with matters outside the basic financial statements, such as the MD&A.
8See the International Auditing and Assurance Standards Board (IAASB) Handbook of International Quality Control, Auditing, Review, Other Assurance, and Related Services Pronouncements.
9Components of this framework have been adapted from van Greuning and Bratanovic (2003, p. 300) and from Benninga and Sarig (1997, pp. 134–156).
10Pinto, Henry, Robinson, and Stowe (2010).
11Standards of Practice Handbook (2010, p. 137).