
CHAPTER 5
UNDERSTANDING BALANCE SHEETS
After completing this chapter, you will be able to do the following:
- Describe the elements of the balance sheet: assets, liabilities, and equity.
- Describe uses and limitations of the balance sheet in financial analysis.
- Describe alternative formats of balance sheet presentation.
- Distinguish between current and noncurrent assets, and current and noncurrent liabilities.
- Describe different types of assets and liabilities and the measurement bases of each.
- Describe the components of shareholders’ equity.
- Analyze balance sheets and statements of changes in equity.
- Convert balance sheets to common-size balance sheets and interpret the common-size balance sheets.
- Calculate and interpret liquidity and solvency ratios.
The balance sheet provides information on a company’s resources (assets) and its sources of capital (equity and liabilities/debt). This information helps an analyst assess a company’s ability to pay for its near-term operating needs, meet future debt obligations, and make distributions to owners. The basic equation underlying the balance sheet is Assets=Liabilities+Equity.
Analysts should be aware that different items of assets and liabilities may be measured differently. For example, some items are measured at historical cost or a variation thereof and others at fair value.1 An understanding of the measurement issues will facilitate analysis. The balance sheet measurement issues are, of course, closely linked to the revenue and expense recognition issues affecting the income statement. Throughout this chapter, we describe and illustrate some of the linkages between the measurement issues affecting the balance sheet and the revenue and expense recognition issues affecting the income statement.
This chapter is organized as follows: In Section 2, we describe and give examples of the elements and formats of balance sheets. Section 3 discusses current assets and current liabilities. Section 4 focuses on assets, and Section 5 focuses on liabilities. Section 6 describes the components of equity and illustrates the statement of changes in shareholders’ equity. Section 7 introduces balance sheet analysis. Section 8 summarizes the chapter, and practice problems in the CFA Institute multiple-choice format conclude the chapter.
2. COMPONENTS AND FORMAT OF THE BALANCE SHEET
The balance sheet (also called the statement of financial position or statement of financial condition) discloses what an entity owns (or controls), what it owes, and what the owners’ claims are at a specific point in time.2
The financial position of a company is described in terms of its basic elements (assets, liabilities, and equity):
- Assets (A) are what the company owns (or controls). More formally, assets are resources controlled by the company as a result of past events and from which future economic benefits are expected to flow to the entity.
- Liabilities (L) are what the company owes. More formally, liabilities represent obligations of a company arising from past events, the settlement of which is expected to result in an outflow of economic benefits from the entity.
- Equity (E) represents the owners’ residual interest in the company’s assets after deducting its liabilities. Commonly known as shareholders’ equity or owners’ equity, equity is determined by subtracting the liabilities from the assets of a company, giving rise to the accounting equation: A − L = E or A=L+E.
The equation A=L+E is sometimes summarized as follows: The left side of the equation reflects the resources controlled by the company and the right side reflects how those resources were financed. For all financial statement items, an item should only be recognized in the financial statements if it is probable that any future economic benefit associated with the item will flow to or from the entity and if the item has a cost or value that can be measured with reliability.3
The balance sheet provides important information about a company’s financial condition, but the balance sheet amounts of equity (assets, net of liabilities) should not be viewed as a measure of either the market or intrinsic value of a company’s equity for several reasons. First, the balance sheet under current accounting standards is a mixed model with respect to measurement. Some assets and liabilities are measured based on historical cost, sometimes with adjustments, whereas other assets and liabilities are measured based on a current value. The measurement bases may have a significant effect on the amount reported. Second, even the items measured at current value reflect the value that was current at the end of the reporting period. The values of those items obviously can change after the balance sheet is prepared. Third, the value of a company is a function of many factors, including future cash flows expected to be generated by the company and current market conditions. Important aspects of a company’s ability to generate future cash flows—for example, its reputation and management skills—are not included in its balance sheet.
2.1. Balance Sheet Components
To illustrate the components and formats of balance sheets, we show the major subtotals from two companies’ balance sheets. Exhibit 5-1 and Exhibit 5-2 are based on the balance sheets of SAP Group (Frankfurt: SAP) and Apple Inc. (Nasdaq: AAPL). SAP Group is a leading business software company based in Germany and prepares its financial statements in accordance with IFRS. Apple is a technology manufacturer based in the United States and prepares its financial statements in accordance with U.S. GAAP. For purposes of discussion, Exhibits 5-1 and 5-2 show only the main subtotals and totals of these companies’ balance sheets. Additional exhibits throughout this chapter will expand on these subtotals.
EXHIBIT 5-1 SAP Group Consolidated Statements of Financial Position [Excerpt] (in millions of €)
Source: SAP Group 2009 annual report.
| As of 31 December | ||
| 2009 | 2008 | |
| Assets | ||
| Total current assets | 5,255 | 5,571 |
| Total noncurrent assets | 8,119 | 8,329 |
| Total assets | 13,374 | 13,900 |
| Equity and liabilities | ||
| Total current liabilities | 3,416 | 5,824 |
| Total noncurrent liabilities | 1,467 | 905 |
| Total liabilities | 4,883 | 6,729 |
| Total equity | 8,491 | 7,171 |
| Equity and liabilities | 13,374 | 13,900 |
EXHIBIT 5-2 Apple Inc. Consolidated Balance Sheet [Excerpt] (in millions of $)
Source: Apple Inc. 2009 annual report (Form 10K/A).
| 26 September 2009 | 27 September 2008 | |
| Assets | ||
| Total current assets | 31,555 | 30,006 |
| [All other assets] | 15,946 | 6,165 |
| Total assets | 47,501 | 36,171 |
| Liabilities and shareholders’ equity | ||
| Total current liabilities | 11,506 | 11,361 |
| [Total noncurrent liabilities] | 4,355 | 2,513 |
| Total liabilities | 15,861 | 13,874 |
| Total shareholders’ equity | 31,640 | 22,297 |
| Total liabilities and shareholders’ equity | 47,501 | 36,171 |
Note: The italicized subtotals presented in this excerpt are not explicitly shown on the face of the financial statement as prepared by the company.
SAP Group uses the title Statement of Financial Position, consistent with IFRS, and Apple uses the title Balance Sheet. Despite their different titles, both statements report the three basic elements: assets, liabilities, and equity. Both companies are reporting on a consolidated basis, that is, including all their controlled subsidiaries. The numbers in SAP Group’s balance sheet are in millions of euro, and the numbers in Apple’s balance sheet are in millions of dollars.
Balance sheet information is as of a specific point in time. These exhibits are from the companies’annual financial statements, so the balance sheet information is as of the last day of their respective fiscal years. SAP Group’s fiscal year is the same as the calendar year and the balance sheet information is as of 31 December. Apple’s fiscal year ends on the last Saturday of September so the actual date changes from year to year. About every six years, Apple’s fiscal year will include 53 weeks rather than 52 weeks. This feature of Apple’s fiscal year should be noted, but in general, the extra week is more relevant to evaluating statements spanning a period of time (the income and cash flow statements) rather than the balance sheet that captures information as of a specific point in time.
A company’s ability to pay for its short-term operating needs relates to the concept of liquidity. With respect to a company overall, liquidity refers to the availability of cash to meet those short-term needs. With respect to a particular asset or liability, liquidity refers to its “nearness to cash.” A liquid asset is one that can be easily converted into cash in a short period of time at a price close to fair market value. For example, a small holding of an actively traded stock is much more liquid than an asset such as a commercial real estate property in a weak property market.
The separate presentation of current and noncurrent assets and liabilities enables an analyst to examine a company’s liquidity position (at least as of the end of the fiscal period). Both IFRS and U.S. GAAP require that the balance sheet distinguish between current and noncurrent assets and between current and noncurrent liabilities and present these as separate classifications. An exception to this requirement, under IFRS, is that the current and noncurrent classifications are not required if a liquidity-based presentation provides reliable and more relevant information. Presentations distinguishing between current and noncurrent elements are shown in Exhibits 5-1 and 5-2. Exhibit 5-3 in Section 2.3 shows a liquidity-based presentation.
2.2. Current and Noncurrent Classification
Assets held primarily for the purpose of trading or expected to be sold, used up, or otherwise realized in cash within one year or one operating cycle of the business, whichever is greater, after the reporting period are classified as current assets. A company’s operating cycle is the average amount of time that elapses between acquiring inventory and collecting the cash from sales to customers. For a manufacturer, this is the average amount of time between acquiring raw materials and converting these into cash from a sale. Examples of companies that might be expected to have operating cycles longer than one year include those operating in the tobacco, distillery, and lumber industries. Even though these types of companies often hold inventories longer than one year, the inventory is classified as a current asset because it is expected to be sold within an operating cycle. Assets not expected to be sold or used up within one year or one operating cycle of the business, whichever is greater, are classified as noncurrent (long-term, long-lived) assets.
Current assets are generally maintained for operating purposes, and these assets include—in addition to cash—items expected to be converted into cash (e.g., trade receivables), used up (e.g., office supplies, prepaid expenses), or sold (e.g., inventories) in the current period. Current assets provide information about the operating activities and the operating capability of the entity. For example, the item “trade receivables” or “accounts receivable” would indicate that a company provides credit to its customers. Noncurrent assets represent the infrastructure from which the entity operates and are not consumed or sold in the current period. Investments in such assets are made from a strategic and longer term perspective.
Similarly, liabilities expected to be settled within one year or within one operating cycle of the business, whichever is greater, after the reporting period are classified as current liabilities. The specific criteria for classification of a liability as current include the following:
- It is expected to be settled in the entity’s normal operating cycle.
- It is held primarily for the purpose of being traded.4
- It is due to be settled within one year after the balance sheet date.
- The entity does not have an unconditional right to defer settlement of the liability for at least one year after the balance sheet date.5
IFRS specify that some current liabilities, such as trade payables and some accruals for employee and other operating costs, are part of the working capital used in the entity’s normal operating cycle. Such operating items are classified as current liabilities even if they will be settled more than one year after the balance sheet date. When the entity’s normal operating cycle is not clearly identifiable, its duration is assumed to be one year. All other liabilities are classified as noncurrent liabilities. Noncurrent liabilities include financial liabilities that provide financing on a long-term basis.
The excess of current assets over current liabilities is called working capital. The level of working capital tells analysts something about the ability of an entity to meet liabilities as they fall due. Although adequate working capital is essential, working capital should not be too large because funds may be tied up that could be used more productively elsewhere.
A balance sheet with separately classified current and noncurrent assets and liabilities is referred to as a classified balance sheet. Classification also refers generally to the grouping of accounts into subcategories. Both companies’ balance sheets that are summarized in Exhibits 5-1 and 5-2 are classified balance sheets. Although both companies’ balance sheets present current assets before noncurrent assets and current liabilities before noncurrent liabilities, this is not required. IFRS does not specify the order or format in which a company presents items on a current/noncurrent classified balance sheet.
2.3. Liquidity-Based Presentation
A liquidity-based presentation, rather than a current/noncurrent presentation, is used when such a presentation provides information that is reliable and more relevant. With a liquidity-based presentation, all assets and liabilities are presented broadly in order of liquidity.
Entities such as banks are candidates to use a liquidity-based presentation. Exhibit 5-3 presents the assets portion of the balance sheet of China Construction Bank, a commercial bank based in Beijing that reports using IFRS. [The Bank’s H-shares are listed on the Hong Kong Stock Exchange (Stock Code: 939), and the Bank’s A-shares are listed on the Shanghai Stock Exchange (Stock Code: 601939).] Its balance sheet is ordered using a liquidity-based presentation. As shown, the asset section begins with Cash and deposits with central banks. Less liquid items such as fixed assets and land use rights appear near the bottom of the asset listing.
EXHIBIT 5-3 China Construction Bank Corporation Consolidated Statement of Financial Position [Excerpt: Assets Only] as of 31 December (in millions of RMB)
Source: China Construction Bank 2009 Annual Report.
| Assets | 2009 | 2008 |
| Cash and deposits with central banks | 1,458,648 | 1,247,450 |
| Deposits with banks and nonbank financial institutions | 101,163 | 33,096 |
| Precious metals | 9,229 | 5,160 |
| Placements with banks and nonbank financial institutions | 22,217 | 16,836 |
| Financial assets at fair value through profit or loss | 18,871 | 50,309 |
| Positive fair value of derivatives | 9,456 | 21,299 |
| Financial assets held under resale agreements | 589,606 | 208,548 |
| Interest receivable | 40,345 | 38,317 |
| Loans and advances to customers | 4,692,947 | 3,683,575 |
| Available-for-sale financial assets | 651,480 | 550,838 |
| Held-to-maturity investments | 1,408,873 | 1,041,783 |
| Debt securities classified as receivables | 499,575 | 551,818 |
| Interests in associates and jointly controlled entities | 1,791 | 1,728 |
| Fixed assets | 74,693 | 63,957 |
| Land use rights | 17,122 | 17,295 |
| Intangible assets | 1,270 | 1,253 |
| Goodwill | 1,590 | 1,527 |
| Deferred tax assets | 10,790 | 7,855 |
| Other assets | 13,689 | 12,808 |
| Total assets | 9,623,355 | 7,555,452 |
3. CURRENT ASSETS AND CURRENT LIABILITIES
This section examines current assets and current liabilities in greater detail.
3.1. Current Assets
Accounting standards require that certain specific line items, if they are material, must be shown on a balance sheet. Among the current assets’ required line items are cash and cash equivalents, trade and other receivables, inventories, and financial assets (with short maturities). Companies present other line items as needed, consistent with the requirements to separately present each material class of similar items. As examples, Exhibit 5-4 and Exhibit 5-5 present balance sheet excerpts for SAP Group and Apple Inc. showing the line items for the companies’ current assets.
EXHIBIT 5-4 SAP Group Consolidated Statements of Financial Position [Excerpt: Current Assets Detail] (in millions of €)
Source: SAP Group 2009 annual report.
| As of 31 December | ||
| 2009 | 2008 | |
| Assets | ||
| Cash and cash equivalents | 1,884 | 1,280 |
| Other financial assets | 486 | 588 |
| Trade and other receivables | 2,546 | 3,178 |
| Other nonfinancial assets | 147 | 126 |
| Tax assets | 192 | 399 |
| Total current assets | 5,255 | 5,571 |
| Total noncurrent assets | 8,119 | 8,329 |
| Total assets | 13,374 | 13,900 |
| Equity and liabilities | ||
| Total current liabilities | 3,416 | 5,824 |
| Total noncurrent liabilities | 1,467 | 905 |
| Total liabilities | 4,883 | 6,729 |
| Total equity | 8,491 | 7,171 |
| Equity and liabilities | 13,374 | 13,900 |
EXHIBIT 5-5 Apple Inc. Consolidated Balance Sheet [Excerpt: Current Assets Detail] (in millions of $)
Source: Apple Inc. 2009 annual report (Form 10K/A).
| 26 September 2009 | 27 September 2008 | |
| Assets | ||
| Cash and cash equivalents | 5,263 | 11,875 |
| Short-term marketable securities | 18,201 | 10,236 |
| Accounts receivable, less allowances of $52 and $47, respectively | 3,361 | 2,422 |
| Inventories | 455 | 509 |
| Deferred tax assets | 1,135 | 1,044 |
| Other current assets | 3,140 | 3,920 |
| Total current assets | 31,555 | 30,006 |
| [All other assets] | 15,946 | 6,165 |
| Total assets | 47,501 | 36,171 |
| Liabilities and shareholders’ equity | ||
| Total current liabilities | 11,506 | 11,361 |
| [Total noncurrent liabilities] | 4,355 | 2,513 |
| Total liabilities | 15,861 | 13,874 |
| Total shareholders’ equity | 31,640 | 22,297 |
| Total liabilities and shareholders’ equity | 47,501 | 36,171 |
Note: The italicized subtotals presented in this excerpt are not explicitly shown on the face of the financial statement as prepared by the company.
3.1.1. Cash and Cash Equivalents
Cash equivalents are highly liquid, short-term investments that are so close to maturity,6 the risk is minimal that their value will change significantly with changes in interest rates. Cash and cash equivalents are financial assets. Financial assets, in general, are measured and reported at either amortized cost or fair value. Amortized cost is the historical cost (initially recognized cost) of the asset adjusted for amortization and impairment. Under IFRS, fair value is the amount at which an asset could be exchanged or a liability settled in an arm’s length transaction between knowledgeable and willing parties. Under U.S. GAAP, the definition is similar but it is based on an exit price, the price received to sell an asset or paid to transfer a liability, rather than an entry price.7
For cash and cash equivalents, amortized cost and fair value are likely to be immaterially different. Examples of cash equivalents are demand deposits with banks and highly liquid investments (such as U.S. Treasury bills, commercial paper, and money market funds) with original maturities of three months or less. Cash and cash equivalents excludes amounts that are restricted in use for at least 12 months. For all companies, the Statement of Cash Flows presents information about the changes in cash over a period. For the fiscal year 2009, SAP Group’s cash and cash equivalents increased from €1,280 million to €1,844 million, and Apple’s cash and cash equivalents decreased from $11,875 million to $5,263 million.
3.1.2. Marketable Securities
Marketable securities are also financial assets and include investments in debt or equity securities that are traded in a public market, and whose value can be determined from price information in a public market. Examples of marketable securities include treasury bills, notes, bonds, and equity securities, such as common stocks and mutual fund shares. Companies disclose further detail in the notes to their financial statements about their holdings. For example, SAP Group discloses that its other financial assets consist mainly of time deposits, investment in insurance policies, and loans to employees. Apple’s short-term marketable securities, totaling $18.2 billion and $10.2 billion at the end of fiscal 2009 and 2008, respectively, consist of fixed-income securities with a maturity of less than one year. Financial assets such as investments in debt and equity securities involve a variety of measurement issues and will be addressed in Section 4.5.
3.1.3. Trade Receivables
Trade receivables, also referred to as accounts receivable, are another type of financial asset. These are amounts owed to a company by its customers for products and services already delivered. They are typically reported at net realizable value, an approximation of fair value, based on estimates of collectability. Several aspects of accounts receivable are usually relevant to an analyst. First, the overall level of accounts receivable relative to sales (a topic to be addressed further in ratio analysis) is important because a significant increase in accounts receivable relative to sales could signal that the company is having problems collecting cash from its customers.
A second relevant aspect of accounts receivable is the allowance for doubtful accounts. The allowance for doubtful accounts reflects the company’s estimate of amounts that will ultimately be uncollectible. Additions to the allowance in a particular period are reflected as bad debt expenses, and the balance of the allowance for doubtful accounts reduces the gross receivables amount to a net amount that is an estimate of fair value. When specific receivables are deemed to be uncollectible, they are written off by reducing accounts receivable and the allowance for doubtful accounts. The allowance for doubtful accounts is called a contra asset account because it is netted against (i.e., reduces) the balance of accounts receivable, which is an asset account. SAP Group’s balance sheet, for example, reports current net trade and other receivables of €2,546 million as of 31 December 2009. The amount of the allowance for doubtful accounts (€48 million) is disclosed in the notes to the financial statements. Apple discloses the allowance for doubtful accounts on the balance sheet; as of 26 September 2009, the allowance was $52 million. The $3,361 million of accounts receivable on that date is net of the allowance. Apple’s disclosures state that the allowance is based on “historical experience, the age of the accounts receivable balances, credit quality of the Company’s customers, current economic conditions, and other factors that may affect customers’ ability to pay.” The age of an accounts receivable balance refers to the length of time the receivable has been outstanding, including how many days past the due date.
Another relevant aspect of accounts receivable is the concentration of credit risk. For example, SAP Group’s note on trade and other receivables discloses that concentration of credit risk is limited because they have a large customer base diversified across various industries and countries, and because no single customer accounted for 10 percent or more of either revenue or receivables.
EXAMPLE 5-1 Analysis of Accounts Receivable
1. Based on the balance sheet excerpt for Apple Inc. in Exhibit 5-5, what percentage of its total accounts receivable in 2009 and 2008 does Apple estimate will be uncollectible?
2. In general, how does the amount of allowance for doubtful accounts relate to bad debt expense?
3. In general, what are some factors that could cause a company’s allowance for doubtful accounts to decrease?
Solution to 1: ($ millions) The percentage of 2009 accounts receivable estimated to be uncollectible is 1.5 percent, calculated as $52/($3,361+$52). Note that the $3,361 is net of the $52 allowance, so the gross amount of accounts receivable is determined by adding the allowance to the net amount. The percentage of 2008 accounts receivable estimated to be uncollectible is 1.9 percent [$47/($2,422+$47)].
Solution to 2: Bad debt expense is an expense of the period, based on a company’s estimate of the percentage of credit sales in the period, for which cash will ultimately not be collected. The allowance for bad debts is a contra asset account, which is netted against the asset accounts receivable.
To record the estimated bad debts, a company recognizes a bad debt expense (which affects net income) and increases the balance in the allowance for doubtful accounts by the same amount. To record the write off of a particular account receivable, a company reduces the balance in the allowance for doubtful accounts and reduces the balance in accounts receivable by the same amount.
Solution to 3: In general, a decrease in a company’s allowance for doubtful accounts in absolute terms could be caused by a decrease in the amount of credit sales.
Some factors that could cause a company’s allowance for doubtful accounts to decrease as a percentage of accounts receivable include the following:
- Improvements in the credit quality of the company’s existing customers (whether driven by a customer-specific improvement or by an improvement in the overall economy);
- Stricter credit policies (for example, refusing to allow less creditworthy customers to make credit purchases and instead requiring them to pay cash, to provide collateral, or to provide some additional form of financial backing); and/or
- Stricter risk management policies (for example, buying more insurance against potential defaults).
In addition to the business factors noted previously, because the allowance is based on management’s estimates of collectability, management can potentially bias these estimates to manipulate reported earnings. For example, a management team aiming to increase reported income could intentionally overestimate collectability and underestimate the bad debt expense for a period. Conversely, in a period of good earnings, management could underestimate collectability and overestimate the bad debt expense with the intent of reversing the bias in a period of poorer earnings.
3.1.4. Inventories
Inventories are physical products that will eventually be sold to the company’s customers, either in their current form (finished goods) or as inputs into a process to manufacture a final product (raw materials and work-in-process). Like any manufacturer, Apple holds inventories. The 2009 balance sheet of Apple Inc. shows $455 million of inventories. SAP Group’s balance sheet does not include a line item for inventory, but its note disclosures indicate that inventory is included as a part of other nonfinancial assets on its balance sheet. SAP Group is primarily a software and services provider and the amount of its inventory is not material enough to require disclosure as a separate line item on the balance sheet.
Inventories are measured at the lower of cost and net realizable value under IFRS, and the lower of cost or market under U.S. GAAP. The cost of inventories comprises all costs of purchase, costs of conversion, and other costs incurred in bringing the inventories to their present location and condition. The following amounts are excluded from the determination of inventory costs:
- Abnormal amounts of wasted materials, labor, and overheads.
- Storage costs, unless they are necessary prior to a further production process.
- Administrative overheads.
- Selling costs.
The following techniques can be used to measure the cost of inventories if the resulting valuation amount approximates cost:
- Standard cost, which should take into account the normal levels of materials, labor, and actual capacity. The standard cost should be reviewed regularly to ensure that it approximates actual costs.
- The retail method in which the sales value is reduced by the gross margin to calculate cost. An average gross margin percentage should be used for each homogeneous group of items. In addition, the impact of marked-down prices should be taken into consideration.
Net realizable value (NRV), the measure used by IFRS, is the estimated selling price less the estimated costs of completion and costs necessary to make the sale. Under U.S. GAAP, market value is current replacement cost but with upper and lower limits: It cannot exceed NRV and cannot be lower than NRV less a normal profit margin.
If the net realizable value (under IFRS) or market value (under U.S. GAAP) of a company’s inventory falls below its carrying amount, the company must write down the value of the inventory. The loss in value is reflected in the income statement. For example, within its Management’s Discussion and Analysis and notes, Apple indicates that the company reviews its inventory each quarter and records write-downs of inventory that has become obsolete, exceeds anticipated demand, or is carried at a value higher than its market value. Under IFRS, if inventory that was written down in a previous period subsequently increases in value, the amount of the original write-down is reversed. Subsequent reversal of an inventory write-down is not permitted under U.S. GAAP.
When inventory is sold, the cost of that inventory is reported as an expense, “cost of goods sold.” Accounting standards allow different valuation methods for determining the amounts that are included in cost of goods sold on the income statement and thus the amounts that are reported in inventory on the balance sheet. (Inventory valuation methods are referred to as cost formulas and cost flow assumptions under IFRS and U.S. GAAP, respectively.) IFRS allows only the first-in, first-out (FIFO), weighted average cost, and specific identification methods. Some accounting standards (such as U.S. GAAP) also allow last-in, first-out (LIFO) as an additional inventory valuation method. The LIFO method is not allowed under IFRS.
EXAMPLE 5-2 Analysis of Inventory
Cisco Systems is a global provider of networking equipment. In its third quarter 2001 Form 10-Q filed with the U.S. Securities and Exchange Commission (U.S. SEC) on 1 June 2001, the company made the following disclosure:
We recorded a provision for inventory, including purchase commitments, totaling $2.36 billion in the third quarter of fiscal 2001, of which $2.25 billion related to an additional excess inventory charge. Inventory purchases and commitments are based upon future sales forecasts. To mitigate the component supply constraints that have existed in the past, we built inventory levels for certain components with long lead times and entered into certain longer-term commitments for certain components. Due to the sudden and significant decrease in demand for our products, inventory levels exceeded our requirements based on current 12-month sales forecasts. This additional excess inventory charge was calculated based on the inventory levels in excess of 12-month demand for each specific product. We do not currently anticipate that the excess inventory subject to this provision will be used at a later date based on our current 12-month demand forecast.
After the inventory charge, Cisco reported approximately $2 billion of inventory on the balance sheet, suggesting that the write-off amounted to approximately half of its inventory. In addition to the obvious concerns raised as to management’s poor performance in anticipating how much inventory was required, many analysts were concerned about how the write-off would affect Cisco’s future reported earnings. If this inventory is sold in a future period, a “gain” could be reported based on a lower cost basis for the inventory. In this case, management indicated that the intent was to scrap the inventory. When the company subsequently released its annual earnings, the press release stated:8
Net sales for fiscal 2001 were $22.29 billion, compared with $18.93 billion for fiscal 2000, an increase of 18%. Pro forma net income, which excludes the effects of acquisition charges, payroll tax on stock option exercises, restructuring costs and other special charges, excess inventory charge (benefit), and net gains realized on minority investments, was $3.09 billion or $0.41 per share for fiscal 2001, compared with pro forma net income of $3.91 billion or $0.53 per share for fiscal 2000, decreases of 21% and 23%, respectively.
Actual net loss for fiscal 2001 was $1.01 billion or $0.14 per share, compared with actual net income of $2.67 billion or $0.36 per share for fiscal 2000.
1. What concerns would an analyst likely have about the company’s $2.3 billion write-off of inventory? What is the significance of the company indicating its intent to scrap the written off inventory?
2. What concerns might an analyst have about the company’s earnings press release when the company subsequently released its annual earnings?
Solution to 1: First, an analyst would likely have concerns about management’s abilities to anticipate how much and what type of inventory was required. While errors in forecasting demand are understandable, the amount of inventory written off represented about half of the company’s inventory. A second concern would relate to how the write-off would affect the company’s future reported earnings. If the inventory that had been written off were sold in a future period, a “gain” could be reported based on a lower cost basis for the inventory. The company’s intent to scrap the written off inventory would alleviate, but not eliminate, concerns about distortions to future reported earnings.
Solution to 2: An analyst might be concerned that the company’s press release focused mainly on “pro forma earnings,” which excluded the impact of many items, including the inventory write-off. The company only gave a brief mention of actual (U.S. GAAP) results.
Note: A 2003 SEC regulation now requires companies to give at least equal emphasis to GAAP measures (for example, reported net income) when using a non-GAAP measure (for example, pro forma net income) and to provide a reconciliation of the two measures.9
3.1.5. Other Current Assets
The amounts shown in “other current assets” reflect items that are individually not material enough to require a separate line item on the balance sheet and so are aggregated into a single amount. Companies usually disclose the components in a note to the financial statements. A typical item included in other current assets is prepaid expenses. Prepaid expenses are normal operating expenses that have been paid in advance. Because expenses are recognized in the period in which they are incurred—and not necessarily the period in which the payment is made—the advance payment of a future expense creates an asset. The asset (prepaid expenses) will be recognized as an expense in future periods as it is used up. For example, consider prepaid insurance. Assume a company pays its insurance premium for coverage over the next calendar year on 31 December of the current year. At the time of the payment, the company recognizes an asset (prepaid insurance expense). The expense is not incurred at that date; the expense is incurred as time passes (in this example, one-twelfth, 1/12, in each following month). Therefore, the expense is recognized and the value of the asset is reduced in the financial statements over the course of the year.
Portions of the amounts shown as tax assets on SAP’s balance sheet and deferred tax assets on Apple’s balance sheet represent income taxes incurred prior to the time that the income tax expense will be recognized on the income statement. Deferred tax assets may result when the actual income tax payable based on income for tax purposes in a period exceeds the amount of income tax expense based on the reported financial statement income due to temporary timing differences. For example, a company may be required to report certain income for tax purposes in the current period but to defer recognition of that income for financial statement purposes to subsequent periods. In this case, the company will pay income tax as required by tax laws, and the difference between the taxes payable and the tax expense related to the income for which recognition was deferred on the financial statements will be reported as a deferred tax asset. When the income is subsequently recognized on the income statement, the related tax expense is also recognized, which will reduce the deferred tax asset.
Also, a company may claim certain expenses for financial statement purposes that it is only allowed to claim in subsequent periods for tax purposes. In this case, as in the previous example, the financial statement income before taxes is less than taxable income. Thus, income taxes payable based on taxable income exceeds income tax expense based on accounting net income before taxes. The difference is expected to reverse in the future when the income reported on the financial statements exceeds the taxable income as a deduction for the expense becomes allowed for tax purposes. Deferred tax assets may also result from carrying forward unused tax losses and credits (these are not temporary timing differences). Deferred tax assets are only to be recognized if there is an expectation that there will be taxable income in the future, against which the temporary difference or carried forward tax losses or credits can be applied to reduce taxes payable.
3.2. Current Liabilities
Current liabilities are those liabilities that are expected to be settled in the entity’s normal operating cycle, held primarily for trading, or due to be settled within 12 months after the balance sheet date. Exhibit 5-6 and Exhibit 5-7 present balance sheet excerpts for SAP Group and Apple Inc. showing the line items for the companies’ current liabilities. Some of the common types of current liabilities, including trade payables, financial liabilities, accrued expenses, and deferred income, are discussed below.
EXHIBIT 5-6 SAP Group Consolidated Statements of Financial Position [Excerpt: Current Liabilities Detail] (in millions of €)
Source: SAP Group 2009 annual report.
| As of 31 December | ||
| 2009 | 2008 | |
| Assets | ||
| Total current assets | 5,255 | 5,571 |
| Total noncurrent assets | 8,119 | 8,329 |
| Total assets | 13,374 | 13,900 |
| Equity and liabilities | ||
| Trade and other payables | 638 | 599 |
| Tax liabilities | 125 | 363 |
| Bank loans and other financial liabilities | 146 | 2,563 |
| Other nonfinancial liabilities | 1,577 | 1,428 |
| Provisions | 332 | 248 |
| Deferred income | 598 | 623 |
| Total current liabilities | 3,416 | 5,824 |
| Total noncurrent liabilities | 1,467 | 905 |
| Total liabilities | 4,883 | 6,729 |
| Total equity | 8,491 | 7,171 |
| Equity and liabilities | 13,374 | 13,900 |
EXHIBIT 5-7 Apple Inc. Consolidated Balance Sheet [Excerpt: Current Liabilities Detail] (in millions of $)
Source: Apple Inc. 2009 annual report (Form 10K/A).
| 26 September 2009 | 27 September 2008 | |
| Assets | ||
| Total current assets | 31,555 | 30,006 |
| [All other assets] | 15,946 | 6,165 |
| Total assets | 47,501 | 36,171 |
| Liabilities and shareholders’ equity | ||
| Accounts payable | 5,601 | 5,520 |
| Accrued expenses | 3,852 | 4,224 |
| Deferred revenue | 2,053 | 1,617 |
| Total current liabilities | 11,506 | 11,361 |
| [Total noncurrent liabilities] | 4,355 | 2,513 |
| Total liabilities | 15,861 | 13,874 |
| Total shareholders’ equity | 31,640 | 22,297 |
| Total liabilities and shareholders’ equity | 47,501 | 36,171 |
Note: The italicized subtotals presented in this excerpt are not explicitly shown on the face of the financial statement as prepared by the company.
Trade payables, also called accounts payable, are amounts that a company owes its vendors for purchases of goods and services. In other words, these represent the unpaid amount as of the balance sheet date of the company’s purchases on credit. An issue relevant to analysts is the trend in overall levels of trade payables relative to purchases (a topic to be addressed further in ratio analysis). Significant changes in accounts payable relative to purchases could signal potential changes in the company’s credit relationships with its suppliers. The general term “trade credit” refers to credit provided to a company by its vendors. Trade credit is a source of financing that allows the company to make purchases and then pay for those purchases at a later date.
Notes payable are financial liabilities owed by a company to creditors, including trade creditors and banks, through a formal loan agreement. Any notes payable, loans payable, or other financial liabilities that are due within one year (or the operating cycle, whichever is longer) appear in the current liability section of the balance sheet. In addition, any portions of long-term liabilities that are due within one year (i.e., the current portion of long-term liabilities) are also shown in the current liability section of the balance sheet. On SAP Group’s balance sheet, current liabilities include bank loans and other financial liabilities. Apple Inc. does not have any current notes payable or loans payable.
Income taxes payable reflect taxes, based on taxable income, that have not yet been paid. SAP Group’s balance sheet shows €125 million of tax liabilities in its current liabilities. Apple Inc.’s balance sheet does not show a separate line item for current taxes payable; instead a note discloses that income taxes payable of $430 million are included within the $3,852 million of “Accrued expenses.” Accrued expenses (also called accrued expenses payable, accrued liabilities, and other nonfinancial liabilities) are expenses that have been recognized on a company’s income statement but which have not yet been paid as of the balance sheet date. In addition to income taxes payable, other common examples of accrued expenses are accrued interest payable, accrued warranty costs, and accrued employee compensation (i.e., wages payable). SAP Group’s notes disclose that the €1,577 million line item of other nonfinancial liabilities, for example, includes €1,343 million of employee-related liabilities.
Deferred income (also called deferred revenue and unearned revenue) arises when a company receives payment in advance of delivery of the goods and services associated with the payment. The company has an obligation either to provide the goods or services or to return the cash received. Examples include lease payments received at the beginning of a lease, fees for servicing office equipment received at the beginning of the service period, and payments for magazine subscriptions received at the beginning of the subscription period. SAP Group’s balance sheet shows deferred income of €598 million at the end of 2009, down slightly from €623 million at the end of 2008. Apple Inc.’s balance sheet shows deferred revenue of $2,053 million at the end of fiscal 2009, up 27 percent from $1,617 million at the end of fiscal 2008. Example 5-3 presents each company’s disclosures about deferred revenue and discusses some of the implications.
EXAMPLE 5-3 Analysis of Deferred Revenue
In the notes to its 2009 financial statements, SAP Group describes its deferred income as follows:
Deferred income consists mainly of prepayments made by our customers for support services and professional services, fees for multiple element arrangements allocated to undelivered elements, and amounts. . .for obligations to perform under acquired support contracts in connection with acquisitions.
Apple’s deferred revenue arises from sales involving components, some delivered at the time of sale and others to be delivered in the future. In its 2009 financial statements, Apple Inc. explains that accounting for sale of some of its products is treated as two deliverables:
. . .The first deliverable is the hardware and software delivered at the time of sale, and the second deliverable is the right included with the purchase of iPhone and Apple TV to receive on a when-and-if-available basis future unspecified software upgrades and features relating to the product’s software. . .the Company is required to estimate a standalone selling price for the unspecified software upgrade right included with the sale of iPhone and Apple TV and recognizes that amount ratably over the 24-month estimated life of the related hardware device. . .
1. In general, in the period a transaction occurs, how would a company’s balance sheet reflect $100 of deferred revenue resulting from a sale? (Assume, for simplicity, that the company receives cash for all sales, the company’s income tax payable is 30 percent based on cash receipts, and the company pays cash for all relevant income tax obligations as they arise. Ignore any associated deferred costs.)
2. In general, how does deferred revenue impact a company’s financial statements in the periods following its initial recognition?
3. Interpret the amounts shown by SAP Group as deferred income and by Apple Inc. as deferred revenue.
4. Both accounts payable and deferred revenue are classified as current liabilities. Discuss the following statements:
A. When assessing a company’s liquidity, the implication of amounts in accounts payable differs from the implication of amounts in deferred revenue.
B. Some investors monitor amounts in deferred revenue as an indicator of future revenue growth.
Solution to 1: In the period that deferred revenue arises, the company would record a $100 increase in the asset Cash and a $100 increase in the liability Deferred Revenues. In addition, because the company’s income tax payable is based on cash receipts and is paid in the current period, the company would record a $30 decrease in the asset Cash and a $30 increase in the asset Deferred Tax Assets. Deferred tax assets increase because the company has paid taxes on revenue it has not yet recognized for accounting purposes. In effect, the company has prepaid taxes from an accounting perspective.
Solution to 2: In subsequent periods, the company will recognize the deferred revenue as it is earned. When the revenue is recognized, the liability Deferred Revenue will decrease. In addition, the tax expense is recognized on the income statement as the revenue is recognized and thus the associated amounts of Deferred Tax Assets will decrease.
Solution to 3: The deferred income on SAP Group’s balance sheet and deferred revenue on Apple Inc.’s balance sheet at the end of their respective 2009 fiscal years will be recognized as revenue, sales, or a similar item in income statements subsequent to the 2009 fiscal year, as the goods or services are provided or the obligation is reduced. The costs of delivering the goods or services will also be recognized.
Solution to 4.A: The amount of accounts payable represents a future obligation to pay cash to suppliers. In contrast, the amount of deferred revenue represents payments that the company has already received from its customers, and the future obligation is to deliver the related services. With respect to liquidity, settling accounts payable will require cash outflows whereas settling deferred revenue obligations will not.
Solution to 4.B: Some investors monitor amounts in deferred revenue as an indicator of future growth because the amounts in deferred revenue will be recognized as revenue in the future. Thus, growth in the amount of deferred revenue implies future growth of that component of a company’s revenue.
This section provides an overview of assets other than current assets, sometimes collectively referred to as noncurrent, long-term, or long-lived assets. The categories discussed are property, plant, and equipment; investment property; intangible assets; goodwill; and financial assets. Exhibit 5-8 and Exhibit 5-9 present balance sheet excerpts for SAP Group and Apple Inc. showing the line items for the companies’ noncurrent assets.
EXHIBIT 5-8 SAP Group Consolidated Statements of Financial Position [Excerpt: Noncurrent Assets Detail] (in millions of €)
Source: SAP Group 2009 annual report.
| As of 31 December | ||
| 2009 | 2008 | |
| Assets | ||
| Total current assets | 5,255 | 5,571 |
| Goodwill | 4,994 | 4,975 |
| Intangible assets | 894 | 1,140 |
| Property, plant, and equipment | 1,371 | 1,405 |
| Other financial assets | 284 | 262 |
| Trade and other receivables | 52 | 41 |
| Other nonfinancial assets | 35 | 32 |
| Tax assets | 91 | 33 |
| Deferred tax assets | 398 | 441 |
| Total noncurrent assets | 8,119 | 8,329 |
| Total assets | 13,374 | 13,900 |
| Equity and liabilities | ||
| Total current liabilities | 3,416 | 5,824 |
| Total noncurrent liabilities | 1,467 | 905 |
| Total liabilities | 4,883 | 6,729 |
| Total equity | 8,491 | 7,171 |
| Equity and liabilities | 13,374 | 13,900 |
EXHIBIT 5-9 Apple Inc. Consolidated Balance Sheet [Excerpt: Noncurrent Assets Detail] (in millions of $)
Source: Apple Inc. 2009 annual report (Form 10K/A).
| 26 September 2009 | 27 September 2008 | |
| Assets | ||
| Total current assets | 31,555 | 30,006 |
| Long-term marketable securities | 10,528 | 2,379 |
| Property, plant, and equipment, net | 2,954 | 2,455 |
| Goodwill | 206 | 207 |
| Acquired intangible assets, net | 247 | 285 |
| Other assets | 2,011 | 839 |
| Total assets | 47,501 | 36,171 |
| Liabilities and shareholders’ equity | ||
| Total current liabilities | 11,506 | 11,361 |
| [Total noncurrent liabilities] | 4,355 | 2,513 |
| Total liabilities | 15,861 | 13,874 |
| Total shareholders’ equity | 31,640 | 22,297 |
| Total liabilities and shareholders’ equity | 47,501 | 36,171 |
Note: The italicized subtotals presented in this excerpt are not explicitly shown on the face of the financial statement as prepared by the company.
4.1. Property, Plant, and Equipment
Property, plant, and equipment (PPE) are tangible assets that are used in company operations and expected to be used (provide economic benefits) over more than one fiscal period. Examples of tangible assets treated as property, plant, and equipment, include land, buildings, equipment, machinery, furniture, and natural resources such as mineral and petroleum resources. IFRS permits companies to report PPE using either a cost model or a revaluation model.10 While IFRS permits companies to use the cost model for some classes of assets and the revaluation model for others, the company must apply the same model to all assets within a particular class of assets. U.S. GAAP permits only the cost model for reporting PPE.
Under the cost model, PPE is carried at amortized cost (historical cost less any accumulated depreciation or accumulated depletion, and less any impairment losses). Historical cost generally consists of an asset’s purchase price, its delivery cost, and any other additional costs incurred to make the asset operable (such as costs to install a machine). Depreciation and depletion is the process of allocating (recognizing as an expense) the cost of a long-lived asset over its useful life. Land is not depreciated. Because PPE is presented on the balance sheet net of depreciation and depreciation expense is recognized in the income statement, the choice of depreciation method and the related estimates of useful life and salvage value impact both a company’s balance sheet and income statement.
Whereas depreciation is the systematic allocation of cost over an asset’s useful life, impairment losses reflect an unanticipated decline in value. Impairment occurs when the asset’s recoverable amount is less than its carrying amount, with terms defined as follows under IFRS:11
- Recoverable amount: The higher of an asset’s fair value less cost to sell, and its value in use.
- Fair value less cost to sell: The amount obtainable in a sale of the asset in an arm’s-length transaction between knowledgeable willing parties, less the costs of the sale.
- Value in use: The present value of the future cash flows expected to be derived from the asset.
When an asset is considered impaired, the company recognizes the impairment loss in the income statement. Reversals of impairment losses are permitted under IFRS but not under U.S. GAAP.
Under the revaluation model, the reported and carrying value for PPE is the fair value at the date of revaluation less any subsequent accumulated depreciation. Changes in the value of PPE under the revaluation model affect equity directly or profit and loss depending upon the circumstances.
In Exhibits 5-8 and 5-9, SAP Group reports €1,371 million of PPE and Apple Inc. reports $2,954 million of PPE at the end of fiscal year 2009. For SAP Group, PPE represents approximately 10 percent of total assets and for Apple, PPE represents approximately 6 percent of total assets. SAP Group discloses in its notes that land is not depreciated, that they use a cost model for PPE, and that PPE are generally depreciated over their expected useful lives using the straight line method. Apple Inc. discloses similar policies but does not specifically disclose that land is not depreciated.
4.2. Investment Property
Some property is not used in the production of goods or services or for administrative purposes. Instead, it is used to earn rental income or capital appreciation (or both). Under IFRS, such property is considered to be investment property.12 U.S. GAAP does not include a specific definition for investment property. IFRS provides companies with the choice to report investment property using either a cost model or a fair value model. In general, a company must apply its chosen model (cost or fair value) to all of its investment property. The cost model for investment property is identical to the cost model for PPE: In other words, investment property is carried at cost less any accumulated depreciation and any accumulated impairment losses. Under the fair value model, investment property is carried at its fair value. When a company uses the fair value model to measure the value of its investment property, any gain or loss arising from a change in the fair value of the investment property is recognized in profit and loss, i.e., on the income statement, in the period in which it arises.13
Neither SAP Group nor Apple disclose ownership of investment property. The types of companies that typically hold investment property are real estate investment companies or property management companies. Entities such as life insurance companies and endowment funds may also hold investment properties as part of their investment portfolio.
4.3. Intangible Assets
Intangible assets are identifiable nonmonetary assets without physical substance.14 An identifiable asset can be acquired singly (can be separated from the entity) or is the result of specific contractual or legal rights or privileges. Examples include patents, licenses, and trademarks. The most common asset that is not a separately identifiable asset is accounting goodwill, which arises in business combinations and is discussed further in Section 4.4.
IFRS allows companies to report intangible assets using either a cost model or a revaluation model. The revaluation model can only be selected when there is an active market for an intangible asset. These measurement models are essentially the same as described for PPE. U.S. GAAP permits only the cost model.
For each intangible asset, a company assesses whether the useful life of the asset is finite or indefinite. Amortization and impairment principles apply as follows:
- An intangible asset with a finite useful life is amortized on a systematic basis over the best estimate of its useful life, with the amortization method and useful life estimate reviewed at least annually.
- Impairment principles for an intangible asset with a finite useful life are the same as for PPE.
- An intangible asset with an indefinite useful life is not amortized. Instead, at least annually, the reasonableness of assuming an indefinite useful life for the asset is reviewed and the asset is tested for impairment.
Financial analysts have traditionally viewed the values assigned to intangible assets, particularly goodwill, with caution. Consequently, in assessing financial statements, analysts often exclude the book value assigned to intangibles, reducing net equity by an equal amount and increasing pretax income by any amortization expense or impairment associated with the intangibles. An arbitrary assignment of zero value to intangibles is not advisable; instead, an analyst should examine each listed intangible and assess whether an adjustment should be made. Note disclosures about intangible assets may provide useful information to the analyst. These disclosures include information about useful lives, amortization rates and methods, and impairment losses recognized or reversed.
Further, a company may have developed intangible assets internally that can only be recognized in certain circumstances. Companies may also have assets that are never recorded on a balance sheet because they have no physical substance and are nonidentifiable. These assets might include management skill, name recognition, a good reputation, and so forth. Such assets are valuable and are, in theory, reflected in the price at which the company’s equity securities trade in the market (and the price at which the entirety of the company’s equity would be sold in an acquisition transaction). Such assets may be recognized as goodwill if a company is acquired, but are not recognized until an acquisition occurs.
4.3.1. Identifiable Intangibles
Under IFRS, identifiable intangible assets are recognized on the balance sheet if it is probable that future economic benefits will flow to the company and the cost of the asset can be measured reliably. Examples of identifiable intangible assets include patents, trademarks, copyrights, franchises, licenses, and other rights. Identifiable intangible assets may have been created internally or purchased by a company. Determining the cost of internally created intangible assets can be difficult and subjective. For these reasons, under IFRS and U.S. GAAP, the general requirement is that internally created identifiable intangibles are expensed rather than reported on the balance sheet.
IFRS provides that for internally created intangible assets, the company must separately identify the research phase and the development phase.15 The research phase includes activities that seek new knowledge or products. The development phase occurs after the research phase and includes design or testing of prototypes and models. IFRS require that costs to internally generate intangible assets during the research phase must be expensed on the income statement. Costs incurred in the development stage can be capitalized as intangible assets if certain criteria are met, including technological feasibility, the ability to use or sell the resulting asset, and the ability to complete the project.
U.S. GAAP prohibits the capitalization as an asset of most costs of internally developed intangibles and research and development. All such costs usually must be expensed. Costs related to the following categories are typically expensed under IFRS and U.S. GAAP. They include:
- Internally generated brands, mastheads, publishing titles, customer lists, etc.
- Start-up costs.
- Training costs.
- Administrative and other general overhead costs.
- Advertising and promotion.
- Relocation and reorganization expenses.
- Redundancy and other termination costs.
Generally, acquired intangible assets are reported as separately identifiable intangibles (as opposed to goodwill) if they arise from contractual rights (such as a licensing agreement), other legal rights (such as patents), or have the ability to be separated and sold (such as a customer list).
EXAMPLE 5-4 Measuring Intangible Assets
Alpha Inc., a motor vehicle manufacturer, has a research division that worked on the following projects during the year:
Project 1: Research aimed at finding a steering mechanism that does not operate like a conventional steering wheel but reacts to the impulses from a driver’s fingers.
Project 2: The design of a prototype welding apparatus that is controlled electronically rather than mechanically. The apparatus has been determined to be technologically feasible, salable, and feasible to produce.
The following is a summary of the expenses of the research division (in thousands of €):
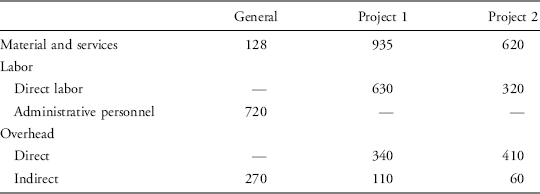
Five percent of administrative personnel costs can be attributed to each of Projects 1 and 2. Explain the accounting treatment of Alpha’s costs for Projects 1 and 2 under IFRS and U.S. GAAP.
Solution: Under IFRS, the capitalization of development costs for Projects 1 and 2 would be as follows:
| Amount Capitalized as an Asset (€’000) | |
| Project 1: Classified as in the research stage, so all costs are recognized as expenses | NIL |
| Project 2: Classified as in the development stage, so costs may be capitalized. Note that administrative costs are not capitalized. | (620+320+410+60)=1,410 |
Under U.S. GAAP, the costs of Projects 1 and 2 are expensed.
As presented in Exhibits 5-8 and 5-9, SAP Group’s 2009 balance sheet shows €894 million of intangible assets, and Apple’s 2009 balance sheet shows acquired intangible assets, net of $247 million.
4.4. Goodwill
When one company acquires another, the purchase price is allocated to all the identifiable assets (tangible and intangible) and liabilities acquired, based on fair value. If the purchase price is greater than the acquirer’s interest in the fair value of the identifiable assets and liabilities acquired, the excess is described as goodwill and is recognized as an asset. To understand why an acquirer would pay more to purchase a company than the fair value of the target company’s identifiable assets and liabilities, consider the following three observations. First, as noted, certain items not recognized in a company’s own financial statements (e.g., its reputation, established distribution system, trained employees) have value. Second, a target company’s expenditures in research and development may not have resulted in a separately identifiable asset that meets the criteria for recognition but nonetheless may have created some value. Third, part of the value of an acquisition may arise from strategic positioning versus a competitor or from perceived synergies. The purchase price might not pertain solely to the separately identifiable assets and liabilities acquired and thus may exceed the value of those net assets due to the acquisition’s role in protecting the value of all of the acquirer’s existing assets or to cost savings and benefits from combining the companies.
The subject of recognizing goodwill in financial statements has found both proponents and opponents among professionals. The proponents of goodwill recognition assert that goodwill is the present value of excess returns that a company is able to earn. This group claims that determining the present value of these excess returns is analogous to determining the present value of future cash flows associated with other assets and projects. Opponents of goodwill recognition claim that the prices paid for acquisitions often turn out to be based on unrealistic expectations, thereby leading to future write-offs of goodwill.
Analysts should distinguish between accounting goodwill and economic goodwill. Economic goodwill is based on the economic performance of the entity, whereas accounting goodwill is based on accounting standards and is reported only in the case of acquisitions. Economic goodwill is important to analysts and investors, and it is not necessarily reflected on the balance sheet. Instead, economic goodwill is reflected in the stock price (at least in theory). Some financial statement users believe that goodwill should not be listed on the balance sheet, because it cannot be sold separately from the entity. These financial statement users believe that only assets that can be separately identified and sold should be reflected on the balance sheet. Other financial statement users analyze goodwill and any subsequent impairment charges to assess management’s performance on prior acquisitions.
Under both IFRS and U.S. GAAP, accounting goodwill arising from acquisitions is capitalized. Goodwill is not amortized but is tested for impairment annually. If goodwill is deemed to be impaired, an impairment loss is charged against income in the current period. An impairment loss reduces current earnings. An impairment loss also reduces total assets, so some performance measures, such as return on assets (net income divided by average total assets), may actually increase in future periods. An impairment loss is a noncash item.
Accounting standards’ requirements for recognizing goodwill can be summarized by the following three steps:
1. The total cost to purchase the target company (the acquiree) is determined.
2. The acquiree’s identifiable assets are measured at fair value. The acquiree’s liabilities and contingent liabilities are measured at fair value. The difference between the fair value of identifiable assets and the fair value of the liabilities and contingent liabilities equals the net identifiable assets acquired.
3. Goodwill arising from the purchase is the excess of (a) the cost to purchase the target company and (b) the net identifiable assets acquired. Occasionally, a transaction will involve the purchase of net identifiable assets with a value greater than the cost to purchase. Such a transaction is called a “bargain purchase.” Any gain from a bargain purchase is recognized in profit and loss in the period in which it arises.16
Companies are also required to disclose information that enables users to evaluate the nature and financial effect of business combinations. The required disclosures include, for example, the acquisition date fair value of the total cost to purchase the target company, the acquisition date amount recognized for each major class of assets and liabilities, and a qualitative description of the factors that make up the goodwill recognized.
Despite the guidance incorporated in accounting standards, analysts should be aware that the estimations of fair value involve considerable management judgment. Values for intangible assets, such as computer software, might not be easily validated when analyzing acquisitions. Management judgment about valuation in turn impacts current and future financial statements because identifiable intangible assets with definite lives are amortized over time. In contrast, neither goodwill nor identifiable intangible assets with indefinite lives are amortized; instead both are tested annually for impairment.
The recognition and impairment of goodwill can significantly affect the comparability of financial statements between companies. Therefore, analysts often adjust the companies’ financial statements by removing the impact of goodwill. Such adjustments include:
- Excluding goodwill from balance sheet data used to compute financial ratios.
- Excluding goodwill impairment losses from income data used to examine operating trends.
In addition, analysts can develop expectations about a company’s performance following an acquisition by taking into account the purchase price paid relative to the net assets and earnings prospects of the acquired company.
EXAMPLE 5-5 Goodwill Impairment
Safeway, Inc., (NYSE:SWY) is a North American food and drug retailer. On 25 February 2010, Safeway issued a press release that included the following information:
Safeway Inc. today reported a net loss of $1,609.1 million ($4.06 per diluted share) for the 16-week fourth quarter of 2009. Excluding a noncash goodwill impairment charge of $1,818.2 million, net of tax ($4.59 per diluted share), net income would have been $209.1 million ($0.53 per diluted share). Net income was $338.0 million ($0.79 per diluted share) for the 17-week fourth quarter of 2008.
In the fourth quarter of 2009, Safeway recorded a noncash goodwill impairment charge of $1,974.2 million ($1,818.2 million, net of tax). The impairment was due primarily to Safeway’s reduced market capitalization and a weak economy.. . .The goodwill originated from previous acquisitions.
Safeway’s balance sheet as of 2 January 2010 showed goodwill of $426.6 million and total assets of $14,963.6 million. The company’s balance sheet as of 3 January 2009 showed goodwill of $2,390.2 million and total assets of $17,484.7 million.
1. How significant is this goodwill impairment charge?
2. With reference to acquisition prices, what might this goodwill impairment indicate?
Solution to 1: The goodwill impairment was more than 80 percent of the total value of goodwill and 11 percent of total assets, so it was clearly significant. (The charge of $1,974.2 million equals 82.6 percent of the $2,390.2 million of goodwill at the beginning of the year and 11.3 percent of the $17,484.7 million total assets at the beginning of the year.)
Solution to 2: The goodwill had originated from previous acquisitions. The impairment charge implies that the acquired operations are now worth less than the price that was paid for their acquisition.
As presented in Exhibits 5-8 and 5-9, SAP Group’s 2009 balance sheet shows €4,994 million of goodwill, and Apple’s 2009 balance sheet shows goodwill of $206 million. Goodwill represents 37.3 percent of SAP Group’s total assets and only 0.4 percent of Apple’s total assets. An analyst may be concerned that goodwill represents such a high proportion of SAP Group’s total assets.
4.5. Financial Assets
IFRS define a financial instrument as a contract that gives rise to a financial asset of one entity, and a financial liability or equity instrument of another entity.17 This section will focus on financial assets such as a company’s investments in stocks issued by another company or its investments in the notes, bonds, or other fixed-income instruments issued by another company (or issued by a governmental entity). Financial liabilities such as notes payable and bonds payable issued by the company itself will be discussed in the liability portion of this chapter. Some financial instruments may be classified as either an asset or a liability depending on the contractual terms and current market conditions. One example of such a financial instrument is a derivative. A derivative is a financial instrument for which the value is derived based on some underlying factor (interest rate, exchange rate, commodity price, security price, or credit rating) and for which little or no initial investment is required.
All financial instruments are recognized when the entity becomes a party to the contractual provisions of the instrument. In general, there are two basic alternative ways that financial instruments are measured: fair value or amortized cost.18 Recall that fair value is the arm’s length transaction price at which an asset could be exchanged or a liability settled between knowledgeable and willing parties under IFRS, and the price that would be received to sell an asset or paid to transfer a liability under U.S. GAAP. The amortized cost of a financial asset (or liability) is the amount at which it was initially recognized, minus any principal repayments, plus or minus any amortization of discount or premium, and minus any reduction for impairment.
Financial assets are measured at amortized cost if the asset’s cash flows occur on specified dates and consist solely of principal and interest, and if the business model is to hold the asset to maturity. This category of asset is referred to as held-to-maturity. An example is an investment in a long-term bond issued by another company; the value of the bond will fluctuate, for example with interest rate movements, but if the bond is classified as held-to-maturity, it will be measured at amortized cost. Other types of financial assets measured at historical cost are loans (to other companies).
Financial assets not measured at amortized cost are measured at fair value. For financial instruments measured at fair value, there are two basic alternatives in how net changes in fair value are recognized: as profit or loss on the income statement, or as other comprehensive income (loss) that bypasses the income statement. Note that these alternatives refer to unrealized changes in fair value, i.e., changes in the value of a financial asset that has not been sold and is still owned at the end of the period. Unrealized gains and losses are also referred to as holding period gains and losses. If a financial asset is sold within the period, a gain is realized if the selling price is greater than the carrying value and a loss is realized if the selling price is less than the carrying value. When a financial asset is sold, any realized gain or loss is reported on the income statement. The category held for trading (or “trading securities” under U.S. GAAP) refers to a category of financial assets that is acquired primarily for the purpose of selling in the near term. These assets are likely to be held only for a short period of time. These trading assets are measured at fair value, and any unrealized holding gains or losses are recognized as profit or loss on the income statement. Mark-to-market refers to the process whereby the value of a financial instrument is adjusted to reflect current fair value based on market prices.
Some financial assets are not classified as held for trading, even though they are available to be sold. Such available-for-sale assets are measured at fair value, with any unrealized holding gains or losses recognized in other comprehensive income. The “available-for-sale” classification no longer appears in IFRS as of 2010, although the relevant standard (IFRS 9 Financial Instruments) is not effective until 2013. However, although the available-for-sale category will not exist, IFRS still permit certain equity investments to be measured at fair value with any unrealized holding gains or losses recognized in other comprehensive income. Specifically, at the time a company buys an equity investment that is not held for trading, the company is permitted to make an irrevocable election to measure the asset in this manner. These assets are referred to as “financial assets measured at fair value through other comprehensive income.”19
Exhibit 5-10 summarizes how various financial assets are classified and measured.
EXHIBIT 5-10 Measurement of Financial Assets
| Measured at Fair Value | Measured at Cost or Amortized Cost |
|
|
*As described above, the available-for-sale category will no longer be a choice under IFRS when IFRS 9 becomes effective in 2013.
To illustrate the different accounting treatments of the gains and losses on financial assets, consider an entity that invests €100,000,000 on 1 January 200X in a fixed-income security investment, with a 5 percent coupon paid semi-annually. After six months, the company receives the first coupon payment of €2,500,000. Additionally, market interest rates have declined such that the value of the fixed-income investment has increased by €2,000,000 as of 30 June 200X. Exhibit 5-11 illustrates how this situation will be portrayed in the balance sheet assets and equity, as well as the income statement (ignoring taxes) of the entity concerned, under each of the following three accounting policies for financial assets: assets held for trading purposes, assets available for sale, and held-to-maturity assets.
EXHIBIT 5-11 Accounting for Gains and Losses on Marketable Securities
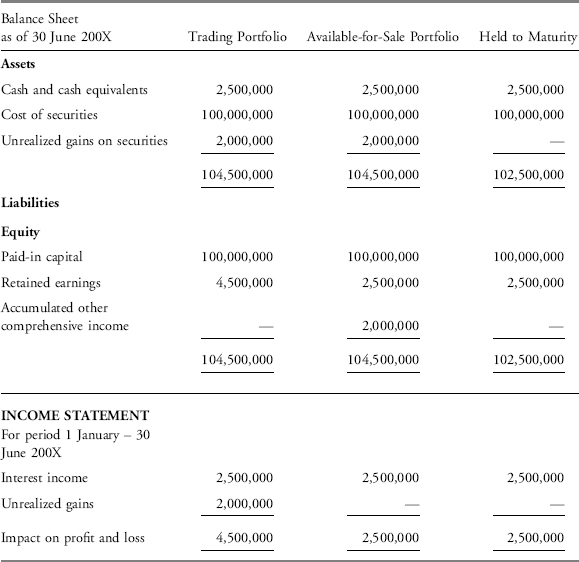
In the case of marketable securities classified as either trading or available-for-sale, the investments are listed under assets and measured at fair market value. To highlight the impact of the change in value, Exhibit 5-11 shows the unrealized gain on a separate line. Practically, the investments would be listed at their fair value of €102,000,000 on one line within assets. In the case of trading securities, the unrealized gain is included on the income statement and thus reflected in retained earnings within owners’ equity. In the case of available-for-sale securities, the unrealized gain is not included on the income statement as profit and loss; rather, it is treated as part of other comprehensive income and thus reflected in accumulated other comprehensive income within owners’ equity. Other comprehensive income includes gains and losses that have not been reported on the income statement due to particular accounting standards. In the case of held-to-maturity securities, the securities are measured at cost rather than fair value; therefore, no unrealized gain is reflected on either the balance sheet or income statement or through comprehensive income.
In Exhibits 5-4 and 5-8, SAP Group’s 2009 balance sheet shows other financial assets of €486 million (current) and €284 million (noncurrent). The company’s notes disclose that most of these financial assets are loans and receivables, €422 million (current) and €168 million (noncurrent). Also, €87 million of the noncurrent other financial assets are classified as available-for-sale equity investments, of which €62 million are venture capital investments without quoted market prices. The notes disclose that fair values could not be estimated by reference to quoted market prices or by discounting estimated future cash flows and that “such investments are accounted for at cost approximating fair value with impairment being assessed. . .”
In Exhibits 5-5 and 5-9, Apple’s 2009 balance sheet shows $18,201 million of short-term marketable securities and $10,528 million of long-term marketable securities. In total, marketable securities represent around 60 percent of Apple’s $47.5 billion in total assets. Marketable securities plus cash and cash equivalents represent around 72 percent of the company’s total assets. Apple’s notes disclose that most of the company’s marketable securities are fixed-income securities issued by the U.S. government ($3,327 million) or its agencies ($10,835 million), and by other companies including commercial paper ($12,602 million). In accordance with its investment policy, Apple invests in highly rated securities (which the company defines as investment grade, primarily rated single A or better). The company classifies its marketable securities as available for sale and reports them on the balance sheet at fair value. Unrealized gains and losses are reported in other comprehensive income.
All liabilities that are not classified as current are considered to be noncurrent or long-term. Exhibits 5-12 and 5-13 present balance sheet excerpts for SAP Group and Apple Inc. showing the line items for the companies’ noncurrent liabilities.
Both companies’ balance sheets show noncurrent unearned revenue (deferred income for SAP Group and deferred revenue for Apple). These amounts represent the amounts of unearned revenue relating to goods and services expected to be delivered in periods beyond twelve months following the reporting period. The sections that follow focus on two common types of noncurrent (long-term) liabilities: long-term financial liabilities and deferred tax liabilities.
EXHIBIT 5-12 SAP Group Consolidated Statements of Financial Position [Excerpt: Noncurrent Liabilities Detail] (in millions of €)
Source: SAP Group 2009 annual report.
| As of 31 December | ||
| 2009 | 2008 | |
| Assets | ||
| Total current assets | 5,255 | 5,571 |
| Total noncurrent assets | 8,119 | 8,329 |
| Total assets | 13,374 | 13,900 |
| Equity and liabilities | ||
| Total current liabilities | 3,416 | 5,824 |
| Trade and other payables | 35 | 42 |
| Tax liabilities | 239 | 278 |
| Bank loans | 699 | 2 |
| Other financial liabilities | 30 | 38 |
| Financial liabilities | 729 | 40 |
| Other nonfinancial liabilities | 12 | 13 |
| Provisions | 198 | 232 |
| Deferred tax liabilities | 190 | 239 |
| Deferred income | 64 | 61 |
| Total noncurrent liabilities | 1,467 | 905 |
| Total liabilities | 4,883 | 6,729 |
| Total equity | 8,491 | 7,171 |
| Equity and liabilities | 13,374 | 13,900 |
EXHIBIT 5-13 Apple Inc. Consolidated Balance Sheet [Excerpt: Noncurrent Liabilities Detail] (in millions of $)
Source: Apple Inc. 2009 annual report (Form 10K/A).
| 26 September 2009 | 27 September 2008 | |
| Assets | ||
| Total current assets | 31,555 | 30,006 |
| [All other assets] | 15,946 | 6,165 |
| Total assets | 47,501 | 36,171 |
| Liabilities and shareholders’ equity | ||
| Total current liabilities | 11,506 | 11,361 |
| Deferred revenue noncurrent | 853 | 768 |
| Other noncurrent liabilities | 3,502 | 1,745 |
| Total liabilities | 15,861 | 13,874 |
| Total shareholders’ equity | 31,640 | 22,297 |
| Total liabilities and shareholders’ equity | 47,501 | 36,171 |
Note: The italicized subtotals presented in this excerpt are not explicitly shown on the face of the financial statement as prepared by the company.
5.1. Long-Term Financial Liabilities
Typical long-term financial liabilities include loans (i.e., borrowings from banks) and notes or bonds payable (i.e., fixed-income securities issued to investors). Liabilities such as loans payable and bonds payable are usually reported at amortized cost on the balance sheet. At maturity, the amortized cost of the bond (carrying amount) will be equal to the face value of the bond. For example, if a company issues $10,000,000 of bonds at par, the bonds are reported as a long-term liability of $10 million. The carrying amount (amortized cost) from issue to maturity remains at $10 million. As another example, if a company issues $10,000,000 of bonds at a price of 97.50 (a discount to par), the bonds are reported as a liability of $9,750,000. Over the bond’s life, the discount of $250,000 is amortized so that the bond will be listed as a liability of $10,000,000 at maturity. Similarly, any bond premium would be amortized for bonds issued at a price in excess of face or par value.
In certain cases, liabilities such as bonds issued by a company are reported at fair value. Those cases include financial liabilities held for trading, derivatives that are a liability to the company, and some nonderivative instruments such as those which are hedged by derivatives.
SAP Group’s balance sheet in Exhibit 5-12 shows €699 million of bank loans and €30 million of other financial liabilities. Apple’s balance sheet does not show any noncurrent financial liabilities.
5.2. Deferred Tax Liabilities
Deferred tax liabilities result from temporary timing differences between a company’s income as reported for tax purposes (taxable income) and income as reported for financial statement purposes (reported income). Deferred tax liabilities result when taxable income and the actual income tax payable in a period based on it is less than the reported financial statement income before taxes and the income tax expense based on it. Deferred tax liabilities are defined as the amounts of income taxes payable in future periods in respect of taxable temporary differences.20 In the previous discussion of unearned revenue, inclusion of revenue in taxable income in an earlier period created a deferred tax asset (essentially prepaid tax).
Deferred tax liabilities typically arise when items of expense are included in taxable income in earlier periods than for financial statement net income. This results in taxable income being less than income before taxes in the earlier periods. As a result, taxes payable based on taxable income are less than income tax expense based on accounting income before taxes. The difference between taxes payable and income tax expense results in a deferred tax liability—for example, when companies use accelerated depreciation methods for tax purposes and straight-line depreciation methods for financial statement purposes. Deferred tax liabilities also arise when items of income are included in taxable income in later periods—for example, when a company’s subsidiary has profits that have not yet been distributed and thus have not yet been taxed.
SAP Group’s balance sheet in Exhibit 5-12 shows €190 million of deferred tax liabilities. Apple’s balance sheet in Exhibit 5-13 does not show a separate line item for deferred tax liabilities, however, note disclosures indicate that the $3,502 million of noncurrent liabilities reported on Apple’s balance sheet includes deferred tax liabilities of $2,216 million.
Equity is the owners’ residual claim on a company’s assets after subtracting its liabilities.21 It represents the claim of the owner against the company. Equity includes funds directly invested in the company by the owners, as well as earnings that have been reinvested over time. Equity can also include items of gain or loss that are not yet recognized on the company’s income statement.
6.1. Components of Equity
Six potential components comprise total owners’ equity. The first five components listed here comprise equity attributable to owners of parent. The sixth component is the equity attributable to noncontrolling interests.
1. Capital contributed by owners (or common stock, or issued capital). The amount contributed to the company by owners. Ownership of a corporation is evidenced through the issuance of common shares. Common shares may have a par value (or stated value) or may be issued as no par shares (depending on regulations governing the incorporation). Where par or stated value requirements exist, it must be disclosed in the equity section of the balance sheet. In addition, the number of shares authorized, issued, and outstanding must be disclosed for each class of share issued by the company. The number of authorized shares is the number of shares that may be sold by the company under its articles of incorporation. The number of issued shares refers to those shares that have been sold to investors. The number of outstanding shares consists of the issued shares less treasury shares.
2. Preferred shares. Classified as equity or financial liabilities based upon their characteristics rather than legal form. For example, perpetual, nonredeemable preferred shares are classified as equity. In contrast, preferred shares with mandatory redemption at a fixed amount at a future date are classified as financial liabilities. Preferred shares have rights that take precedence over the rights of common shareholders—rights that generally pertain to receipt of dividends and receipt of assets if the company is liquidated.
3. Treasury shares (or treasury stock or own shares repurchased). Shares in the company that have been repurchased by the company and are held as treasury shares, rather than being canceled. The company is able to sell (reissue) these shares. A company may repurchase its shares when management considers the shares undervalued, needs shares to fulfill employees’ stock options, or wants to limit the effects of dilution from various employee stock compensation plans. A purchase of treasury shares reduces shareholders’ equity by the amount of the acquisition cost and reduces the number of total shares outstanding. If treasury shares are subsequently reissued, a company does not recognize any gain or loss from the reissuance on the income statement. Treasury shares are nonvoting and do not receive any dividends declared by the company.
4. Retained earnings. The cumulative amount of earnings recognized in the company’s income statements that have not been paid to the owners of the company as dividends.
5. Accumulated other comprehensive income (or other reserves). The cumulative amount of other comprehensive income or loss. Comprehensive income includes both (a) net income, which is recognized on the income statement and is reflected in retained earnings, and (b) other comprehensive income which is not recognized as part of net income and is reflected in accumulated other comprehensive income.22
6. Noncontrolling interest (or minority interest). The equity interests of minority shareholders in the subsidiary companies that have been consolidated by the parent (controlling) company but that are not wholly owned by the parent company.
Exhibits 5-14 and 5-15 present excerpts of the balance sheets of SAP Group and Apple Inc., respectively, with detailed line items for each company’s equity section. SAP’s balancesheet indicates that the company has 1,226 million shares of no-par common stock outstanding with a corresponding amount shown in issued capital of €1,226 million. Presentation of the amount of treasury shares, −€1,320 million, is explained in the company’s notes:
Treasury shares are recorded at acquisition cost and are presented as a deduction from total equity. Gains and losses on the subsequent reissuance of treasury shares are credited or charged to share premium on an after-tax basis.
Source: SAP Group 2009 annual report
Thus, the line item share premium of €317 million includes amounts from treasury share transactions (and certain other transactions). The amount of retained earnings, €8,571 million, represents the cumulative amount of earnings that the company has recognized in its income statements, net of dividends. SAP Group’s −€317 million of “Other components of equity” includes the company’s accumulated other comprehensive income. The consolidated statement of changes in equity shows that this is composed of €319 million of losses on exchange differences in translation, €13 million gains on remeasuring available-for-sale financial assets, and €11 million losses on cash flow hedges. The balance sheet presents a subtotal for the amount of equity attributable to the parent company €8,477 million followed by the amount of equity attributable to noncontrolling interests. Total equity includes both equity attributable to the parent company and equity attributable to noncontrolling interests.
The equity section of Apple’s balance sheet consists of only three line items: common stock, retained earnings, and accumulated other comprehensive income/(loss). The company holds no treasury stock and has no minority interests.
EXHIBIT 5-14 SAP Group Consolidated Statements of Financial Position [Excerpt: Equity Detail] (in millions of €)
Source: SAP Group 2009 annual report.
| As of 31 December | ||
| 2009 | 2008 | |
| Assets | ||
| Total assets | 13,374 | 13,900 |
| Equity and liabilities | ||
| Total liabilities | 4,883 | 6,729 |
| Issued capital1 | 1,226 | 1,226 |
| Treasury shares | −1,320 | −1,362 |
| Share premium | 317 | 320 |
| Retained earnings | 8,571 | 7,422 |
| Other components of equity | −317 | −437 |
| Equity attributable to owners of parent | 8,477 | 7,169 |
| Noncontrolling interests | 14 | 2 |
| Total equity | 8,491 | 7,171 |
| Equity and liabilities | 13,374 | 13,900 |
1Authorized—not issued or outstanding: 480 million no-par shares at 31 December 2009 and 2008. Authorized—issued and outstanding: 1,226 million no-par shares at 31 December 2009 and 2008.
EXHIBIT 5-15 Apple Inc. Consolidated Balance Sheet [Excerpt: Equity Detail] (in millions of $)
| 26 September 2009 | 27 September 2008 | |
| Assets | ||
| Total assets | 47,501 | 36,171 |
| Liabilities and shareholders’ equity | ||
| Total liabilities | 15,861 | 13,874 |
| Common stock, no par value; 1,800,000,000 shares authorized; 899,805,500 and 888,325,973 shares issued and outstanding, respectively | 8,210 | 7,177 |
| Retained earnings | 23,353 | 15,129 |
| Accumulated other comprehensive income/(loss) | 77 | (9) |
| Total shareholders’ equity | 31,640 | 22,297 |
| Total liabilities and shareholders’ equity | 47,501 | 36,171 |
Source: Apple Inc. 2009 annual report (10K/A).
6.2. Statement of Changes in Equity
The statement of changes in equity (or statement of shareholders’ equity) presents information about the increases or decreases in a company’s equity over a period. IFRS requires the following information in the statement of changes in equity:
- Total comprehensive income for the period;
- The effects of any accounting changes that have been retrospectively applied to previous periods;
- Capital transactions with owners and distributions to owners;
- Reconciliation of the carrying amounts of each component of equity at the beginning and end of the year.23
EXHIBIT 5-16 Excerpt from Apple Inc.’s Consolidated Statements of Changes in Shareholders’ Equity (in millions, except share amounts which are reflected in thousands)
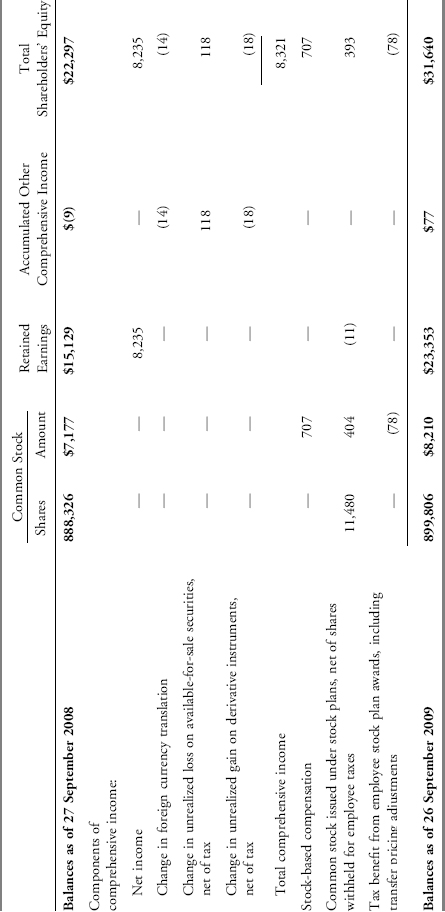
Under U.S. GAAP, the requirement as specified by the SEC is for companies to provide an analysis of changes in each component of stockholders’ equity that is shown in the balance sheet.24
Exhibit 5-16 presents an excerpt from Apple’s Consolidated Statements of Changes in Shareholders’ Equity. The excerpt shows only one of the years presented on the actual statement. It begins with the balance as of 27 September 2008 (i.e., the beginning of fiscal 2009) and presents the analysis of changes to 26 September 2009 in each component of equity that is shown on Apple’s balance sheet. As shown, the company issued 11.48 million new shares in connection with its employee stock plans, increasing the number of shares outstanding from 888.326 million to 899.806 million. The dollar balance in common stock also increased in connection with stock-based compensation. Retained earnings increased by $8,235 million net income, net of an $11 million adjustment in connection with stock plans. For companies that pay dividends, the amount of dividends are shown separately as a deduction from retained earnings. Apple did not pay dividends. The statement also provides details on the $86 million change in Apple’s Accumulated other comprehensive income. Note that the statement provides a subtotal for total comprehensive income that includes net income and each of the components of other comprehensive income.
7. ANALYSIS OF THE BALANCE SHEET
This section describes two tools for analyzing the balance sheet: common-size analysis and balance sheet ratios. Analysis of a company’s balance sheet can provide insight into the company’s liquidity and solvency—as of the balance sheet date—as well as the economic resources the company controls. Liquidity refers to a company’s ability to meet its short-term financial commitments. Assessments of liquidity focus a company’s ability to convert assets to cash and to pay for operating needs. Solvency refers to a company’s ability to meet its financial obligations over the longer term. Assessments of solvency focus on the company’s financial structure and its ability to pay long-term financing obligations.
7.1. Common-Size Analysis of the Balance Sheet
The first technique, vertical common-size analysis, involves stating each balance sheet item as a percentage of total assets.25 Common-size statements are useful in comparing a company’s balance sheet composition over time (time series analysis) and across companies in the same industry. To illustrate, Panel A of Exhibit 5-17 presents a balance sheet for three hypothetical companies. Company C, with assets of $9.75 million is much larger than Company A and Company B, each with only $3.25 million in assets. The common-size balance sheet presented in Panel B facilitates a comparison of these different sized companies.
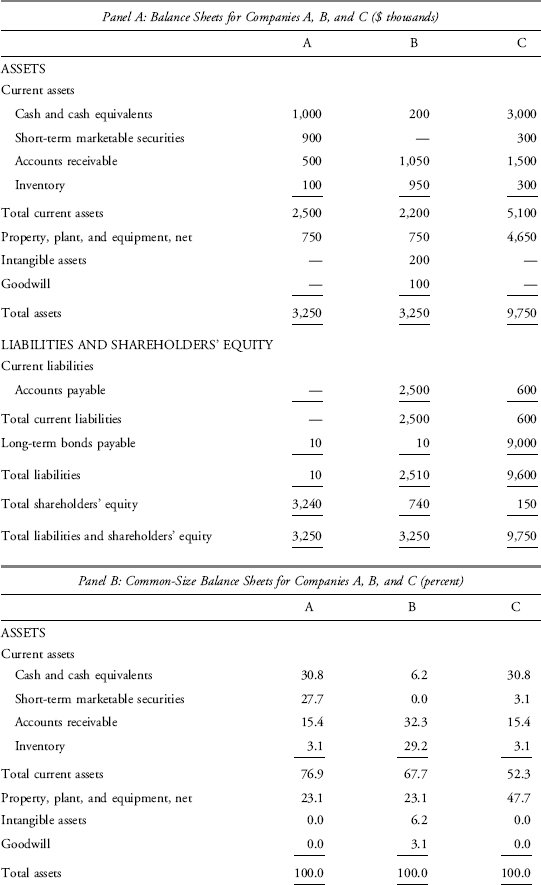
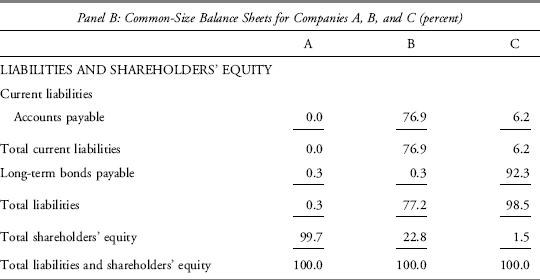
Most of the assets of Company A and B are current assets; however, Company A has nearly 60 percent of its total assets in cash and short-term marketable securities while Company B has only 6 percent of its assets in cash. Company A is more liquid than Company B. Company A shows no current liabilities (its current liabilities round to less than $10 thousand), and it has cash on hand of $1.0 million to meet any near-term financial obligations it might have. In contrast, Company B has $2.5 million of current liabilities which exceed its available cash of only $200 thousand. To pay those near-term obligations, Company B will need to collect some of its accounts receivables, sell more inventory, borrow from a bank, and/or raise more long-term capital (e.g., by issuing more bonds or more equity). Company C also appears more liquid than Company B. It holds over 30 percent of its total assets in cash and short-term marketable securities, and its current liabilities are only 6.2 percent of the amount of total assets.
Company C’s $3.3 million in cash and short-term marketable securities is substantially more than its current liabilities of $600 thousand. Turning to the question of solvency, however, note that 98.5 percent of Company C’s assets are financed with liabilities. If Company C experiences significant fluctuations in cash flows, it may be unable to pay the interest and principal on its long-term bonds. Company A is far more solvent than Company C, with less than 1 percent of its assets financed with liabilities.
Note that these examples are hypothetical only. Other than general comparisons, little more can be said without further detail. In practice, a wide range of factors affect a company’s liquidity management and capital structure. The study of optimal capital structure is a fundamental issue addressed in corporate finance. Capital refers to a company’s long-term debt and equity financing; capital structure refers to the proportion of debt versus equity financing.
Common-size balance sheets can also highlight differences in companies’ strategies. Comparing the asset composition of the companies, Company C has made a greater proportional investment in property, plant, and equipment—possibly because it manufacturers more of its products in-house. The presence of goodwill on Company B’s balance sheet signifies that it has made one or more acquisitions in the past. In contrast, the lack of goodwill on the balance sheets of Company A and Company C suggests that these two companies may have pursued a strategy of internal growth rather than growth by acquisition. Company A may be in either a start-up or liquidation stage of operations as evidenced by the composition of its balance sheet. It has relatively little inventory and no accounts payable. It either has not yet established trade credit or it is in the process of paying off its obligations in the process of liquidating.
EXAMPLE 5-6 Common-Size Analysis
Applying common-size analysis to the excerpts of SAP Group’s balance sheets presented in Exhibits 5-4, 5-6, 5-8, and 5-12, answer the following: In 2009 relative to 2008, which two of the following line items increased as a percentage of assets?
A. Cash and cash equivalents
B. Other financial assets
C. Trade and other receivables
D. Tax assets
E. Bank loans classified as current (i.e., due within one year)
F. Bank loans classified as noncurrent (i.e., due after one year)
Solution: (€ amounts shown are in millions) A and F are correct. Both cash and longer-term bank loans increased as a percentage of total assets. Cash and cash equivalents increased from 9.2 percent of total assets in 2008 (€1,280 ÷ €13,900) to 14.1 percent in 2009 (€1,884 ÷ €13,374). Bank loans due after one year increased from 0.01 percent in 2008 (€2÷ €13,900) to 5.2 percent in 2009 (€699 ÷ €13,374). The company may have borrowed funds for a strategic purpose that it has not yet acted upon.
The other items (other financial assets, trade and other receivables, tax assets, and bank loans classified as current) all decreased both in absolute euro amounts and as a percentage of total assets when compared with the previous year. Note that some amounts of the company’s other financial assets, trade and other receivables, and tax assets are classified as current assets (shown in Exhibit 5-4) and some amounts are classified as noncurrent assets (shown in Exhibit 5-8). The total amounts—current and noncurrent—of other financial assets, trade and other receivables, and tax assets, therefore, are obtained by summing the amounts in Exhibits 5-4 and 5-8.
Overall, the company strengthened its liquidity position in 2009. Total current assets were approximately the same percentage of total assets, whereas cash was a much higher percentage of total assets; total current liabilities were a much smaller percentage of the amount of total assets.
Common-size analysis of the balance sheet is particularly useful in cross-sectional analysis—comparing companies to each other for a particular time period or comparing a company with industry or sector data. The analyst could select individual peer companies for comparison, use industry data from published sources, or compile data from databases. When analyzing a company, many analysts prefer to select the peer companies for comparison or to compile their own industry statistics.
Exhibit 5-18 presents common-size balance sheet data compiled for the 10 sectors of the S&P 500 using 2008 data. The sector classification follows the S&P/MSCI Global Industrial Classification System (GICS). The exhibit presents mean and median common-size balance sheet data for those companies in the S&P 500 for which 2008 data was available in the Compustat database.26
EXHIBIT 5-18 Common-Size Balance Sheet Statistics for the S&P 500 Grouped by S&P/MSCI GICS Sector (in percent except No. of Observations; data for 2008)
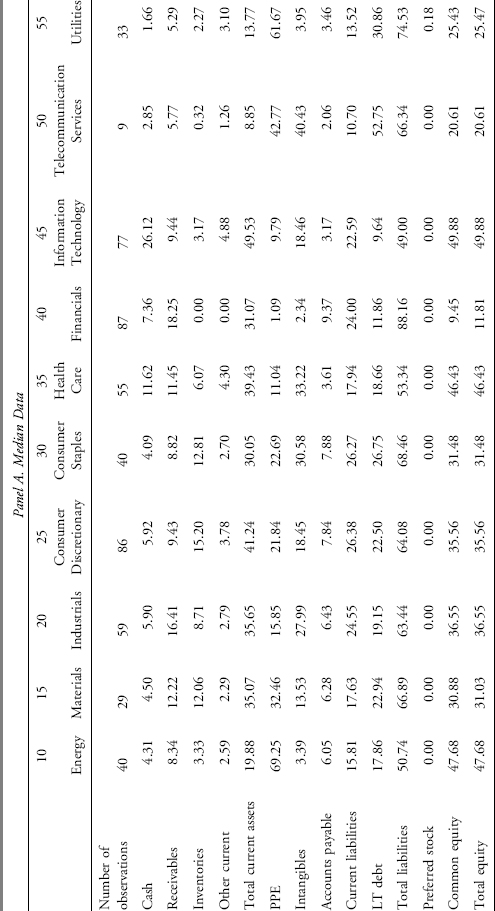
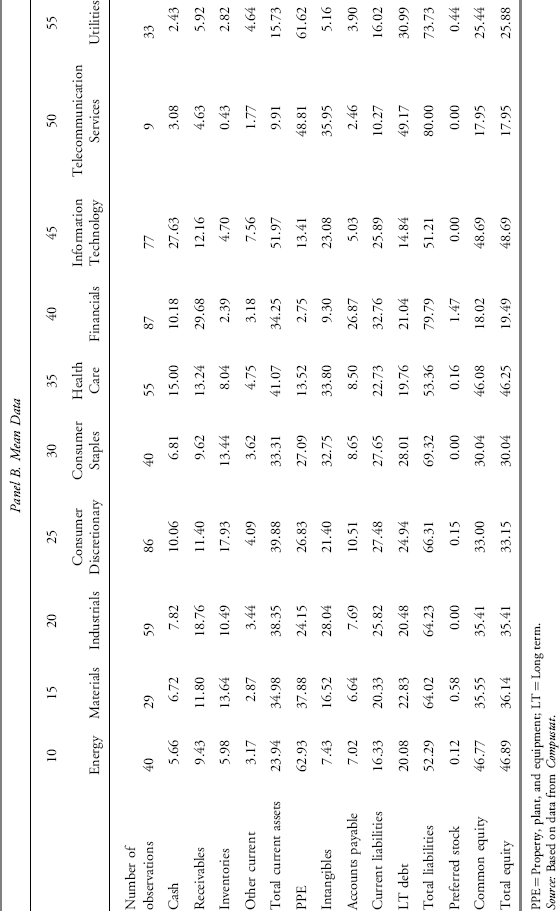
Some interesting general observations can be made from these data:
- Energy and utility companies have the largest amounts of property, plant, and equipment (PPE). Telecommunication services, followed by utilities, have the highest level of long-term debt. Utilities also use some preferred stock.
- Financial companies have the greatest percentage of total liabilities. Financial companies typically have relatively high financial leverage.
- Telecommunications services and utility companies have the lowest level of receivables.
- Inventory levels are highest for consumer discretionary. Materials and consumer staples have the next highest inventories.
- Information technology companies use the least amount of leverage as evidenced by the lowest percentages for long-term debt and total liabilities and highest percentages for common and total equity.
Example 5-7 discusses an analyst using cross-sectional common-size balance sheet data.
EXAMPLE 5-7 Cross-Sectional Common-Size Analysis
Jason Lu is examining three companies in the computer industry to evaluate their relative financial position as reflected on their balance sheet. He has compiled the following vertical common-size data for Apple, Dell, and Hewlett-Packard.
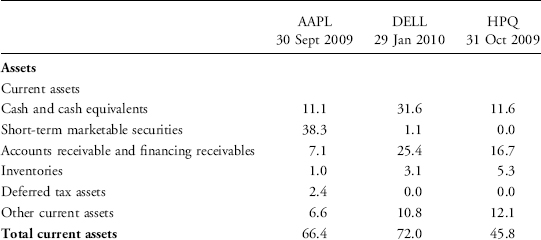
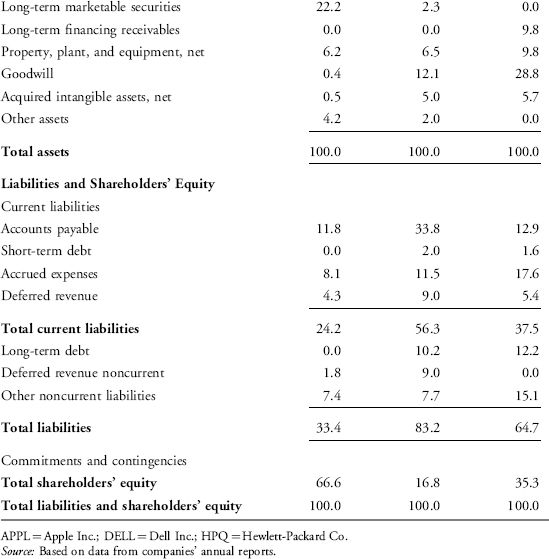
From this data, Lu learns the following:
- Apple and Dell have a high level of cash and short-term marketable securities, consistent with the information technology sector as reported in Exhibit 5-18. Hewlett-Packard’s percentage of cash and marketable securities is lower, perhaps reflecting its broader range of information technology products and services. Apple has a higher balance in cash and investments combined than Dell, Hewlett-Packard, or the industry sector as reported in Exhibit 5-18. This may reflect the success of the company’s business model, which has generated large operating cash flows in recent years.
- Apple has the lowest level of accounts receivable. Further research is necessary to learn the extent to which this is related to Apple’s cash sales through its own retail stores. An alternative explanation would be that the company has been selling/factoring receivables to a greater degree than the other companies; however, that explanation is unlikely given Apple’s cash position.
- Apple and Dell both have low levels of inventory compared to the industry sector as reported in Exhibit 5-18. Both utilize a just-in-time inventory system and rely on suppliers to hold inventory until needed. Additional scrutiny of the notes accompanying their annual reports reveals Apple regularly makes purchase commitments that are not currently recorded as inventory and uses contract manufacturers to assemble and test some finished products. All of the companies have some purchase commitments and make some use of contract manufacturers, which implies that inventory may be “understated.”
- Apple and Dell have a level of property, plant, and equipment below that of the sector, whereas Hewlett-Packard is very close to the sector median as reported in Exhibit 5-18.
- Hewlett-Packard has a large amount of goodwill from its steady stream of acquisitions over the last decade.
- Dell has a large amount of accounts payable. Because of Dell’s high level of cash and investments, this is likely not a problem for Dell.
- Consistent with the industry, Dell and Hewlett-Packard have very low levels of long-term debt. Apple has no long-term debt.
7.2. Balance Sheet Ratios
Ratios facilitate time-series and cross-sectional analysis of a company’s financial position. Balance sheet ratios are those involving balance sheet items only. Each of the line items on a vertical common-size balance sheet is a ratio in that it expresses a balance sheet amount in relation to total assets. Other balance sheet ratios compare one balance sheet item to another. For example, the current ratio expresses current assets in relation to current liabilities as an indicator of a company’s liquidity. Balance sheet ratios include liquidity ratios (measuring the company’s ability to meet its short-term obligations) and solvency ratios (measuring the company’s ability to meet long-term and other obligations). These ratios and others are discussed in a later chapter. Exhibit 5-19 summarizes the calculation and interpretation of selected balance sheet ratios.
EXHIBIT 5-19 Balance Sheet Ratios
| Calculation | Indicates | |
| Liquidity Ratios | ||
| Current | Current assets÷Current liabilities | Ability to meet current liabilities |
| Quick (acid test) | (Cash+Marketable securities+Receivables)÷Current liabilities | Ability to meet current liabilities |
| Cash | (Cash+Marketable securities)÷ Current liabilities | Ability to meet current liabilities |
| Solvency Ratios | ||
| Long-term debt to equity | Total long-term debt÷Total equity | Financial risk and financial leverage |
| Debt to equity | Total debt÷Total equity | Financial risk and financial leverage |
| Total debt | Total debt÷Total assets | Financial risk and financial leverage |
| Financial leverage | Total assets÷Total equity | Financial risk and financial leverage |
EXAMPLE 5-8 Ratio Analysis
For the following ratio questions, refer to the balance sheet information for the SAP Group presented in Exhibits 5-1, 5-4, 5-6, 5-8, and 5-12.
1. The current ratio for SAP Group at 31 December 2009 is closest to
A. 1.54.
B. 1.86.
C. 2.33.
2. Which two of the following ratios decreased in 2009 relative to 2008?
A. Cash.
B. Quick.
C. Current.
D. Debt to equity.
E. Financial leverage.
F. Long-term debt to equity.
3. For the ratios listed in question 2, how are the changes interpreted?
Solution to 1: A is correct. SAP Group’s current ratio (Current assets ÷ Current liabilities) at 31 December 2009 is 1.54 (€5,255 million ÷ €3,416 million).
Solution to 2: D and E are correct. The ratios are shown in the following table. The debt to equity and financial leverage ratios are lower in 2009 than in 2008. Bank loans (short-term debt) were reduced and equity increased. All other ratios are higher.
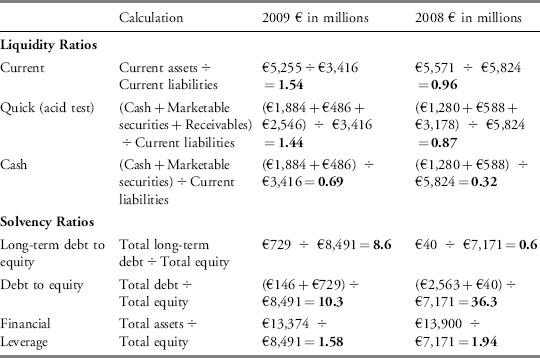
Solution to 3:
- The increase in each of the liquidity ratios (current, quick, and cash) in 2009 indicates that the company’s liquidity position strengthened. Compared with the end of 2008, the company reported a greater amount of current assets relative to current liabilities.
- The long-term debt to equity ratio indicates the amount of long-term debt capital relative to the amount of equity capital. In general, an increase in the long-term debt to equity ratio implies that a company’s solvency has weakened. In this case, however, several points should be noted. First, despite the increase, this company’s ratio remains very low, indicating its solvency position is strong. Second, securing long-term financing in 2009—when credit market disruptions had caused difficulty for some companies seeking to borrow—could be considered a very prudent action. Third, the company’s overall financial leverage decreased, i.e., improved.
- The debt to equity ratio indicates the amount of total debt capital relative to the amount of equity capital. Financial leverage indicates the amount of total asset relative to equity. A decrease in the debt-to-equity and financial leverage ratios implies that a company’s total leverage decreased and thus its solvency has improved. In this case, the company’s total leverage decreased largely because the company repaid most of its short-term bank loans and increased its equity in 2009.
Cross-sectional financial ratio analysis can be limited by differences in accounting methods. In addition, lack of homogeneity of a company’s operating activities can limit comparability. For diversified companies operating in different industries, using industry-specific ratios for different lines of business can provide better comparisons. Companies disclose information on operating segments. The financial position and performance of the operating segments can be compared to the relevant industry.
Ratio analysis requires a significant amount of judgment. One key area requiring judgment is understanding the limitations of any ratio. The current ratio, for example, is only a rough measure of liquidity at a specific point in time. The ratio captures only the amount of current assets, but the components of current assets differ significantly in their nearness to cash (e.g., marketable securities versus inventory). Another limitation of the current ratio is its sensitivity to end-of-period financing and operating decisions that can potentially impact current asset and current liability amounts. Another overall area requiring judgment is determining whether a ratio for a company is within a reasonable range for an industry. Yet another area requiring judgment is evaluating whether a ratio signifies a persistent condition or reflects only a temporary condition. Overall, evaluating specific ratios requires an examination of the entire operations of a company, its competitors, and the external economic and industry setting in which it is operating.
The balance sheet (also referred to as the statement of financial position) discloses what an entity owns (assets) and what it owes (liabilities) at a specific point in time. Equity is the owners’ residual interest in the assets of a company, net of its liabilities. The amount of equity is increased by income earned during the year, or by the issuance of new equity. The amount of equity is decreased by losses, by dividend payments, or by share repurchases.
An understanding of the balance sheet enables an analyst to evaluate the liquidity, solvency, and overall financial position of a company.
- The balance sheet distinguishes between current and noncurrent assets and between current and noncurrent liabilities unless a presentation based on liquidity provides more relevant and reliable information.
- The concept of liquidity relates to a company’s ability to pay for its near-term operating needs. With respect to a company overall, liquidity refers to the availability of cash to pay those near-term needs. With respect to a particular asset or liability, liquidity refers to its “nearness to cash.”
- Some assets and liabilities are measured on the basis of fair value and some are measured at historical cost. Notes to financial statements provide information that is helpful in assessing the comparability of measurement bases across companies.
- Assets expected to be liquidated or used up within one year or one operating cycle of the business, whichever is greater, are classified as current assets. Assets not expected to be liquidated or used up within one year or one operating cycle of the business, whichever is greater, are classified as noncurrent assets.
- Liabilities expected to be settled or paid within one year or one operating cycle of the business, whichever is greater, are classified as current liabilities. Liabilities not expected to be settled or paid within one year or one operating cycle of the business, whichever is greater, are classified as noncurrent liabilities.
- Trade receivables, also referred to as accounts receivable, are amounts owed to a company by its customers for products and services already delivered. Receivables are reported net of the allowance for doubtful accounts.
- Inventories are physical products that will eventually be sold to the company’s customers, either in their current form (finished goods) or as inputs into a process to manufacture a final product (raw materials and work-in-process). Inventories are reported at the lower of cost or net realizable value. If the net realizable value of a company’s inventory falls below its carrying amount, the company must write down the value of the inventory and record an expense.
- Inventory cost is based on specific identification or estimated using the first-in, first-out or weighted average cost methods. Some accounting standards (including U.S. GAAP but not IFRS) also allow last-in, first-out as an additional inventory valuation method.
- Accounts payable, also called trade payables, are amounts that a business owes its vendors for purchases of goods and services.
- Deferred revenue (also known as unearned revenue) arises when a company receives payment in advance of delivery of the goods and services associated with the payment received.
- Property, plant, and equipment (PPE) are tangible assets that are used in company operations and expected to be used over more than one fiscal period. Examples of tangible assets include land, buildings, equipment, machinery, furniture, and natural resources such as mineral and petroleum resources.
- IFRS provide companies with the choice to report PPE using either a historical cost model or a revaluation model. U.S. GAAP permit only the historical cost model for reporting PPE.
- Depreciation is the process of recognizing the cost of a long-lived asset over its useful life. (Land is not depreciated.)
- Under IFRS, property used to earn rental income or capital appreciation is considered to be investment property. IFRS provide companies with the choice to report investment property using either a historical cost model or a fair value model.
- Intangible assets refer to identifiable nonmonetary assets without physical substance. Examples include patents, licenses, and trademarks. For each intangible asset, a company assesses whether the useful life is finite or indefinite.
- An intangible asset with a finite useful life is amortized on a systematic basis over the best estimate of its useful life, with the amortization method and useful-life estimate reviewed at least annually. Impairment principles for an intangible asset with a finite useful life are the same as for PPE.
- An intangible asset with an indefinite useful life is not amortized. Instead, it is tested for impairment at least annually.
- For internally generated intangible assets, IFRS require that costs incurred during the research phase must be expensed. Costs incurred in the development stage can be capitalized as intangible assets if certain criteria are met, including technological feasibility, the ability to use or sell the resulting asset, and the ability to complete the project.
- The most common asset that is not a separately identifiable asset is goodwill, which arises in business combinations. Goodwill is not amortized; instead it istested for impairment at least annually.
- Financial instruments are contracts that give rise to both a financial asset of one entity and a financial liability or equity instrument of another entity. In general, there are two basic alternative ways that financial instruments are measured: fair value or amortized cost. For financial instruments measured at fair value, there are two basic alternatives in how net changes in fair value are recognized: as profit or loss on the income statement, or as other comprehensive income (loss) that bypasses the income statement.
- Typical long-term financial liabilities include loans (i.e., borrowings from banks) and notes or bonds payable (i.e., fixed-income securities issued to investors). Liabilities such as bonds issued by a company are usually reported at amortized cost on the balance sheet.
- Deferred tax liabilities arise from temporary timing differences between a company’s income as reported for tax purposes and income as reported for financial statement purposes.
- Six potential components that comprise the owners’ equity section of the balance sheet include: contributed capital, preferred shares, treasury shares, retained earnings, accumulated other comprehensive income, and noncontrolling interest.
- The statement of changes in equity reflects information about the increases or decreases in each component of a company’s equity over a period.
- Vertical common-size analysis of the balance sheet involves stating each balance sheet item as a percentage of total assets.
- Balance sheet ratios include liquidity ratios (measuring the company’s ability to meet its short-term obligations) and solvency ratios (measuring the company’s ability to meet long-term and other obligations).
1. Resources controlled by a company as a result of past events are:
A. equity.
B. assets.
C. liabilities.
2. Equity equals:
A. Assets − Liabilities.
B. Liabilities − Assets.
C. Assets+Liabilities.
3. Distinguishing between current and noncurrent items on the balance sheet and presenting a subtotal for current assets and liabilities is referred to as:
A. a classified balance sheet.
B. an unclassified balance sheet.
C. a liquidity-based balance sheet.
4. All of the following are current assets except:
A. cash.
B. goodwill.
C. inventories.
5. Debt due within one year is considered:
A. current.
B. preferred.
C. convertible.
6. Money received from customers for products to be delivered in the future is recorded as:
A. revenue and an asset.
B. an asset and a liability.
C. revenue and a liability.
7. The carrying value of inventories reflects:
A. their historical cost.
B. their current value.
C. the lower of historical cost or net realizable value.
8. When a company pays its rent in advance, its balance sheet will reflect a reduction in:
A. assets and liabilities.
B. assets and shareholders’ equity.
C. one category of assets and an increase in another.
9. Accrued expenses (accrued liabilities) are:
A. expenses that have been paid.
B. created when another liability is reduced.
C. expenses that have been reported on the income statement but not yet paid.
10. The initial measurement of goodwill is most likely affected by:
A. an acquisition’s purchase price.
B. the acquired company’s book value.
C. the fair value of the acquirer’s assets and liabilities.
11. Defining total asset turnover as revenue divided by average total assets, all else equal, impairment write-downs of long-lived assets owned by a company will most likely result in an increase for that company in:
A. the debt-to-equity ratio but not the total asset turnover.
B. the total asset turnover but not the debt-to-equity ratio.
C. both the debt-to-equity ratio and the total asset turnover.
12. For financial assets classified as trading securities, how are unrealized gains and losses reflected in shareholders’ equity?
A. They are not recognized
B. They flow through income into retained earnings
C. They are a component of accumulated other comprehensive income
13. For financial assets classified as available for sale, how are unrealized gains and losses reflected in shareholders’ equity?
A. They are not recognized
B. They flow through retained earnings
C. They are a component of accumulated other comprehensive income
14. For financial assets classified as held to maturity, how are unrealized gains and losses reflected in shareholders’ equity?
A. They are not recognized
B. They flow through retained earnings
C. They are a component of accumulated other comprehensive income
15. The noncontrolling (minority) interest in consolidated subsidiaries is presented on the balance sheet:
A. as a long-term liability.
B. separately, but as a part of shareholders’ equity.
C. as a mezzanine item between liabilities and shareholders’ equity.
16. The item “retained earnings” is a component of:
A. assets.
B. liabilities.
C. shareholders’ equity.
17. When a company buys shares of its own stock to be held in treasury, it records a reduction in:
A. both assets and liabilities.
B. both assets and shareholders’ equity.
C. assets and an increase in shareholders’ equity.
18. Which of the following would an analyst most likely be able to determine from a common-size analysis of a company’s balance sheet over several periods?
A. An increase or decrease in sales
B. An increase or decrease in financial leverage
C. A more efficient or less efficient use of assets
19. An investor concerned whether a company can meet its near-term obligations is most likely to calculate the:
A. current ratio.
B. return on total capital.
C. financial leverage ratio.
20. The most stringent test of a company’s liquidity is its:
A. cash ratio.
B. quick ratio.
C. current ratio.
21. An investor worried about a company’s long-term solvency would most likely examine its:
A. current ratio.
B. return on equity.
C. debt-to-equity ratio.
22. Using the information presented in Exhibit 5-4, the quick ratio for SAP Group at 31 December 2009 is closest to:
A. 1.01.
B. 1.44.
C. 1.54.
23. Using the information presented in Exhibit 5-12, the financial leverage ratio for SAP Group at 31 December 2009 is closest to:
A. 0.08.
B. 0.58.
C. 1.58.
1IFRS defines the term “fair value” as the amount for which an asset could be exchanged or a liability settled between knowledgeable, willing parties in an arm’s length transaction (IAS 39, Financial Instruments: Recognition and Measurement, paragraph 9). U.S. GAAP defines “fair value” as an exit price, i.e., the price that would be received to sell an asset or paid to transfer a liability in an orderly transaction between market participants at the measurement date (FASB ASC Glossary).
2IFRS uses the term “statement of financial position” (IAS 1 Presentation of Financial Statements), although U.S. GAAP uses the two terms interchangeably (ASC 210-10-05 [Balance Sheet-Overall-Overview and Background]).
3Framework for the Preparation and Presentation of Financial Statements, International Accounting Standards Committee, 1989, adopted by IASB 2001, paragraph 83.
4Examples of these are financial liabilities classified as held for trading in accordance with IAS 39.
5IAS 1, Presentation of Financial Statements, paragraph 69.
6Generally, three months or less.
7The joint IASB/FASB Fair Value project has expressed the intent to adopt an exit price definition of fair value.
8Cisco press release dated 7 August 2001 from www.cisco.com.
9U.S. Securities and Exchange Commission. (January 2003). Final rule: Conditions for use of non-GAAP financial measures (Releases 33-8176 and 34-47226, File S7-43-02).
10IAS 16, Property, Plant and Equipment, paragraphs 29-31.
11IAS 36, Impairment of Assets, paragraph 6. U.S. GAAP uses a different approach to impairment.
12IAS 40, Investment Property.
13IAS 40, Investment Property, paragraph 35.
14IAS 38, Intangible Assets, paragraph 8.
15IAS 38, Intangible Assets, paragraphs 51–67.
16IFRS 3 Business Combinations and FASB ASC 805 [Business Combinations].
17IAS 32, Financial Instruments: Presentation, paragraph 11.
18Both IFRS and U.S. GAAP are working on projects related to financial instruments; this chapter is current as of June 2010.
19IFRS 7 Financial Instruments: Disclosures, paragraph 8(h).
20IAS 12, Income Taxes, paragraph 5.
21IAS Framework, paragraph 49 (c) and FASB ASC 505-10-05-3 [Equity - Overview and Background].
22Comprehensive income is defined as “the change in equity [net assets] of a business enterprise during a period from transactions and other events and circumstances from nonowner sources. It includes all changes in equity during a period except those resulting from investments by owners and distributions to owners.” FASB ASC Section 220-10-05 [Comprehensive Income–Overall-Overview and Background]. There is no explicit definition of comprehensive income in IFRS; the implicit definition is similar to that above. IFRS defines income in the glossary as “increases in economic benefits during the accounting period in the form of inflows or enhancements of assets or decreases of liabilities that result in increases in equity, other than those relating to contributions from equity participants.”
23IAS 1, Presentation of Financial Statements, paragraph 106.
24FASB ASC 505-10-S99 [Equity—Overall—SEC materials] indicates that a company can present the analysis of changes in stockholders’ equity either in the notes or in a separate statement.
25Another type of common-size analysis, known as “horizontal common-size analysis,” states quantities in terms of a selected base-year value. Unless otherwise indicated, text references to “common-size analysis” refer to vertical analysis.
26An entry of zero for an item (e.g., current assets) was excluded from the data, except in the case of preferred stock. Note that most financial institutions did not provide current asset or current liability data, so these are reported as not available in the database.