
We will now discuss some of the most well-known tools and libraries in Java that are used in various NLP and text mining applications.
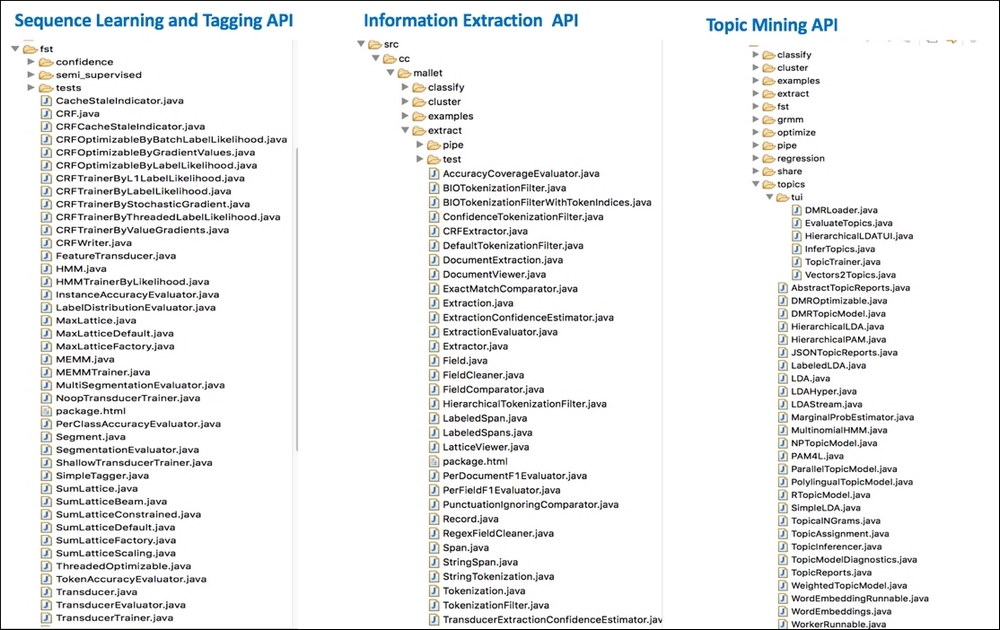
Mallet is a Machine Learning toolkit for text written in Java, which comes with several natural language processing libraries, including those some for document classification, sequence tagging, and topic modeling, as well as various Machine Learning algorithms. It is open source, released under CPL. Mallet exposes an extensive API (see the following screenshots) to create and configure sequences of "pipes" for pre-processing, vectorizing, feature selection, and so on, as well as to extend implementations of classification and clustering algorithms, plus a host of other text analytics and Machine Learning capabilities.

KNIME is an open platform for analytics with Open GL licensing with a number of powerful tools for conducting all aspects of data science. The Text Processing module is available for separate download from KNIME Labs. KNIME has an intuitive drag and drop UI with downloadable examples available from their workflow server.
The platform includes a Node repository that contains all the necessary tools to compose your workflow with a convenient nesting of nodes that can easily be reused by copying and pasting. The execution of the workflows is simple. Debugging errors can take some getting used to, so our recommendation is to take the text mining example, use a different dataset as input, and make the workflow execute without errors. This is the quickest way to get familiar with the platform.
We will now illustrate the usage of API and Java code to implement Topic Modeling to give the user an illustration on how to build a text learning pipeline for a problem in Java:
//create pipeline
ArrayList<Pipe> pipeList = new ArrayList<Pipe>();
  // Pipes: lowercase, tokenize, remove stopwords, map to features
pipeList.add( new CharSequenceLowercase() );
pipeList.add( new CharSequence2TokenSequence(Pattern.compile("\p{L}[\p{L}\p{P}]+\p{L}")) );
pipeList.add( new TokenSequenceRemoveStopwords(new File("stopReuters/en.txt"), "UTF-8", false, false, false) );
//add all
pipeList.add( new TokenSequence2FeatureSequence() );
InstanceList instances = new InstanceList (new SerialPipes(pipeList));
//read the file
Reader fileReader = new InputStreamReader(new FileInputStream(new File(reutersFile)), "UTF-8");
instances.addThruPipe(new CsvIterator (fileReader, Pattern.compile("^(\S*)[\s,]*(\S*)[\s,]*(.*)$"),
3, 2, 1)); // name fields, data, label
ParallelTopicModel in Mallet has an API with parameters such as the number of topics, alpha, and beta that control the underlying parameter for tuning the LDA using Dirichlet distribution. Parallelization is very well supported, as seen by the increased number of threads available in the system:
ParallelTopicModel model = new ParallelTopicModel(10, 1.0, 0.01);//10 topics using LDA method
model.addInstances(instances);//add instances
model.setNumThreads(3);//parallelize with threading
model.setNumIterations(1000);//gibbs sampling iterations
model.estimate();//perform estimation of probability
Topic and term association is shown in the following screenshot as the result of running the ParallelTopicModel in Mallet. Clearly, the top terms and association of the topics are very well discovered in many cases, such as the classes of exec, acq, wheat, crude, corn, and earning:

The Reuters corpus labels each document with one of 10 categories. The aim of the experiments in this case study is to employ the techniques of text processing learned in this chapter to give structure to these documents using vector space modeling. This is done in three different ways, and four classification algorithms are used to train and make predictions using the transformed dataset in each of the three cases. The open source Java analytics platform KNIME was used for text processing and learning.
Among the learning techniques for unstructured data, such as text or images, classification of the data into different categories given a training set with labels is a supervised learning problem. However, since the data is unstructured, some statistical or information theoretic means are necessary to extract learnable features from the data. In the design of this study, we performed feature representation and selection on the documents before using linear, non-linear, and ensemble methods for classification.
The dataset used in the experiments is a version of the Reuters-21578 Distribution 1.0 Text Categorization Dataset available from the UCI Machine Learning Repository:
Note
Reuters-21578 dataset: https://archive.ics.uci.edu/ml/datasets/Reuters-21578+Text+Categorization+Collection
This dataset is a Modified-Apte split containing 9,981 documents, each with a class label indicating the category of the document. There are 10 distinct categories in the dataset.
After importing the data file, we performed a series of pre-processing steps in order to enrich and transform the data before training any models on the documents. These steps can be seen in the screenshot of the workflow created in KNIME. They include:
- Punctuation erasure
- N char filtering (removes tokens less than four characters in length)
- Number filtering
- Case conversion – convert all to lower case
- Stop word filtering
- Stemming
Prior to the learning step, we sampled the data randomly into a 70-30 split for training and testing, respectively. We used five-fold cross-validation in each experiment.

The preceding screenshot shows the workflow for the first experiment set, which uses a binary vector of features. Data import is followed by a series of pre processing nodes, after which the dataset is transformed into a document vector. After adding back the target vector, the workflow branches out into four classification tasks, each using a five-fold cross-validation setup. Results are gathered in the Scorer node.
We conducted three sets of experiments in total. In the first set, after pre processing, we used binary vectorization of the terms, which adds a representation indicating whether or not a term appeared in the document:

In the second experiment, we used the values for relative Term Frequency (TF) for each term, resulting in a value between 0 and 1.

In the third, we performed feature selection by filtering out terms that had a relative TF score of less than 0.01.
For each of the three sets of experiments, we used two linear classifiers (naïve Bayes and SVM using linear kernel) and two non-linear classifiers (Decision Tree and AdaBoost with Naïve Bayes as base learner). In text mining classification, precision/recall metrics are generally chosen as the evaluation metric over accuracy, which is more common in traditional, balanced classification problems.
The results from the three sets of experiments are given in the tables. Scores are averages over all the classes:
Binary Term Vector:
|
Classifier |
Recall |
Precision |
Sensitivity |
Specificity |
F-measure |
Accuracy |
Cohen's kappa |
|---|---|---|---|---|---|---|---|
|
Naïve Bayes |
0.5079 |
0.5281 |
0.5079 |
0.9634 |
0.5087 |
0.7063 |
0.6122 |
|
Decision Tree |
0.4989 |
0.5042 |
0.4989 |
0.9518 |
0.5013 |
0.7427(2) |
0.6637(2) |
|
AdaBoost(NB) |
0.5118(2) |
0.5444(2) |
0.5118(2) |
0.9665(2) |
0.5219(2) |
0.7285 |
0.6425 |
|
LibSVM |
0.6032(1) |
0.5633(1) |
0.6032(1) |
0.9808(1) |
0.5768(1) |
0.8290(1) |
0.7766(1) |
Relative TF vector:
|
Classifier |
Recall |
Precision |
Sensitivity |
Specificity |
F-measure |
Accuracy |
Cohen's kappa |
|---|---|---|---|---|---|---|---|
|
Naïve Bayes |
0.4853 |
0.5480(2) |
0.4853 |
0.9641 |
0.5113(2) |
0.7248 |
0.6292 |
|
Decision Tree |
0.4947(2) |
0.4954 |
0.4947(2) |
0.9703(2) |
0.4950 |
0.7403(2) |
0.6612(2) |
|
AdaBoost(NB) |
0.4668 |
0.5326 |
0.4668 |
0.9669 |
0.4842 |
0.6963 |
0.6125 |
|
LibSVM |
0.6559(1) |
0.6651(1) |
0.6559(1) |
0.9824(1) |
0.6224(1) |
0.8433(1) |
0.7962(1) |
Relative TF vector with threshold filtering (rel TF > 0.01):
|
Classifier |
Recall |
Precision |
Sensitivity |
Specificity |
F-measure |
Accuracy |
Cohen's kappa |
|---|---|---|---|---|---|---|---|
|
Naïve Bayes |
0.4689 |
0.5456(2) |
0.4689 |
0.9622 |
0.4988 |
0.7133 |
0.6117 |
|
Decision Tree |
0.5008(2) |
0.5042 |
0.5008(2) |
0.9706(2) |
0.5022(2) |
0.7439(2) |
0.6657(2) |
|
AdaBoost(NB) |
0.4435 |
0.4992 |
0.4435 |
0.9617 |
0.4598 |
0.6870 |
0.5874 |
|
LibSVM |
0.6438(1) |
0.6326(1) |
0.6438(1) |
0.9810(1) |
0.6118(1) |
0.8313(1) |
0.7806(1) |
The analysis of results obtained from our experiments on the Reuters dataset is presented here with some key observations:
- As seen in the first table, with the binary representation of terms, Naïve Bayes scores around 0.7, which indicates that the features generated have good discriminating power. AdaBoost on the same configuration of Naïve Bayes further improves all the metrics, such as precision, recall, F1-measure, and accuracy, by about 2%, indicating the advantage of boosting and meta-learning.
- As seen in the first table, non-linear classifiers, such as Decision Tree, do only marginally better than linear Naïve Bayes in most metrics. SVM with a linear classifier increases accuracy by 17% over linear Naïve Bayes and has better metrics similarly in almost all measures. SVM and kernels, which have no issues with higher dimensional data, the curse of text classification, are thus one of the better algorithms for modeling, and the results confirm this.
- Changing the representation from binary to TF improves many measures, such as accuracy, for linear Naïve Bayes (from 0.70 to 0.72) and SVM (0.82 to 0.84). This indeed confirms that TF-based representation in many numeric-based algorithms, such as SVM. AdaBoost performance with Naïve Bayes drops in most metrics when the underlying classifier Bayes gets stronger in performance, as shown in many theoretical and empirical results.
- Finally, by reducing features using threshold TF > 0.01, as used here, we get almost similar or somewhat reduced performance in most classifiers, indicating that although certain terms seem rare, they have discriminating power, and reducing them has a negative impact.