 Creating scatter charts
by Krishna Choppella, Dr. Uday Kamath, Boštjan Kaluža, Jennifer L. Reese, Richard M
Machine Learning: End-to-End guide for Java developers
Creating scatter charts
by Krishna Choppella, Dr. Uday Kamath, Boštjan Kaluža, Jennifer L. Reese, Richard M
Machine Learning: End-to-End guide for Java developers
- Machine Learning: End-to-End guide for Java developers
- Table of Contents
- Machine Learning: End-to-End guide for Java developers
- Credits
- Preface
- 1. Module 1
- 1. Getting Started with Data Science
- Problems solved using data science
- Understanding the data science problem - solving approach
- Acquiring data for an application
- The importance and process of cleaning data
- Visualizing data to enhance understanding
- The use of statistical methods in data science
- Machine learning applied to data science
- Using neural networks in data science
- Deep learning approaches
- Performing text analysis
- Visual and audio analysis
- Improving application performance using parallel techniques
- Assembling the pieces
- Summary
- 2. Data Acquisition
- 3. Data Cleaning
- 4. Data Visualization
- 5. Statistical Data Analysis Techniques
- 6. Machine Learning
- 7. Neural Networks
- 8. Deep Learning
- 9. Text Analysis
- 10. Visual and Audio Analysis
- 11. Mathematical and Parallel Techniques for Data Analysis
- 12. Bringing It All Together
- 1. Getting Started with Data Science
- 2. Module 2
- 1. Applied Machine Learning Quick Start
- 2. Java Libraries and Platforms for Machine Learning
- 3. Basic Algorithms – Classification, Regression, and Clustering
- 4. Customer Relationship Prediction with Ensembles
- 5. Affinity Analysis
- 6. Recommendation Engine with Apache Mahout
- 7. Fraud and Anomaly Detection
- 8. Image Recognition with Deeplearning4j
- 9. Activity Recognition with Mobile Phone Sensors
- 10. Text Mining with Mallet – Topic Modeling and Spam Detection
- 11. What is Next?
- A. References
- 3. Module 3
- 1. Machine Learning Review
- Machine learning – history and definition
- What is not machine learning?
- Machine learning – concepts and terminology
- Machine learning – types and subtypes
- Datasets used in machine learning
- Machine learning applications
- Practical issues in machine learning
- Machine learning – roles and process
- Machine learning – tools and datasets
- Summary
- 2. Practical Approach to Real-World Supervised Learning
- Formal description and notation
- Data transformation and preprocessing
- Feature relevance analysis and dimensionality reduction
- Model building
- Model assessment, evaluation, and comparisons
- Case Study – Horse Colic Classification
- Summary
- References
- 3. Unsupervised Machine Learning Techniques
- Issues in common with supervised learning
- Issues specific to unsupervised learning
- Feature analysis and dimensionality reduction
- Clustering
- Outlier or anomaly detection
- Real-world case study
- Summary
- References
- 4. Semi-Supervised and Active Learning
- Semi-supervised learning
- Active learning
- Case study in active learning
- Summary
- References
- 5. Real-Time Stream Machine Learning
- Assumptions and mathematical notations
- Basic stream processing and computational techniques
- Concept drift and drift detection
- Incremental supervised learning
- Incremental unsupervised learning using clustering
- Modeling techniques
- Partition based
- Hierarchical based and micro clustering
- Density based
- Grid based
- Validation and evaluation techniques
- Key issues in stream cluster evaluation
- Evaluation measures
- Cluster Mapping Measures (CMM)
- V-Measure
- Other external measures
- Unsupervised learning using outlier detection
- Case study in stream learning
- Summary
- References
- 6. Probabilistic Graph Modeling
- Probability revisited
- Graph concepts
- Bayesian networks
- Representation
- Inference
- Learning
- Learning parameters
- Learning structures
- Measures to evaluate structures
- Methods for learning structures
- Constraint-based techniques
- Search and score-based techniques
- 7. Deep Learning
- Multi-layer feed-forward neural network
- Inputs, neurons, activation function, and mathematical notation
- Multi-layered neural network
- Structure and mathematical notations
- Activation functions in NN
- Training neural network
- Empirical risk minimization
- Parameter initialization
- Loss function
- Gradients
- Feed forward and backpropagation
- How does it work?
- Regularization
- L2 regularization
- L1 regularization
- Limitations of neural networks
- Deep learning
- Building blocks for deep learning
- Rectified linear activation function
- Restricted Boltzmann Machines
- Autoencoders
- Unsupervised pre-training and supervised fine-tuning
- Deep feed-forward NN
- Deep Autoencoders
- Deep Belief Networks
- Deep learning with dropouts
- Sparse coding
- Convolutional Neural Network
- CNN Layers
- Recurrent Neural Networks
- Building blocks for deep learning
- Case study
- Summary
- References
- 8. Text Mining and Natural Language Processing
- NLP, subfields, and tasks
- Text categorization
- Part-of-speech tagging (POS tagging)
- Text clustering
- Information extraction and named entity recognition
- Sentiment analysis and opinion mining
- Coreference resolution
- Word sense disambiguation
- Machine translation
- Semantic reasoning and inferencing
- Text summarization
- Automating question and answers
- Issues with mining unstructured data
- Text processing components and transformations
- Topics in text mining
- Tools and usage
- Summary
- References
- NLP, subfields, and tasks
- 9. Big Data Machine Learning – The Final Frontier
- What are the characteristics of Big Data?
- Big Data Machine Learning
- Batch Big Data Machine Learning
- Case study
- Business problem
- Machine Learning mapping
- Data collection
- Data sampling and transformation
- Spark MLlib as Big Data Machine Learning platform
- A. Linear Algebra
- B. Probability
- D. Bibliography
- Index
- Empirical risk minimization
- Multi-layer feed-forward neural network
- Modeling techniques
- 1. Machine Learning Review
Scatter charts also use the XYChart.Series class in JavaFX. For this example, we will use a set of European data that includes the previous Europeans countries and their population data for the decades 1500 through 2000. This information is stored in a file called EuropeanScatterData.csv. The first part of this file is shown here:
1500 1400000
1600 1600000
1650 1500000
1700 2000000
1750 2250000
1800 3250000
1820 3434000
1830 3750000
1840 4080000
...
We start with the declaration of the JavaFX MainApp class, as shown next. The main method launches the application and the start method creates the user interface:
public class MainApp extends Application {
    @Override
    public void start(Stage stage) throws Exception {
        ...
    }

    public static void main(String[] args) {
        launch(args);
    }
}
Within the start method we set the title, create the axes, and create an instance of the ScatterChart that represents the scatter plot. The NumberAxis class's constructors used values that better match the data range than the default values used by its default constructor:
stage.setTitle("Scatter Chart Sample");
final NumberAxis yAxis = new NumberAxis(1400, 2100, 100);
final NumberAxis xAxis = new NumberAxis(500000, 90000000,
    1000000);
final ScatterChart<Number, Number> scatterChart = new
    ScatterChart<>(xAxis, yAxis);
Next, the axes' labels are set along with the scatter chart's title:
xAxis.setLabel("Population");
yAxis.setLabel("Decade");
scatterChart.setTitle("Population Scatter Graph");
An instance of the XYChart.Series class is created and named:
XYChart.Series series = new XYChart.Series();
The series is populated using a CSVReader class instance and the file EuropeanScatterData.csv. This process was discussed in Chapter 3, Data Cleaning:
try (CSVReader dataReader = new CSVReader(new FileReader("EuropeanScatterData.csv"), ',')) {
    String[] nextLine;
    while ((nextLine = dataReader.readNext()) != null) {
            int decade = Integer.parseInt(nextLine[0]);
            int population = Integer.parseInt(nextLine[1]);
            series.getData().add(new XYChart.Data(
                population, decade));
            out.println("Decade: " + decade +
                "  Population: " + population);
    }
}
scatterChart.getData().addAll(series);
The JavaFX scene and stage are created, and then the plot is displayed:
Scene scene = new Scene(scatterChart, 500, 400);
stage.setScene(scene);
stage.show();
When the application is executed, the following graph is displayed:
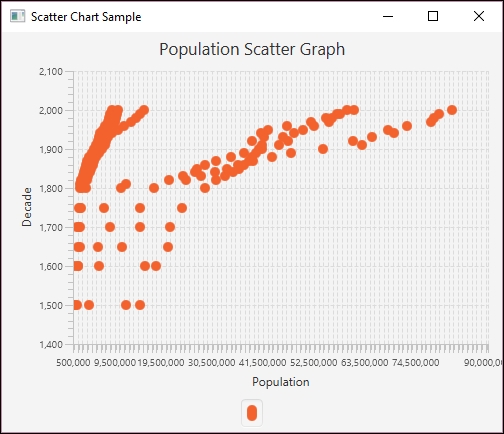
-
No Comment