
The Selection Pane and the Spotlight property for visuals are both closely related features to Bookmarks. For example, with the Selection Pane exposed via the View tab of the Report view, certain textboxes on a report page can be hidden while a specific text box associated with a bookmark is left visible.
In the following example, three textboxes have been created for the Europe report page, but only one of the three textboxes is visible for each of the three Europe Bookmarks:
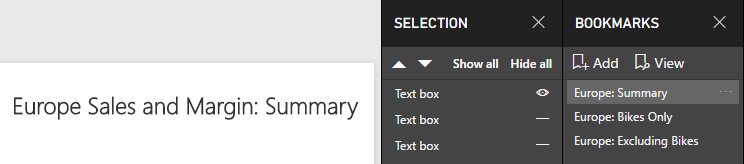
The icons next to the objects can be toggled between visible (eye symbol) and hidden (dash symbol). In the preceding example, only the text box containing the title Europe Sales and Margin: Summary is visible for the Europe: Summary bookmark. The other two textboxes on the Europe report page contain a title corresponding to the other two Europe Bookmarks (Europe: Bikes Only, Europe: Excluding Bikes). Like the Europe: Summary bookmark, only the text box containing the title associated with the given bookmark is visible for these two other Bookmarks.
The Spotlight property, accessed via the ellipsis in the top-right corner of each visual, draws attention to the specific visual by making all other visuals on the report page fade into the background.
As an alternative to Spotlight, Focus mode can also be saved as a bookmark. Focus mode can be applied via the diagonal arrow icon in the top right corner of chart visuals and fills the entire report canvas with the single visual.
In the following example, the Spotlight property has been enabled for a scatter chart on the Europe report page:
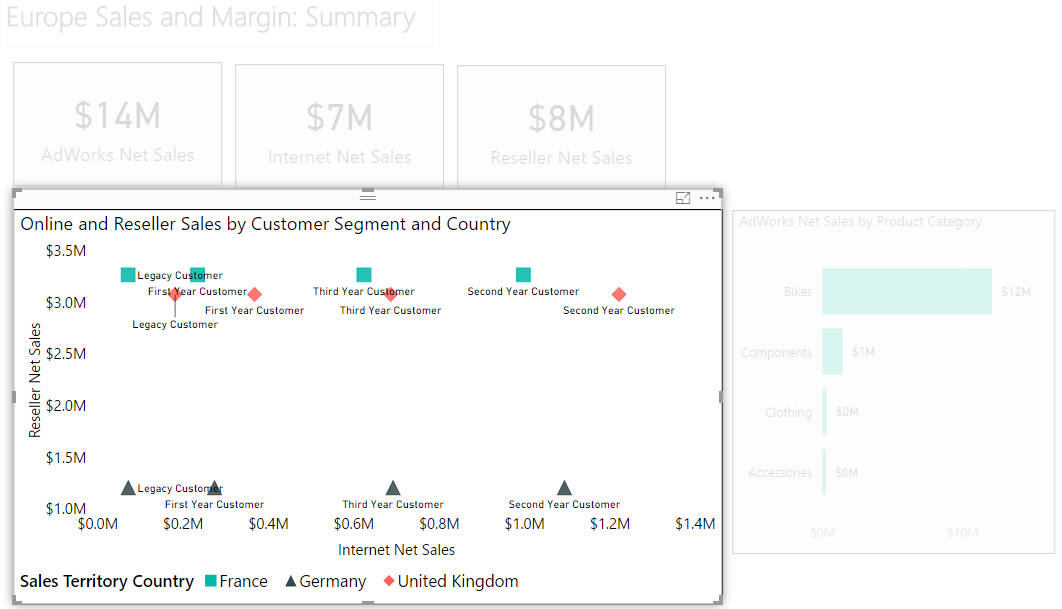
In the preceding report page, four other visuals (three cards and a bar chart) are still visible, but the scatter chart is emphasized via the Spotlight property. With Spotlight enabled, the report author could add a bookmark with an intuitive name (for example, Europe Summary: Customer Segment and Country Scatter) to save this specific view. Referencing this bookmark in a meeting or presentation makes it easier to explain the meaning and insights of the scatter chart.