
MODULE 6
IT Risk Assessment
Recall from Module 5 that risk is a combination of several elements: assets, vulnerabilities, threats, threat agents, likelihood, and impact. Although Module 5 discussed these elements in depth, you have not yet learned how to assess risk, and that’s the focus of this module. We will look at different methods for evaluating and assessing risk. We will look at calculating likelihood and impact factors, as well as how to frame risk response in light of our risk assessments.
Assessing Risk
Risk assessment is the process of evaluating likelihood and impact factors in conjunction with the risk elements previously discussed, such as threat, vulnerability, and assets. The purpose of assessing risk is to determine, as definitively and realistically as possible, what the potential for risk is, given a risk scenario (threat and vulnerability) and an asset. In the next few sections, we’re going to discuss the different risk factors that can interact with these elements and contribute to risk, as well as the different methods for evaluating and assessing risk.
Risk Factors
Risk factors are the different items that can contribute to risk. Note that risk factors are not the same as the elements of risk we discussed previously, such as the threat agent (also called threat actor or threat source), threat (or threat event), vulnerability, asset, likelihood, and impact. Risk factors are conditions that could influence the likelihood of a threat occurring or the impact to an asset if a threat does occur. Even given identical threats, vulnerabilities, and assets, two organizations may operate under different conditions that may drastically alter the likelihood and impact of risk. These conditions are the risk factors, which could be based upon the internal or external environments within which the organization or asset operates. Risk factors are not necessarily quantifiable conditions; you must simply be aware of them and how they could influence risk, and adjust your risk response accordingly. We’ll discuss external and internal environmental risk factors next.
External Risk Factors
External risk factors occur outside the business’s organizational structure and influence. External factors are not easily controlled, or not controllable at all, by the organization; most simply react to external risk factors and adjust their risk management strategies to account for various conditions. Examples of external risk factors include market changes, the economy, dollar valuation, changing legal governance, severe weather conditions, and political events. For example, a new government regulation requiring tighter restrictions on data access is a risk factor that an organization cannot control. It can only react to the new governance by complying with it. The regulation is considered a risk factor because it could lessen risk in some areas (such as risk to unauthorized data disclosure or the prevention of data breaches), or it could increase risk in other areas (noncompliance with the law, or the risk required to transform organizational processes, for instance). Although external risk factors aren’t controllable, they are sometimes predictable, and they should be considered when the organization is formulating its assessment of and response to risk.
Internal Risk Factors
Internal risk factors, which occur within the organization’s internal structures and boundaries, can be controlled to a large degree by the organization. Examples of internal risk factors include organizational structure, internal policies, resource allocation, dedicated personnel and equipment, and prioritization of effort. These risk factors are controllable, because the organization can, at any time, change them to some degree. For instance, if data is at risk because insufficient protective controls have been applied to it, the organization can allocate more money to purchase more protections or dedicate other resources to the protection of the data. It can also take measures to increase protection and reduce access to the data through policy and other internal controls. An organization can also restructure and reorganize any time it chooses. Internal risk factors can also be difficult to quantify, but they must be considered when you are evaluating risk.
![]()
You should understand the difference between internal and external risk factors and the role they play in influencing overall risk to the organization. Risk factors can influence the likelihood and impact of a risk scenario.
You must know some particular risk factors for the exam. They relate to system and data availability and include measurements of failure and repair time for system components. All of the following hardware component measurements are included in the Security+ exam objectives; however, there are many other risk factors that you should consider with systems hardware in particular, and with other assets in general.
One such factor is the mean time between failures (MTBF). This factor, which typically applies to hardware components, represents the manufacturer’s best guess (based on historical data) regarding how much time will pass between major failures of that component. This is, of course, assuming that more than one failure will occur, which means that the component will be repaired, rather than replaced. Organizations should take this risk factor into account, because it may affect likelihood and impact of the risks associated with critical systems.
Related to MTBF is the mean time to failure (MTTF), which indicates the length of time a device is expected to last in operation. In MTTF, only a single, definitive failure will occur and will require that the device be replaced rather than repaired.
Lastly, the mean time to recovery (MTTR) is the amount of time it takes for a hardware component to recover from failure.
![]()
You should understand the difference between mean time between failures (MTBF), mean time to failure (MTTF), and mean time to recovery (MTTR) measurements for hardware failure.
Risk Assessment Methods
In addition to hiring knowledgeable and experienced risk management personnel, organizations can also implement and follow a formalized process or methodology in assessing risk. Developing this process can be quite an undertaking, but, fortunately, organizations can use existing methods that have been created by experts in the risk management profession. One such common method of conducting risk assessments is the National Institute of Standards and Technology (NIST) Special Publication 800-30, “Guide for Conducting Risk Assessments.” Another assessment methodology comes from ISACA, a professional association devoted to risk management, auditing, and security controls management. This methodology is “The Risk IT Framework.” Both of these methodologies describe detailed processes for conducting risk assessments, and both can be adapted for any organization to use.
The NIST SP 800-30 prescribes a four-step risk assessment process:
1. Prepare for assessment.
2. Conduct assessment:
a. Identify threat sources and events.
b. Identify vulnerabilities and predisposing conditions.
c. Determine likelihood of occurrence.
d. Determine magnitude of impact.
e. Determine risk.
3. Communicate results.
4. Maintain assessment.
This process follows what we’ve described in previous modules as well as in this module: First we must identify threat agents (sources) and threat events, and then we must identify vulnerabilities associated with assets and other risk factors. We then calculate likelihood and impact values, which give us our risk. Communicating the risk assessment results means that we must report our assessment to management, so that risk response options can be carefully considered. Maintaining the assessment means that we implement the response options and closely monitor the risk, periodically assessing it again to ensure that our response options are effective and to determine whether the risk has changed.
![]()
Although you likely will not be tested on either the NIST or ISACA methodologies, they’re good to know for use on the job, especially if you are assigned any type of risk assessment duties for your organization.
Once you have collected all the different data on threats, vulnerabilities, and assets, you can assess likelihood and impact. Remember that likelihood could be viewed as the likelihood that a threat actor will initiate a threat or the likelihood that a threat could successfully exploit a given vulnerability. Impact is the degree of harm or damage caused to an asset or the organization. Both can actually be viewed in either subjective or objective terms. In a subjective expression, both elements may be termed qualitatively, or using a range of descriptions on a scale. Objectively, impact or likelihood could be expressed in terms of numerical values. These two ways of expressing likelihood and impact are actually the two risk assessment methods that we will discuss in the upcoming sections: qualitative (subjective) and quantitative (objective or numerical) assessment methods.
Quantitative Assessment
A quantitative risk assessment is based on objective data—typically, numerical data. A quantitative assessment is objective in that the data fed into it is measurable and independently verifiable. For example, cost expressed as a dollar value is a measurable and concrete piece of data often used to perform quantitative analysis. Other types of numerical data may include statistical analysis of different aspects of likelihood, for instance.
Quantitative risk assessments are used when an organization requires exact figures on risk that can be equated to likelihood and impact. Exact dollar values, for instance, can be used to describe impact or loss of an asset. Quantitative risk assessments require that the organization actually measure and obtain certain pieces of data, because the assessment depends upon the accuracy and completeness of the data fed into it. In the next few sections, we’ll look at some of the different data elements that are necessary to perform a quantitative assessment. Note that these are very simplistic data elements; in more complex assessments, other data elements might be required as well.
Asset Value and Exposure Factor
The asset’s value is the first data on which to perform a quantitative analysis. This may seem to be the easiest piece of data to obtain, since it could be as simple as determining an asset’s replacement cost. However, some organizations may need to consider depreciation values over time, which would reduce the amount of money they may have available to replace an asset. Another consideration is repair cost versus replacement cost. If an asset simply needs to be repaired to be brought back to an operational condition, then different costs for different components required to repair the asset may have to be considered. This is where the system or component failure measurements we discussed earlier in the module come into play.
Beyond cost to replace or repair the asset, you must also look at the revenue the asset generates. For example, let’s say that you have determined that the replacement cost of a server is $5000. And the amount of revenue that the server brings in every day, due to the data that’s processed on it, is $3000. So even if you pay the $5000 to order a new server, if the vendor can’t get it to you and installed within four days, you’ve actually lost $12,000 in revenue in addition to the cost of the server. Those considerations may require you to reevaluate the value of the asset. Remember that it’s not only about the cost of replacement for the asset itself, but also how much value it gives to the organization.
![]()
When valuing an asset, consider not only the replacement cost, but also the revenue the asset generates, as this will be lost as well if the asset is not available.
Another factor you should consider with asset valuation is the exposure factor, the percentage of an asset that could be lost during a negative event. Realistically, you will not always lose 100 percent of the asset; you may lose only 30 percent or 50 percent, for example. Exposure factor takes into account the percentage of the asset (or the revenue derived from the asset) lost in the event of an incident. Exposure factors are useful when performing risk assessments, because they may be able to determine realistically how much of a loss your organization may suffer during an incident, which affects how much money or other resources you should devote to budgeting for risk response. Exposure factors are normally expressed mathematically as a decimal number. An exposure factor of 0.4, for example is a 40 percent loss, and an exposure factor of 1 is a 100 percent loss.
Single Loss Expectancy
The single loss expectancy (SLE) is a value that’s computed simply by multiplying the asset’s value (in dollars) by the exposure factor (percentage of loss). This is a simple formula, which is the initial step in describing risk from a quantitative point of view. This value indicates what the loss would be in a single circumstance of a negative incident affecting the asset. The formula can also be described as follows:
SLE (single loss expectancy) = AV (asset value) × EF (exposure factor)
So, given this formula, suppose you had an asset worth $5000, and during a single loss event such as a fire, you’d expect to lose 50 percent of that asset. This would be expressed as
SLE = $5000 (AV) × 0.50 (EF) = $2500.
Obviously, this is a very simple scenario. When calculating SLE, you have to look at other aspects of the loss, such as the event that might cause the loss, its likelihood, revenue generated from the asset, and so on. Additionally, exposure factor can be a difficult value to nail down as well. You might use statistical analysis, or even the “best guess” by a committee of experts, to determine exposure factor for different assets.
![]()
Know the formula for single loss expectancy:
SLE = AV (asset value) × EF (exposure factor)
Annualized Rate of Occurrence
The annualized rate of occurrence (ARO) is how many times per year you would expect a particular negative event to occur, resulting in a loss of the asset. This value relates more to likelihood than impact and serves to establish a baseline of how likely a specific threat is to occur, affecting the asset.
This value can result from several different sources. First, you could look at historical trends. For example, let’s say that your business is located in an area prone to tornadoes. You can gather information from the National Weather Service on how many tornadoes normally occur in your region every year. This would be the ARO for that threat. Obviously, other events would have other rates of occurrence. Some of these would be difficult to quantify without more in-depth information. For instance, obtaining the ARO for attacks from hackers would be problematic, since that would not necessarily be limited to a geographical area. You might have to gather data and perform statistical analysis to determine how often serious attacks occur, given specific circumstances, attack methods, level of attack, and so on, with regard to your type of industry or business. Some of this data might come from published industry trends, and some information may come from law enforcement or intelligence sources that provide aggregate analysis of this particular type of data. In the end, this might simply be an educated guess, based upon the best data you have available to you. In any case, what you’re after is an end number that you can use as a factor in determining how often a particular threat might occur on an annual basis. You’ll use this number during the next calculation, which is annualized loss expectancy (ALE).
Annualized Loss Expectancy
The ALE essentially looks at the amount of loss from the SLE and determines how much loss the organization could realistically expect in a one-year period. Viewing potential loss on an annual basis makes it easier to craft budgets and allocate resources toward risk management, since most organizations function on a fiscal-year basis. Additionally, this allows the organization to project how many times in a given year a particular event may occur. The formula for ALE is also quite simple:
ALE (annualized loss expectancy) = SLE × ARO
For example, if you do happen to have a business in an area that is prone to tornadoes, let’s say that, on average, your area gets about seven major tornadoes per year. So the ARO is 7. Let’s also say that, given historical trends, physical structure, exact geographical location, and other factors, there’s a possibility that your $2 million data center would suffer about a 20 percent loss if a serious tornado hit it. So the SLE would be $400,000 (if AV is $2,000,000 and the EF is 0.20). Although it may not be a very likely scenario, if all seven major tornadoes that occurred during the year actually hit and caused this level of damage to your facility, then the ALE would be $400,000 (SLE) × 7 (ARO) = a potential loss of $2,800,000 (ALE). Realistically, since all seven are not likely to hit your facility, you may be able to lower your ARO to a lesser number. This would be the worst-case scenario.
Obviously, this is a very simplistic (and most likely remote) scenario; the object here is to show you the different data elements and demonstrate how the formulas work. These simple formulas don’t take into account realistic values or other risk factors that may affect likelihood and impact. However, they do demonstrate the basics of how you might calculate these two risk elements. You’ll find that these particular formulas are prevalent throughout the Security+ exam as well as other higher-level information security exams, such as the CISSP.
![]()
Understand the formula for computing the ALE:
SLE (single loss expectancy) × ARO (annualized rate of occurrence)
Qualitative Assessment
Quantitative risk assessments seem to be, on the surface, the way to go if an organization wants a very accurate, data-driven view of risk. However, there are several problems with quantitative analysis. First, a lack of data can force organizations to use incomplete or subjective numerical values. Second, even exact numbers can be misleading, simply because of the different methods people and organizations use to arrive at numerical values. Yet another issue is the fact that even when you’re talking about exact numbers, they can still be subjective. People, because of their own opinions or limitations of their data collection and analysis processes, sometimes have to make educated guesses about numerical values. These issues can cause data to be incomplete, inexact, or simply incorrect. Another big shortfall with quantitative analysis is that many other types of data cannot be easily quantified or measured. Some of these pieces of data are also subjective. In other words, they are dependent upon the point of view of the person collecting and analyzing the data. This is why a qualitative analysis is often preferred.
Qualitative analysis doesn’t necessarily use numerical values; it relies on descriptive elements derived from opinion, trend analysis, or best estimates. For example, what would the impact be to an organization if it suffered a loss of reputation in the marketplace? Reputation cannot be easily quantified numerically. But it can be assigned a descriptive value, such as low, medium, or high. Those are typically the values (or some similar range of descriptive values) that qualitative analysis uses. In the case of loss of reputation, the impact might be designated as high, for instance. Even risk elements that could normally be assigned a numerical value can be expressed qualitatively. The likelihood of a threat exploiting a vulnerability could be expressed in a range of descriptive values, such as very low, low, medium, high, and very high. The same could be said for impact. Of course, these values are subjective; what one person believes to be a high likelihood, another may believe to be a very high likelihood. In qualitative analysis, the organization must come to consensus over what qualitative values mean and the relationships among values.
Despite the subjective nature of qualitative analysis, this type of assessment can be very meaningful and accurate. The organization can develop a method of calculating risk based upon the relative values of impact and likelihood, even given descriptive values. In Figure 6-1, taken from NIST SP 800-30, risk can be calculated from a qualitative perspective using descriptive likelihood and impact values.

Figure 6-1 Qualitative and semi-qualitative values (from NIST SP 800-30, Guide for Conducting Risk Assessments)
It’s also worth mentioning here that another type of scale could be used, one that does use numeric values. You could have a scale that uses values from 1 to 10, for example. In this case, the scale will be referred to as semi-quantitative, because these numbers could be averaged together to get aggregate values. However, since it is still a subjective measurement, it is still really a qualitative type of analysis.
Putting It All Together: Determining Risk
Although qualitative risk analysis is probably most often used because it can accept a wide variety of data including elements that are not easily quantifiable, most organizations use a combination of qualitative and quantitative analysis. For example, to calculate the impact, the organization might use quantitative assessments. To calculate likelihood, they may go with a qualitative approach. For some risk scenarios, either one or both may be more appropriate. Which method an organization uses depends upon what type of data they have and what type of data they want to obtain from the analysis. Also keep in mind that although risk scenarios typically revolve around a single threat, vulnerability, and asset at a time taken together in context, these risks are usually calculated and then rolled up into a larger level of risk that applies to the entire organization. Figure 6-2, also taken from NIST SP 800-30, illustrates how the use of qualitative values can be used to describe overall risk.
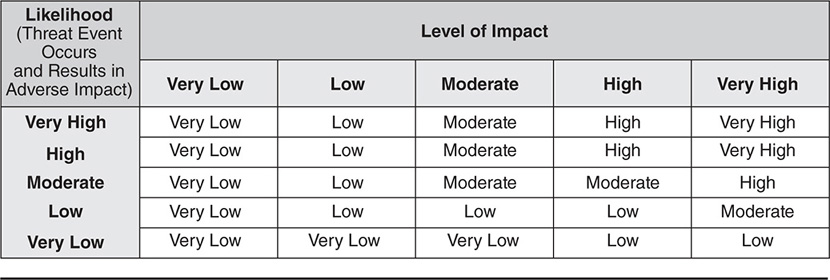
Figure 6-2 Qualitative assessment of risk (from NIST SP 800-30, Guide for Conducting Risk Assessments)
![]()
Remember the difference between qualitative and quantitative assessment methods. Qualitative methods used descriptive terms, while quantitative methods primarily use numerical values.
Risk Response
We discussed risk response in Module 5; it’s important to revisit it here simply because how the organization responds to risk depends upon the results of the risk assessment. Several different factors affect how an organization will respond to risk; these include cost of the response, the asset value, how effective the response will be, and the organization’s ability to respond to the risk. The cost perspective is probably the one that is most affected by the risk assessment, because the organization must balance the cost of the risk response to the value it receives by protecting the asset. This value is directly affected by the cost of the asset, the revenue it generates, the cost to replace it if it’s lost, and the cost of controls needed to protect it from the risk.
For example, let’s assume that the cost of a piece of equipment is $10,000. To protect it from given risk scenarios, we require $2000 in added security controls as part of a risk mitigation and reduction response. This is an easy decision; spending $2000 to protect a $10,000 asset saves us $8000, since we are avoiding its loss and full replacement cost. On the other hand, let’s say it costs $15,000 in security controls and mitigations to protect this $10,000 piece of equipment. At that point, the organization has to decide whether the cost of mitigation is worth it or not. In this case, the organization may have to look at other risk response options, such as risk acceptance, avoidance, or even transference (through the use of insurance, for example, to offset the replacement cost when the asset is lost). In the end, a risk assessment is used not only to give us an idea of how likely risk is and its expected impact on the organization, but what it would take to reduce the risk in terms of resources, and help us determine which risk response option would be better.
Module 6 Questions and Answers
Questions
1. Which elements of risk are the primary concern in a risk assessment? (Choose two.)
A. Threat
B. Likelihood
C. Vulnerability
D. Impact
2. Which of the following would be considered an internal risk factor?
A. Economy
B. Legal governance
C. Organizational structure
D. Market
3. Which of the following terms describes the time period between potential major failures of a hardware component?
A. MTBF
B. MTTF
C. MTTR
D. Recovery point objective
4. Which of the following steps should come immediately after “determine the likelihood of occurrence” in the NIST SP 800-30 risk assessment process?
A. Determine risk.
B. Identify threat sources and events.
C. Identify vulnerabilities and predisposing conditions.
D. Determine the magnitude of impact.
5. Which of the following risk assessment methods would use concrete values of cost and statistical data?
A. Qualitative
B. Quantitative
C. Threat assessment
D. Vulnerability assessment
6. Which of the following would be considered descriptive values in a qualitative risk assessment?
A. High, medium, and low
B. SLE = AV × EF
C. ALE = SLE × ARO
D. Cost = $10,000, Exposure Factor = .60
7. Which of the following factors are used to compute single loss expectancy (SLE)? (Choose two.)
A. ARO
B. EF
C. AV
D. ALE
8. Which of the following is expressed as a potential percentage of loss of an asset?
A. Exposure factor
B. Asset value
C. Depreciation value
D. Single loss expectancy
9. Which of the following are used to compute annualized loss expectancy (ALE)? (Choose two.)
A. AV
B. EF
C. ARO
D. SLE
10. Given that an asset cost $20,000 to replace, and the cost of the controls the company must implement to protect the asset total $5000, which of the following would be the best approach to risk response?
A. Do not spend the money on the mitigating control and accept the risk.
B. Implement the controls in a risk mitigation response strategy.
C. Avoid the risk by not using the asset.
D. Insure the asset for its depreciated value of $10,000.
Answers
1. B, D. Likelihood and impact are the risk elements of primary concern in a risk assessment.
2. C. Organizational structure would be considered an internal risk factor, since the organization has direct control over it.
3. A. The mean time between failures (MTBF) is a term that describes the time between potential component failures.
4. D. “Determine the magnitude of impact” comes after the “determine the likelihood of occurrence” step in the NIST SP 800-30 risk assessment process.
5. B. Quantitative risk assessment methods would use concrete values of cost and statistical data.
6. A. Values of high, medium, and low would be considered descriptive values in a qualitative risk assessment.
7. B, C. Exposure factor (EF) and asset value (AV) are used to compute single loss expectancy (SLE).
8. A. The exposure factor is the potential percentage of loss of an asset.
9. C, D. Annualized rate of occurrence (ARO) and single loss expectancy (SLE) are the factors used to compute annualized loss expectancy (ALE).
10. B. Given that the cost of implementing controls to protect the asset is far less than the replacement value of the asset, the best approach would be to implement the required controls in a risk mitigation response strategy. This is not the best scenario for risk acceptance, simply because the risk does not go away and it will cost the company the replacement value of the asset in the future. Obviously, avoiding the risk and not using the asset is not an option, since the asset is of some value to the company and is required for its business. Insuring the asset for less than its replacement value will still cost the company money in the end; in this scenario it would be twice the cost required for implementing controls to mitigate the risk.