You can type tabular data — in other words, data in a grid of rows and columns — directly into a table or import it from other applications. You can also apply much of the formatting that you learned about in Chapters 6 and 7, but there are some special methods that you must consider when working with tabular data. In this chapter, you'll learn how to create and manage PowerPoint tables and how to insert tabular data from other sources.
A table is a great way to organize little bits of data into a meaningful picture. For example, you might use a table to show sales results for several salespeople or to contain a multicolumn list of team member names.
Note
Text from a table does not appear in the presentation's outline.
There are several ways to insert a table, and each method has its purpose. The following sections explain each of the table creation methods. (Methods that involve using other programs, such as Word or Excel are covered later in the chapter, in the sections "Using Tables from Word" and "Integrating Excel Cells into PowerPoint.")
A table can be part of a content placeholder, or it can be a separate, free-floating item. If the active slide has an available placeholder that can accommodate a table, and there is not already content in that placeholder, the table is placed in it. Otherwise the table is placed as an independent object on the slide and is not part of the layout.
Tip
Depending on what you want to do with the table, it could be advantageous in some cases to not have the table be part of the layout. For example, perhaps you want the table to be a certain size and to not change when you apply a different theme. To ensure that the table is not part of the layout, start with a slide that uses a layout that contains no table-compatible placeholder, such as Title Only.
Note
In earlier versions of PowerPoint, an AutoLayout feature changed the layout to one that contained a table placeholder if squf were available. A lot of people found that annoying, though, and PowerPoint 2007 does not do it.
To create a basic table with a specified number of rows and columns, you can use the Insert Table dialog box. You can open it in either of two ways (see figure 9.1):
In a content placeholder, click the Table icon.
On the Insert tab, choose Table

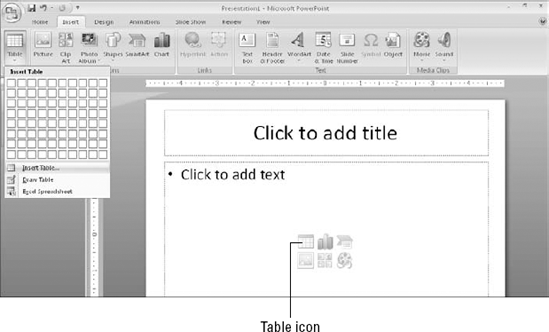
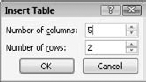
In the Insert Table dialog box shown in figure 9.2, specify a number of rows and columns and click OK. The table then appears on the slide.
When you opened the Table buttons menu (see figure 9.1) in the preceding section, you probably couldn't help but notice the grid of white squares. Another way to create a table is to drag across this grid until you select the desired number of rows and columns. The table appears immediately on the slide as you drag, so you can see how it will look, as shown in figure 9.3.
Other than the method of specifying rows and columns, this method is identical to creating a table via the dialog box, because the same issues apply regarding placeholders versus free-floating tables. If a placeholder is available, PowerPoint uses it.
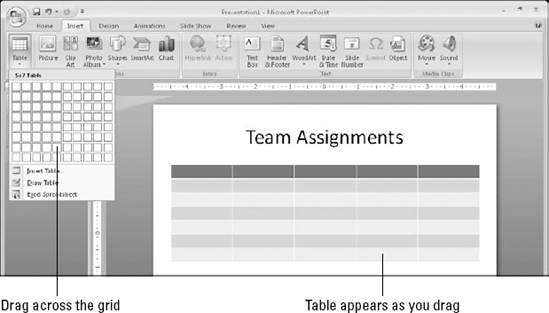
Figure 9.3. Drag across the grid in the Table button's menu to specify the size of the table that you want to create.
Note
When you create a table with this method and the preceding one, the table is automatically formatted with one of the preset table styles. You learn how to change this later in the chapter.
I've saved the most fun method for last. Drawing a table enables you to use your mouse pointer like a pencil to create every row and column in the table in exactly the positions you want. You can even create unequal numbers of rows and columns. This method is a good one to use whenever you want a table that is nonstandard in some way — different row heights, different column widths, different numbers of columns in some rows, and so on. To draw a table, follow these steps:
From the Insert tab, click Table, and choose Draw Table. The mouse pointer turns into a pencil.
Drag to draw a rectangle representing the outer frame of the table. Then release the mouse button to create the outer frame and to display the Design tab.
The mouse pointer remains a pencil; drag to draw the rows and columns you want. You can draw a row or column that runs all the way across or down the tables frame, or you can stop at any point to make a partial row or column. See figure 9.4. When you begin to drag vertically or horizontally, PowerPoint locks into that mode and keeps the line exactly vertical or horizontal and straight. (Exception: It allows you to draw a diagonal line between two corners of existing cells.)
(Optional) To erase a line, click the Eraser button on the Table Tools Design tab, and then click the line to erase. Then click the Draw Table button on the Design tab to return the mouse pointer to its drawing (pencil) mode.
When you finish drawing the table, press Esc or click Draw Table again to toggle the drawing mode off.

Tip
If you need a table that is mostly uniform but has a few anomalies, such as a few combined cells or a few extra divisions, create the table using the Insert Table dialog box or the grid on the Table button, and then use the Draw Table and/or Eraser buttons on the Design tab to modify it.
Each cell is like a little text box. To type in a cell, click in it and type. It's pretty simple! You can also move between cells with the keyboard. Table 9.1 lists the keyboard shortcuts for moving the insertion point in a table.
If you want to apply formatting to one or more cells, or issue a command that acts upon them such as Copy or Delete, you must first select the cells to be affected, as in figure 9.5:
A single cell: Move the insertion point by clicking inside the desired cell. At this point, any command acts on that individual cell and its contents, not the whole table, row, or column. Drag across multiple cells to select them.
An entire row or column: Click any cell in that row or column and then open the Select buttons menu on the Layout tab and choose Select Column or Select Row. Alternatively position the mouse pointer above the column or to the left of the row, so that the mouse pointer turns into a black arrow, and then click to select the column or row. (You can drag to extend the selection to additional columns or rows when you see the black arrow.)

Figure 9.5. Select a row or column with the Select button's menu, or click above or to the left of the column or row.
There are two ways to select the entire table — or rather, two senses in which the entire table can be "selected":
Select all table cells: When you select all of the cells, they all appear with shaded backgrounds, and any text formatting command that you apply at that point affects all of the text in the table. To select all cells, do any of the following:
Choose Select Table from the Select buttons menu, shown in figure 9.5.
Drag across all of the cells in the entire table.
Click inside the table, and then press Ctrl+A.
Select the entire table: When you do this, the tables frame is selected, but the insertion point is not anywhere within the table and cells do not appear with a shaded background. You do this kind of selection before moving or resizing the table, for example. To select the entire table, do any of the following:
Click the frame of the table.
Click inside the table, and then press Esc once.
Right-click the table and choose Select Table.
Drag a marquee around the table: You can use the mouse to drag a marquee (a box) around the table. This is also called lassoing. When you release the mouse button, everything inside the area is selected.
Now that you've created a table, let's look at some ways to modify the table's structure, including resizing the entire table, adding and deleting rows and columns, and merging and splitting cells.
As with any other framed object in PowerPoint, dragging the table's outer frame resizes it. Position the mouse pointer over one of the selection handles (the dots on the sides and corners) so that the mouse pointer becomes a double-headed arrow, and drag to resize the table. See Figure 9.6.

Note
If you drag when the mouse pointer is over any other part of the frame, so that the mouse pointer becomes a four-headed arrow, you move the table rather than resize it.
To maintain the aspect ratio (height to width ratio) for the table as you resize it, hold down the Shift key as you drag a corner of the frame. If maintaining the aspect ratio is not critical, you can drag either a corner or a side.
All of the rows and columns maintain their spacing proportionally to one another as you resize them. However, when a table contains text that would no longer fit if its row and column were shrunken proportionally with the rest of the table, the row height does not shrink fully; it shrinks as much as it can while still displaying the text. The column width does shrink proportionally, regardless of cell content.
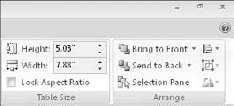
You can also specify an exact size for the overall table frame by using the Table Size group on the Layout tab, as shown in figure 9.7. From there you can enter Height and Width values. To maintain the aspect ratio, mark the Lock Aspect Ratio check box before you change either the Height or Width settings.
Here's an easy way to create a new row at the bottom of the table: Position the insertion point in the bottom-right cell and press Tab. Need something more complicated than that? The Layout tab contains buttons in the Rows & Columns group for inserting rows or columns above, below, to the left, or to the right of the selected cell(s), as shown in Figure 9.8. By default, each button inserts a single row or column at a time, but if you select multiple existing ones beforehand, these commands insert as many as you've selected. For example, to insert three new rows, select three existing rows and then click Insert Above or Insert Below.

Alternatively, you can right-click any existing row or column, point to Insert, and choose one of the commands on the submenu. These commands are the same as the names of the buttons in figure 9.8.
Warning
Adding new rows increases the overall vertical size of the table frame, even to the point where it runs off the bottom of the slide. You might need to adjust the overall frame size after adding rows. On the other hand, inserting columns does not change the overall frame size; it simply resizes the existing columns so that they all fit and are all a uniform size (unless you have manually adjusted any of them to be a custom size).
To delete a row or column (or more than one of each), select the row(s) or column(s) that you want to delete, and then open the Delete buttons menu on the Layout tab and choose Delete Rows or Delete Columns.
Note
cannot insert or delete individual cells in a PowerPoint table. (This is unlike in Excel, where you can remove individual cells and then shift the remaining ones up or to the left.)
If you need more rows or columns in some spots than others, you can use the Merge Cells and Split Cells commands. Here are some ways to merge cells:
Click the Eraser button on the Design tab, and then click the line you want to erase. The cells on either side of the deleted line are merged.
Select the cells that you want to merge and click Merge Cells on the Layout tab.
Select the cells to merge, right-click them, and choose Merge Cells.
Here are some ways to split cells:
Click the Draw Table button on the Design tab, and then drag to draw a line in the middle of a cell to split it.
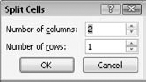
Select the cell that you want to split, right-click it, and choose Split Cells. In the Split Cells dialog box (see figure 9.9), select the number of pieces in which to split in each direction, and click OK.
Select the cell to split, and then click Split Cells on the Layout tab. In the Split Cells dialog box (see figure 9.9), select the number of pieces in which to split in each direction, and click OK.
The quickest way to format a table attractively is to apply a table style to it. When you insert a table using any method except drawing it, a table style is applied to it by default; you can change to some other style if desired, or you can remove all styles from the table, leaving it plain black-and-white.
When you hover the mouse pointer over a table style, a preview of it appears in the active table. The style is not actually applied to the table until you click the style to select it, however.
If the style you want appears on the Table Tools Design tab without opening the gallery, you can click it from there. If not, you can scroll row by row through the gallery by clicking the up/down arrow buttons, or you can open the gallery's full menu as shown in figure 9.10.

To remove all styles from the table, choose Clear Table from the bottom of the gallery menu. This reverts the table to default settings: no fill, and plain black 1-point borders on all sides of all cells.
The table styles use theme-based colors, so if you change to a different presentation theme or color theme, the table formatting might change. (Colors, in particular, are prone to shift.)
By default, the first row of the table (a.k.a. the header row) is formatted differently from the others, and every other row is shaded differently. (This is called banding.) You can control how different rows are treated differently (or not) from the Table Style Options group on the Table Tools Design tab. There is a check box for each of six settings:
Header row: The first row
Total row: The last row
First column: The leftmost column
Last column: The rightmost column
Banded rows: Every other row formatted differently
Banded columns: Every other column formatted differently
Warning
With some of the styles, there is not a whole lot of difference between some of the settings. For example, you might have to look very closely to see the difference between First Column being turned on or off; ditto with Last Column and Total Row.
Although table styles provide a rough cut on the formatting, you might like to fine-tune your table formatting as well. In the following sections you learn how to adjust various aspects of the tables appearance.
You might want a row to be a different height or a column a different width than others in the table. To resize a row or column, follow these steps:
Position the mouse pointer on the border below the row or to the right of the column that you want to resize. The mouse pointer turns into a line with arrows on each side of it.
Hold down the mouse button as you drag the row or column to a new height or width. A dotted line appears showing where it will go.
Release the mouse button.
You can also specify an exact height or width measurement using the Height and Width boxes in the Cell Size group on the Layout tab. Select the row(s) or column(s) to affect, and then enter sizes in inches or use the increment buttons, as shown in figure 9.11.

The Distribute Rows Evenly and Distribute Columns Evenly buttons in the Cell Size group (see figure 9.11) adjust each row or column in the selected range so that the available space is occupied evenly among them. This is handy especially if you have drawn the table yourself rather than allowed PowerPoint to create it initially. If PowerPoint creates the table, the rows and columns are already of equal height and width by default.
Remember, PowerPoint slides do not have any margins per se; everything is in a frame. An individual cell does have internal margins, however.
You can specify the internal margins for cells using the Margins button on the Layout tab, as follows:
Select the cells to which the setting should apply. To apply settings to the entire table, select the entire table.
On the Layout tab, click the Margins button. A menu of margin presets opens.
Click one of the presets or choose Custom Margins, and then follow these steps:
In the Cell Text Layout dialog box, set the Left, Right, Top, and Bottom margin settings, as shown in figure 9.12.
Click OK.

The border lines around each cell are very important because they separate the data in each cell. By default (without a table style) there's a 1-point border around each side of each cell, but you can make some or all borders thicker, a different line style (dashed, for example), a different color, or remove them altogether to create your own effects. Here are some ideas:
To make items appear to "float" in multiple columns on the slide (that is, to make it look as if they are not really in a table at all —just lined up extremely well), remove all table borders.
To create a header row at the top without using the Quick Style Options, make the border beneath the first row of cells darker or thicker than the others.
To make certain rows or columns appear as if they are outside of the table, turn off their borders on all sides except the side that faces the other cells.
To make certain items appear as if they have been crossed off a list, format those cells with diagonal borders. This creates the effect of an X running through each cell. These diagonal lines are not really borders in the sense that they don't go around the edge of the cell, but they're treated as borders in PowerPoint.
When you apply a top, bottom, left, or right border, those positions refer to the entire selected block of cells if you have more than one cell selected. For example, suppose you select two adjacent cells in a row and apply a left border. The border applies only to the leftmost of the two cells. If you want the same border applied to the line between the cells too, you must apply an inside vertical border.
To apply a border, follow these steps:
Select the cell(s) that you want to affect.
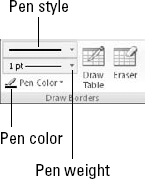
In the Draw Borders group on the Table Tools Design tab, select a line style, width, and color from the Pen Style, Pen Weight, and Pen Color drop-down lists. See figure 9.13.
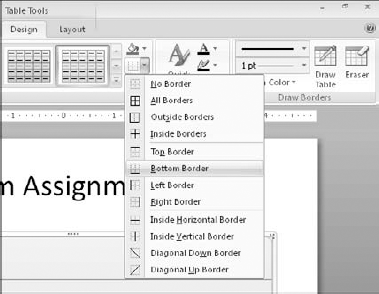
Open the Borders buttons menu in the Table Styles group and choose the sides of the selected area to which the new settings should apply. See figure 9.14. For example, to apply the border the bottom of the selected area, click Bottom Border.
If you want to remove all borders from all sides, choose No Border from the menu.
If necessary, repeat step 3 to apply the border to other sides of the selection. Some of the choices on the Borders buttons menu apply to only one side; others apply to two or more at once.
By default, table cells have a transparent background so that the color of the slide beneath shows through. When you apply a table style, as you learned earlier in the chapter, the style specifies a background color — or in some cases, multiple background colors depending on the Quick Style Options you choose for special treatment of certain rows or columns.
You can also manually change the fill for a table to make it either a solid color or a special fill effect. You can apply this fill to individual cells, or you can apply a background fill for the entire table.
Each individual cell has its own fill setting; in this way a table is like a collection of individual object frames, rather than a single object. To set the fill color for one or more cells, follow these steps:
Select the cell(s) to affect, or to apply the same fill color to all cells, select the tables outer frame.
On the Table Tools Design tab, click the down arrow next to the Shading button to open its palette.
Select the desired color or fill effect. See figure 9.15.

Note
For more on the various effects, see Chapter 10. Also see "Filling a Table with a Picture" later in this chapter for some issues involving picture fills specific to tables.
Tip
For a semi-transparent, solid-color fill, first apply the fill and then right-click the cell and choose Format Shape. In the Format Shape dialog box, drag the Transparency slider. For some types of fills, you can also set the transparency when you initially apply the fill.
New in PowerPoint 2007, you can apply a solid color fill to the entire table that is different from the fill applied to the individual cells. The tables fill color is visible only in cells in which the individual fill is set to No Fill (or a semi-transparent fill, in which case it blends).
To apply a fill for the entire table, open the Shading buttons menu and point to Table Background, and then choose a color, as shown in figure 9.16.
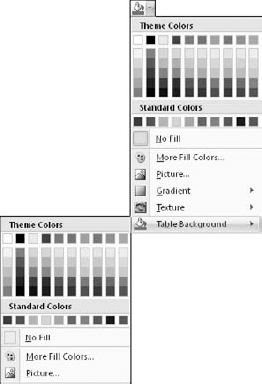
To test the new background, select some cells and choose No Fill for their fill color. The background color appears in those cells. If you want to experiment further, try applying a semi-transparent fill to some cells, and see how the color of the background blends with the color of the fill.
When you fill one or more cells with a picture, each cell gets its own individual copy of it. For example, if you fill a table with a picture of a dog, and the table has six cells, you get six dogs as shown in figure 9.17.
If you want a single copy of the picture to fill the entire area behind the table, there are two ways you can do this. One is to set the picture to be tiled like a texture. Follow these steps:

Apply the picture to all of the cells in the table, or to the range of cells in which you want it to appear. To do this:
Select the cells, and then right-click the selection and choose Format Shape.
Click Fill, and then click Picture or Texture Fill.
Click the File button, select the picture file, and click Insert.
Mark the Tile Picture as Texture check box. See figure 9.18.

At this point, the picture fills the table without regard for cell borders, but it probably doesn't fill it exactly. Depending on the original size of the graphic and the size of the table, you probably either see a truncated version of the picture or a tiled version that does not match up with the cell borders. figure 9.19 shows some examples.

To adjust the picture, use the Tiling Options in the Format Shape dialog box, shown in figure 9.18:
Adjust the position of the picture within the table by changing the Offset X and Offset Y values. These are measured in points, and move the picture to the right (X) and down (Y).
Change the sizing of the picture by adjusting the Scale X and Scale Y values. The smaller the number, the smaller the picture — but don't go too small or the picture will start to tile (unless that's what you want, of course).
Change the way the picture aligns in the table by changing the Alignment.
(Optional) Set a mirror type if desired so that if you do have multiple copies tiled within the frame, each copy is flipped horizontally and/or vertically. (This is not common.)
It can take some time to get the picture optimally adjusted so that it exactly fits in the allotted space. If all of that seems like more than you want to mess with, there is an alternative method: make the table transparent and place the picture behind it on the slide. Here's how:
Place the picture on the slide by choosing Insert
Select the picture and choose Format
Create a plain unformatted table on top of the picture.
Set the table's fill to No Fill if it is not already transparent.
Resize the table and the picture as needed so they are both the same size. You might need to crop the picture to keep the right aspect ratio. figure 9.20 shows a table overlaid over a photo in this way.

New in PowerPoint 2007, you can apply a shadow effect to a table. You can make it any color you like, and adjust a variety of settings for it.
Note
If the cells have no fill, the shadow will apply to the gridlines, not to the table as a whole object.
To apply a shadow to a table, follow these steps:
Select the tables outer frame, and then right-click the frame and choose Format Shape.
Click Shadow, and then choose a preset and a color. See figure 9.21.
(Optional) If desired, drag any of the sliders to fine-tune the shadow. These are covered in greater detail in Chapter 10.
Click Close to close the Format Shape dialog box when you are finished.

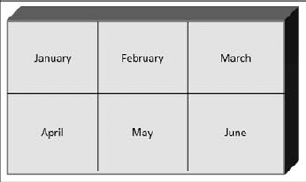
PowerPoint does not enable you to apply 3-D effects to tables, so you have to fudge that by creating the 3-D effect with rectangles and then overlaying a transparent table on top of the shapes. As you can see in figure 9.22, it's a pretty convincing facsimile.
You might need to read Chapter 10 first to do some of these steps, but here's the basic procedure:
Create a rectangle from the Shapes group on the Insert tab, and apply a 3-D effect to it. Use any effect you like. To create the traditional "box" appearance as in figure 9.22, apply the second Oblique preset and then in the 3-D Format options, increase the Depth setting to about 100 points.
Size the rectangle so that its face is the same size as the table.
On the Format tab, click Send to Back to send the rectangle behind the table.
Set the tables fill to No Fill if it is not already transparent.
(Optional) Set the tables outer frame border to Squf to make its edges appear to blend with the edges of the rectangle. To do that, open the Borders buttons menu and select Outside Border to topple that off.
If you followed the preceding steps to create the effect shown in figure 9.22, you probably ran into a problem: Your text probably didn't center itself in the cells. That's because by default each cell's vertical alignment is set to Top, and horizontal alignment is set to Left.
Although the vertical and horizontal alignments are both controlled from the Alignment group on the Layout tab, they actually have two different scopes. Vertical alignment applies to the entire cell as a whole, whereas horizontal alignment can apply differently to individual paragraphs within the cell. To set vertical alignment for a cell, follow these steps:
Select one or more cells to affect. To affect only one cell, you do not have to select it; just click inside it.
On the Layout tab, in the Alignment group, click one of the vertical alignment buttons: Align Top, Center Vertically, or Align Bottom. See figure 9.23.

To set the horizontal alignment for a paragraph, follow these steps:
Select one or more paragraphs to affect. If you select multiple cells, all paragraphs within those cells are affected. If you click in a cell without selecting anything, the change only affects the paragraph in which you clicked.
On the Layout tab, in the Alignment group, click one of the horizontal alignment buttons: Align Left, Center, or Align Right. See figure 9.23. You can also use the paragraph alignment buttons on the Home tab for horizontal alignment, or the buttons on the mini toolbar.
Tip
The horizontal alignments all have keyboard shortcuts: Ctrl+L for left, Ctrl+E for center, and Ctrl+R for right.
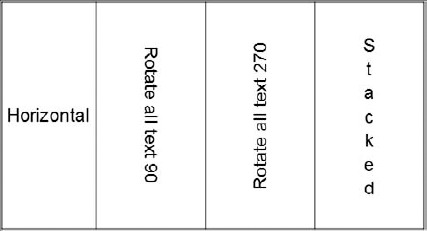
The default text direction for table cells is Horizontal, which reads from left to right (at least in countries where that's how text is read). figure 9.24 shows the alternatives.
To change the text direction for a cell, follow these steps:
Select the cell(s) to affect. To affect only a single cell, move the insertion point into it.
On the Layout tab, click Text Direction.
Select a text direction from the menu that appears.
If a table already exists in Word, you can copy it into PowerPoint. PowerPoint will convert the Word table to a PowerPoint table. From that point on, it is a part of the presentation, and maintains no relationship to Word. You can edit its text directly in PowerPoint.
To paste a table from Word to PowerPoint, copy it to the Clipboard (Ctrl+C) in Word, and then paste it onto a slide in PowerPoint (Ctrl+V). The resulting table appears in the center of the slide.
Note
You might need to increase the font size; Word's default size for body text is great for printed documents, but too small for most PowerPoint slides.
A pasted Word table is placed into a content placeholder on the slide if an appropriate one is available. Here are the basic rules for what goes on:
If the slide has an appropriate content placeholder that is empty, the table is placed into it but retains its own size and shape.
If the slide does not have a usable content placeholder at all (for example, a Title Only slide), a placeholder is created for it. (You can tell the table is in a placeholder because when you change layouts, the table travels into the new layouts.)
If the slide already has content placeholders, but they are not empty, the table is inserted as a free-floating object, unrelated to any placeholders.
Word's table feature is somewhat more robust than PowerPoint's. If you want to maintain all the Word capabilities in the table, paste the table as a Word object instead of doing a regular paste. Follow these steps:
Copy the table in Word (Ctrl+C).
In PowerPoint, display the slide on which the table should be pasted.
On the Home tab, open the Paste button's menu and click Paste Special. The Paste Special dialog box opens.
Click the Paste option button.
In the As list, choose Microsoft Office Word Document Object.
Click OK. The table appears as a free-floating object (not in any placeholder).
The resulting table is an embedded object, and not directly editable using PowerPoint's table feature. To edit the object, you must double-click it to open it in Word.
Tip
To maintain a dynamic link between the Word file and the PowerPoint presentation, choose Paste Link instead of Paste in step 4. However, be aware that if you move the Word file, an error will appear in PowerPoint when it cannot find the file referenced in the link. See Chapter 15 for more information about linking and embedding.
If you need the calculating capabilities in a table, consider embedding Excel cells into the slide instead of using a traditional PowerPoint table.
Object linking and embedding is covered in detail in Chapter 15, but here's a quick look at how to use Excel from within PowerPoint:
Display the slide on which you want to place the Excel table.
If desired, select a placeholder into which it should be placed.
On the Insert tab, click the Table button, and on its menu, choose Excel Spreadsheet. A small frame with a few cells of an Excel spreadsheet appears, and the Ribbon changes to the tabs and tools for Excel. See figure 9.25.
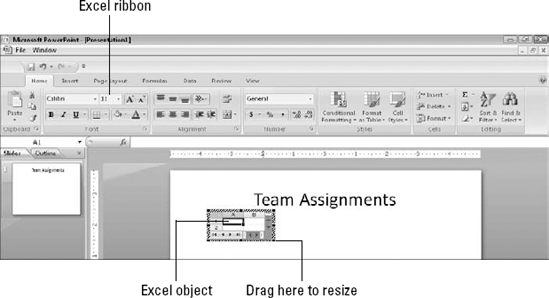
Figure 9.25. An Excel object can substitute for a table grid and can provide Excel-specific capabilities.
Note
Don't worry that the object does not seem to be correctly aligned at the top and left. The cell row and column labels appear as you edit, and they disappear when you click away from the object.
If desired, enlarge the Excel object by doing the following:
Click once on the Excel objects border to select it. Black selection handles appear around it.
Drag a corner selection handle to enlarge the area of the object.
Create the table using Excels tools and features.
(Optional) If there are unused cells, resize the object again (using its selection handles) so that they are not visible.
Click away from the object to deselect it and return to PowerPoint.
You've just created an embedded Excel object. It does not exist outside of this PowerPoint file; it's a mini-Excel spreadsheet that you use just for this one presentation. If you want to embed content from an existing Excel file, copy and paste it as in the earlier section on Word tables, or see Chapter 15 for more information about your options for linking and embedding content.
In this chapter, you learned the ins and outs of creating and formatting tables in PowerPoint including how to insert, draw, move and resize the various cells of a table as well as how to add fills, styles, and effects. You also learned now to integrate Excel cells into your PowerPoint slides. In the next chapter, you learn how to draw and format objects.