Just as charts and graphs can enliven a boring table of numbers, a SmartArt diagram can enliven a conceptual discussion. SmartArt helps the audience understand the interdependencies of objects or processes visual way, so they don't have to juggle that information mentally as you speak. Some potential uses include organizational charts, hierarchy diagrams, and flow charts.
SmartArt replaces the old Diagrams and Organization Chart features in earlier PowerPoint versions. SmartArt is a special class of vector graphic object that combines shapes, lines, and text placeholders. SmartArt is most often used to illustrate relationships between bits of text.
The SmartArt interface is similar regardless of the type of diagram you are creating. You can type directly into the placeholders on the diagram, or you can display a text pane to the side of the diagram and type into that, much as you would type into an outline pane to have text appear in a slides text placeholder boxes. See figure 11.1. You can also select some text, right-click it, and choose Convert to SmartArt.

There are seven types of SmartArt diagrams in PowerPoint 2007, and each is uniquely suited for a certain type of data delivery
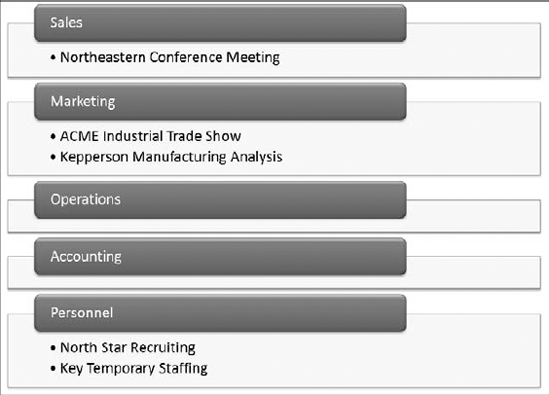
A list diagram presents information in a fairly straightforward, text-based way, somewhat like a fancy outline. List diagrams are useful when information is not in any particular order, or when the process or progression between items is not important. The list can have multiple levels, and you can enclose each level in a shape or not. figure 11.2 shows an example.
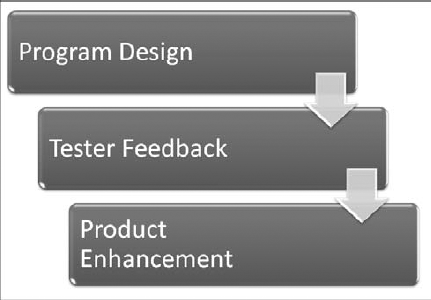
A process diagram is similar to a list, but it has directional arrows or other connectors that represent the flow of one item to another. This adds an extra aspect of meaning to the diagram. For example, in figure 11.3, the way the boxes are staggered and connected with arrows implies that the next step begins before the previous one ends.
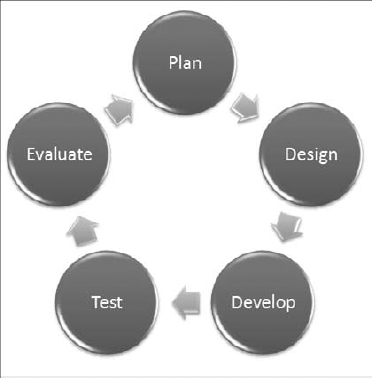
A cycle diagram also illustrates a process, but a repeating or recursive one — usually a process in which there is no fixed beginning or end point. You can jump into the cycle at any point. In figure 11.4, for example, the ongoing process of product development and improvement is illustrated.
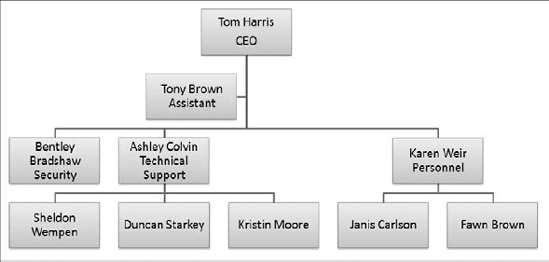
A hierarchy chart is an organization chart. It shows structure and relationships between people or things in standardized levels. For example, it can show who reports to whom in a company's employment system. It is useful when describing how the organization functions and who is responsible for what. In figure 11.5, for example, three organization levels are represented, with lines of reporting drawn between each level. Hierarchy diagrams can also run horizontally, for use in tournament rosters.

Figure 11.5. A hierarchy diagram, also called an organization chart, explains the structure of an organization.
Tip
Should you include your company's organization chart in your presentation? That's a question that depends on your main message. If your speech is about the organization, you should. If not, show the organization structure only if it serves a purpose to advance your speech. Many presenters have found that an organization chart makes an excellent backup slide. You can prepare it and have it ready in case a question arises about the organization. Another useful strategy is to include a printed organization chart as part of the handouts you distribute to the audience, without including the slide in your main presentation.
Relationship diagrams graphically illustrate how parts relate to a whole. One common type of relationship diagram is a Venn diagram, as in figure 11.6, showing how categories of people or things overlap. Relationship diagrams can also break things into categories or show how parts contribute to a whole, as with a pie chart.

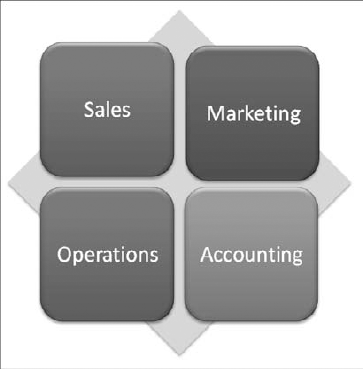
A matrix also shows the relationship of parts to a whole, but it does so with the parts in orderly looking quadrants. You can use matrix diagrams when you do not need to show any particular relationship between items, but you want to make it clear that they make up a single unit. See figure 11.7.
A pyramid diagram is just what the name sounds like — it's a striated triangle with text at various levels, representing not only the relationship between the items but also that the items at the smaller part of the triangle are less numerous or more important. For example, in figure 11.8, the diagram shows that there are many more workers than there are executives.

Tip
Notice in figure 11.8 that the labels do not confine themselves to within the associated shape. If this is a problem, you might be able to make the labels fit with a combination of line breaks (Shift+Enter) and font changes.
All SmartArt diagrams start out the same way — you insert them on the slide as you can any other slide object. That means you can either use a diagram placeholder on a slide layout or you can insert the diagram manually
To use a placeholder, start with a slide that contains a layout with a diagram placeholder in it, or change the current slides layout to one that does. Then click the Insert SmartArt Graphic icon in the placeholder, as shown in figure 11.9. To insert from scratch, click the SmartArt button on the Insert tab.

Insert SmartArt Graphic
Another way to start a new diagram is to select some text and then right-cick the selection and choose Convert to SmartArt.
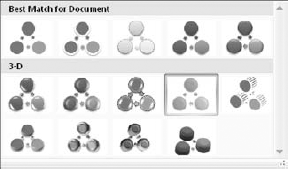
Any way you start it, the Choose a SmartArt Graphic dialog box opens, as shown in figure 11.10. Select one of the seven SmartArt categories, click the desired SmartArt object, and click OK, and the diagram appears. From there it's just a matter of customizing.
Note
Some diagrams appear in more than one category. To browse all of the categories at once, click All in figure 11.10.

When you select a diagram, SmartArt Tools tabs become available (Design and Format). You will learn what each of the buttons on them does as this chapter progresses. The buttons change depending on the type of diagram.
All SmartArt has text placeholders, which are basically text boxes. You simply click in one of them and type. Then use the normal text-formatting controls (Font, Font Size, Bold, Italic, and so on) on the Home tab to change the appearance of the text, or use the WordArt Styles group on the Format tab to apply WordArt formatting.
You can also display a text pane, as you saw in figure 11.1, and type or edit the diagram's text there. The text pane serves the same purpose for a diagram that the Outline pane serves for the slide as a whole.
Warning
The text in the outline pane is not always in the order you would expect it to be for the diagram because it forces text to appear in linear form from a diagram that is not necessarily linear. It does not matter how the text appears in the text pane because only you see that. What matters is how it looks in the actual diagram.
Here are some tips for working with diagram text:
To leave a text box empty, just don't type anything in it. The Click to add text words do not show up in a printout or in Slide Show view.
To promote a line of text, press Shift+Tab; to demote it, press Tab in the text pane.
Text wraps automatically, but you can press Shift+Enter to insert a line break if needed.
In most cases, the text size shrinks to fit the graphic in which it is located. There are some exceptions to that, though; for example, at the top of a pyramid, the text can overflow the tip of the pyramid.
All of the text is the same size, so if you enter a really long string of text in one box, the text size in all of the related boxes shrinks too. You can manually format parts of the diagram to change this behavior, as you will learn later in the chapter.
If you resize the diagram, its text resizes automatically.
Note
In PowerPoint 2003, you could not move shapes around in a diagram by default because AutoLayout was enabled. You don't have that problem in PowerPoint 2007 with SmartArt, though; you can select and move individual parts of the diagram freely, as you would any shapes.
The structure of the diagram includes how many boxes it has and where they are placed. Even though the diagram types are all very different, the way you add, remove, and reposition shapes in them is surprisingly similar across all types.
Note
When you add a shape, you add both a graphical element (a circle, a bar, or other) and an associated text placeholder. The same applies to deletion; removing a shape also removes its associated text placeholder from the diagram.
To insert a shape in a diagram, follow these steps:
Click a shape that is adjacent to where you want the new shape to appear.
On the SmartArt Tools Design tab, click Add Shape.
You can either click the top part of the Add Shape button to add a shape of the same level and type as the selected one, or you can click the bottom part of the button to open a menu from which you can choose other variants. The choices on the menu depend on the diagram type and the type of shape selected. For example, in figure 11.11, you can insert a shape into a diagram either before or after the current one (same outline level), or you can insert a shape that is subordinate (below) or superior to (above) the current one.
To delete a shape, click it to select it in the diagram, and then press the Delete key on the keyboard. You might need to delete subordinate shapes before you can delete the main shape.
Note
Not all diagram types can accept different numbers of shapes. For example the four-square matrix diagram is fixed at four squares.
In addition to adding shapes to the diagram, you can add bullets — that is, subordinate text to a shape. To do so, click the Add Bullet button. Bullets appear indented under the shapes text in the text pane, as shown in figure 11.12.

The difference between a shape and a bullet is primarily a matter of promotion and demotion in the Text Pane's outline. The text pane works just as the regular Outline pane does in this regard; you can promote with Shift+Tab or demote with Tab. You can also use the Promote and Demote buttons on the SmartArt Tools Design tab.
Each diagram flows in a certain direction. A cycle diagram flows either clockwise or counterclockwise. A pyramid flows either up or down.
If you realize after typing all of the text that you should have made the SmartArt diagram flow in the other direction, you can change it by clicking the Right to Left button on the Design tab. It is a toggle; you can switch back and forth freely.
Not only can you reverse the overall flow of the diagram, but you can also move around individual shapes. For example, suppose you have a diagram that illustrates five steps in a process and you realize that steps 3 and 4 are out of order. You can move one of them without having to retype all of the labels.
The best way to move a shape is to reorder the text in the text pane. Follow these steps:
Display the text pane if it does not already appear. You can either click the arrow button to the left of the diagram or click the Text Pane button on the SmartArt Tools Design tab.
Select some text to be moved in the text pane.
Press Ctrl+X to cut it to the Clipboard.
Click in the text pane at the beginning of the line above which it should appear.
Press Ctrl+V to paste.
Note
PowerPoint 2003 diagrams had a Shape Forward and Shape Backward button for moving shapes, but SmartArt does not have that. The text pane's editing capabilities make up for it, though.
You can individually select and drag each shape to reposition it on the diagram. Any connectors between it and the other shapes are automatically resized and extended as needed. For example, in figure 11.13, notice how the arrows that connect the circles in the cycle diagram have elongated as one of the circles has moved out.

After making changes to a SmartArt diagram, you can return it to its default settings with the Reset Graphic button on the SmartArt Tools Design tab. This strips off everything, including any SmartArt styles and manual positioning, and makes it exactly as it was when you inserted it except it keeps the text that you've typed.
The layouts are the diagram types. When you insert a SmartArt diagram you choose a type, and you can change that type at any time later.
To change the layout type, use the Layouts gallery on the Design tab, as shown in figure 11.14. You can open the gallery and click the desired type, or click More Layouts at the bottom of its menu to redisplay the same dialog box as in figure 11.10, from which you can choose any layout.

Hierarchy diagrams (organization charts) show the structure of an organization. They have some different controls for changing their structure compared to other diagrams, so this chapter looks at them separately.
The main difference when inserting an organization chart shape (that is, a box into which you will type a name) is that you must specify which existing box the new one is related to and how it is related.
For example, suppose you have a supervisor already in the chart and you want to add some people to the chart who report to him. You would first select his box on the chart, and then insert the new shapes with the Add Shape button. For a box of the same level, or of the previously inserted level, click the top part of the button; for a subordinate or other relationship, open the buttons menu. See figure 11.15. The chart can have only one box at the top level, however, just as a company can have only one CEO.

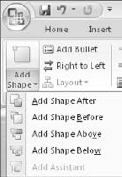
When you insert a new shape in a hierarchy diagram, four of the options are the same as with any other diagram, and one is new: Add Shape After and Add Shape Before insert shapes of the same level as the selected one, and Add Shape Above and Add Shape Below insert a superior and subordinate level respectively The new option, Add Assistant, adds a box that is neither subordinate nor superior, but a separate line of reporting, as shown in figure 11.16.

Note
An assistant is a person whose job is to provide support to a certain person or office. An executive secretary is one example. In contrast, a subordinate is an employee who may report to a manager but whose job does not consist entirely of supporting that manager. Confused? Don't worry about it. You don't have to make a distinction in your organization chart. Everyone can be a subordinate (except the person at the top of the heap, of course).
To delete a shape, select it and press the Delete key, as with all of the other diagram types.
As the organization changes, you might need to change your chart to show that people report to different supervisors. The easiest way to do that is to move the text in the text pane, the same way as you learned in the section "Reordering Shapes" earlier in this chapter.
For example, in figure 11.16, suppose you want to promote Ashley Colvin to be at the same level as Karen Weir and Bentley Bradshaw. You could click Ashley Colvin in the text pane and press Shift+Ta to promote her. Furthermore, suppose you want Sheldon Wempen to report to her. You could select his name, press Ctrl+X to cut, click under Ashley Colvin, and then press Ctrl+V to paste.
When subordinates report to a supervisor, you can list the subordinates beneath that supervisor in a variety of ways. In Standard layout, each subordinate appears horizontally beneath the supervisor. See figure 11.17.
However, in a large or complex organization chart, the diagram can quickly become too wide with the Standard layout. Therefore, there are "hanging" alternatives that make the chart more vertically oriented. The alternatives are Both, Left Hanging, and Right Hanging. They are just what their names sound like. figure 11-18 shows examples of Left Hanging (the people reporting to Ashley Colvin) and Right Hanging (the people reporting to Karen Weir).

The layout is chosen for individual branches of the organization chart, so before selecting an alternative layout, you must click on the supervisor box whose subordinates you want to change. To change a layout, follow these steps:
Click the box for the supervisor whose layout you want to change.
On the Design tab, click Layouts. A menu of layout options appears.
Choose one of the layouts (Standard, Both, Left Hanging, or Right Hanging).
Note
If the Layout button's menu does not open, you do not have a box selected in a hierarchy diagram.
You can format a diagram either automatically or manually. Automatically is the default, and many PowerPoint users don't even realize that manual formatting is a possibility The following sections cover both.
SmartArt Styles are preset formatting specs (border, fill, effects, shadows, and so on) that you can apply to an entire SmartArt diagram. They make it easy to apply surface texture effects that make the shapes look reflective or appear to have 3-D depth or perspective.
Note
SmartArt Styles do not include color changes. Those are separately controlled with the Change Colors button on the SmartArt Tools Design tab.
To apply a SmartArt style, follow these steps:
Select the diagram so that the SmartArt Tools Design tab becomes available.
On the SmartArt Tools Design tab, click one of the SmartArt Styles samples (see figure 11.19), or open the gallery and select from a larger list (see figure 11.20).

After you apply a SmartArt style, as in the preceding section, you might want to change the colors used in the diagram.
The easiest way to apply colors is to use the Change Colors buttons menu on the Design tab. You can select from a gallery of color schemes. As shown in figure 11.21, you can choose a Colorful scheme (one in which each shape has its own color), or you can choose a monochrome color scheme based on any of the current presentation color theme's color swatches.

In addition to formatting the entire diagram with a SmartArt Style, you can also format individual shapes using Shape Styles, just as you did in Chapter 10 with drawn objects. Here's a quick review
WordArt formatting works the same in a SmartArt diagram as it does everywhere else in PowerPoint. Use the WordArt Styles gallery and controls on the SmartArt Tools Format tab to apply text formatting to individual shapes, or select the entire diagram to apply the changes to all shapes at once. See Chapter 10 for more information about using WordArt Styles.
In some diagram types, it is advantageous to make certain shapes larger or smaller than the others. For example, if you want to emphasize a certain step in a process, you can create a diagram where that step's shape is larger. Then you can repeat that same diagram on a series of slides, but with a different step in the process enlarged on each copy, to step through the process. There are several options for this:
You can manually resize a shape by dragging its selection handles, the same as with any other object. However, this is imprecise, and can be a problem if you want multiple shapes to be enlarged because they won't be consistently so.
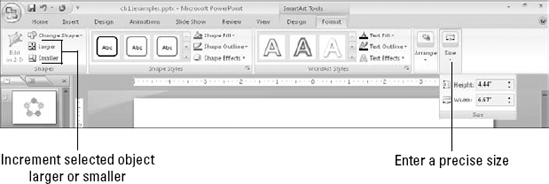
You can set a precise size for the entire diagram using the Size group on the Format tab, a height and width measurement, as shown in figure 11.22. However, if different shapes are already different sizes, and you want to resize them in proportion, this won't help.
You can use the Larger or Smaller buttons on the Format tab to bump up or down the sizes of one or more shapes slightly with each successive click.
When you resize the entire SmartArt object as a whole, everything within its frame changes size proportionally. There are several ways to do this:
Drag and drop a corner selection handle on the SmartArt graphic's outer frame.
Use the Size controls on the SmartArt Tools Format tab to enter a precise height and width.
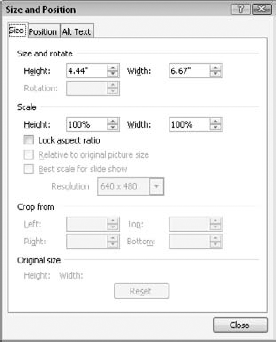
Right-click the outer frame of the SmartArt and choose Size and Position. The Size and Position dialog box opens, as shown in figure 11.23; on the Size tab, enter a height and width in inches, or scale it by a percentage in the Scale box. Mark the Lock Aspect Ratio check box if you want to maintain the proportions.
If you choose one of the 3-D selections from the SmartArt Style gallery, the text might become a bit hard to read and edit when you are working with the diagram at a small zoom percentage. There are a couple of ways around this:
Right-click a shape and choose Edit Text. The face of the shape appears in 2-D temporarily, making it easier to edit the text.
Click the Edit in 2-D button on the SmartArt Tools Format tab. The entire diagram appears in 2-D temporarily.
Warning
Even though the face of the shape appears in 2-D, which you think would make it easier to read, in some diagram types and styles the text might still be fuzzy and hard to read. You might be better off editing it in the text pane.
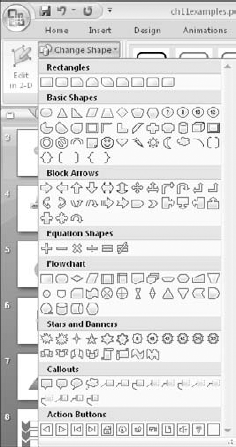
Each SmartArt layout has its own defaults that it uses for the shapes, but you can change these manually On the SmartArt Tools Format tab, click Change Shape to open a palette of shapes, just like the ones you learned to work with in Chapter 10. Then click the desired shape to apply to the selected shape, as shown in figure 11.24. You can also access this from the right-click menu.
Each shape is individually configurable. If you simply select the entire diagram, the Change Shape button is not available; you must select each shape you want to change. Hold down the Shift key as you click on each one to be selected.
SmartArt diagrams work only within Office applications, but you can easily export one for use in any other application. It is exported as a graphic (by default a .png file), which you can then import into any application that accepts graphics. To save a diagram as a picture, follow these steps:
Select the outer frame of the SmartArt graphic object.
Right-click the frame and choose Save as Picture. The Save as Picture dialog box opens.
(Optional) Open the Save as Type list and select a different file type if desired.
Tip
PowerPoint can save graphics in GIF, JPEG, TIFF, PNG, BMP, WMF, and EMF formats. Different formats have different qualities and advantages. EMF and WMF can be ungrouped, but not the other formats. EMF does not result in a quality loss when resized, but most of the others do. JPG doesn't use a transparent background, but PNG does.
In this chapter, you learned how to create SmartArt diagrams. You learned how to select a diagram type, how to rearrange shapes in a diagram, how to apply formatting, and how to export diagrams as artwork you can use in other programs. You will probably find lots of creative uses for diagrams now that you know they're available!
In the next chapter, you learn how to incorporate clip art, both from Microsoft and from other sources. You find out how to organize an artwork library using the Clip Organizer and how to import your own clips.