
Chapter 3
Mastering SEO Tools and Reports
In This Chapter
- Getting started with conversion testing
- Getting to know page and site analysis tools
- Tracking conversions from multiple referral sources
- Seeing how your visitors travel through your site
In this chapter, we cover the nuts and bolts of conversion testing. We walk you through it, step by step, and hopefully demystify the process a little bit. We show you how to fix common conversion and usability problems, and we introduce you to some page and site analysis tools. Finally, we discuss how to use link analysis tools.
Getting Started with Conversion Testing
Say that you've gathered your data and done the proper analysis, and now you’ve decided that some things need to be changed on your website. Making major overhauls to your site requires A/B testing. A/B testing is testing the original version of the website (Version A) against the one you made the major changes to (Version B). The A/B test is a tool that tells you which changes have a better effect and to what degree.
We discuss A/B testing in Chapter 2 of this minibook, but in the following sections, we go a little more in-depth and tell you how to actually do an A/B test. Before we get started, here are some cardinal rules you need to keep in mind for running an A/B test:
- Change only one variable at a time, especially when A/B testing involves major changes to your site. If you change more than one variable at a time, you can't determine which variable is responsible for the change or to what degree. Systematic testing helps you isolate important variables.
- Divert enough traffic to your test page for a valid sample. The object of traffic diversion is to redirect a percentage of visitors through the page to which you made all those changes. Ideally, the percentage of traffic to be redirected can be easily changed without having to completely overhaul those pages.
- Get a visitors-per-page count from your web analytics tool. This ensures that you actually get the percentage of traffic you’re expecting moving through your site based on the number of changes tested. For instance, if you expect to run half through Version A and half through Version B, you should see nearly equal numbers of visitors to the first page in the process. If you’re running a three-way test (testing A/B/C pages), you should aim for a distribution of 33/33/34 percent of visitors running through each path.
- Look for significant differences. If you see a difference in the conversion rate for Version B, compared to Version A, you need to ensure this difference is significant (more than .5 percent) so that you can be certain it comes from the change you made to Version B. Smaller differences can be due to variations in your visitors or any other number of environmental factors. Keep running your test until all the changes can be attributed to the exact step that was tweaked, or until you are certain there was no change.
- Take the time to do a null test. A null test involves putting 50/50 traffic through two identical pages to be A/B tested. It’s basically doing a control test for your science experiment. In this case, you replicate Page A, calling this copy Page B. Then, without making any changes to Page B, you test your analytics and conversions through both A and B, which should be equal. A null test verifies that you get the same conversion and abandonment rates and that your measurement tools are set up correctly. If you are not getting close to the same rates for both pages (about .5 percent), something is wrong, and your data from the A/B test will be skewed. If this happens, check that you are sending visitors into the tests exactly the same way and that you are running enough visitors through the test. Depending on your traffic volume, you need to attain a reasonable sample, and this can take time. You must run a null test to make sure the data you get back from the actual A/B test is accurate.
- Run your test long enough to ensure results are real. It takes time to gather good, solid data from an A/B test. For example, you may see trends in the first few hours that reverse themselves later. You need a representative sample before you can assume that Version B is better than Version A or that Version A is better than Version B.
- Run segmentation tests. Segmenting (dividing into like groups) the subjects that you’re testing allows you to monitor their activities when they return to your site. This lets you target a group of visitors if it turns out that a good percentage of your B-page visitors (presuming that A/B test results favored B over A) return to the website within two months to make another purchase, especially if these were people who provided you with conversions.
 The upside of A/B testing is that if your proposed changes don't work, not all your visitors are subjected to the bad changes, only those whom you put through the B page. This is better than just making the change without testing and crossing your fingers. The downside is that A/B testing is a long, complicated process that takes knowledge, precision, and time.
Because conversions are critical to your business’s success, start up a program of A/B split testing before making final site changes. Test two different versions of your page when you're testing things like changes on a call-to-action landing page, one at a time. Table 3-1 shows the hypothetical results of such a test.
Table 3-1 Sample Results of an A/B Test
Page A (Original) |
Page B |
Page C | |
Percent of traffic received |
34% |
33% |
33% |
New sales generated |
200 |
220 |
150 |
Percentage of change |
N/A |
10% |
–25% |
Getting ready to run a conversion test
You can use any of several different tools to run a test on pages of your website and compare which variation sees better conversions. Google Analytics has a feature for running A/B tests and multivariate tests (which are like an A/B test except that they test smaller details, like a different font color, instead of large changes, and you can test all variables at once with different permutations). In this section, we outline the broad steps you have to take before you run a test.
The first thing you need to do before running your test is to choose your test page. Not every single page needs to have a test run on it: You probably don't care about conversions from your About Us page, for example. To be a good candidate for testing, the page needs to offer an action the user can take, like purchasing, downloading, or signing up for something. The action can be as simple as a link that you want your users to click on — the point is that it has to be a measureable response.
For your first test, choose a landing page (the page that visitors first land on when they arrive at your website) that receives high volumes of traffic, like the top of a category or a pay per click (PPC) landing page. This lets you see meaningful results quickly.
The second step is choosing the objective of the test (or experiment, as it’s called in the Content Experiments tool in Google Analytics that we walk you through in detail later in this chapter). Your objective is what you want to get out of the experiment, ranging from more conversions to fewer bounces, more pages viewed, and longer time spent on your site. If your test page is a conversion page, a page on which an action occurs that you want the user to take on your website, be it the aforementioned purchase, download, or sign-up, your objective for the test will most likely be more conversions.
 When you're doing further, more in-depth testing, choose the conversion or user behavior you wish to track in order to measure the success of your test page. Remember, these tests are to figure out whether the changes you’ve made are successful from a user standpoint. And although the testing process is called conversion testing, you can also test for improvements to your visitors’ behaviors, like staying on a page or the site as a whole longer.
The third step is to figure out which kind of test you want to run. Content Experiments, a free tool within Google Analytics that we cover in the following section, allows you to run an A/B or multivariate test. Depending on what kind of changes to your site you want to make, you can choose to run either an A/B test between two pages (for the big changes) or a multivariate test between many pages (for the small ones).
A/B tests compare the performance of two entirely different pages, which means trying out entirely different layouts, moving around sections of the page, or changing the overall look and feel of a page. A/B tests are simpler to run, and you can obtain results must faster.
Multivariate tests allow you to test content variations in different sections of your page simultaneously. So, instead of tracking one or two big changes, you can test two different headlines, three different images, and two different product descriptions. Obtaining results from these kinds of tests takes longer, but they’re more flexible than A/B tests.
The fourth step is choosing the content you want to test. Within Content Experiments, you can use up to ten variations of your original page. For a multivariate test, for example, you might test the headline and an image to go with it. For an A/B test, you indicate your original page and your test page, as shown in Figure 3-1. The differences between your original page and test page in an A/B test can be on just about anything, such as which offer brings in more conversions: free phones or free kittens.
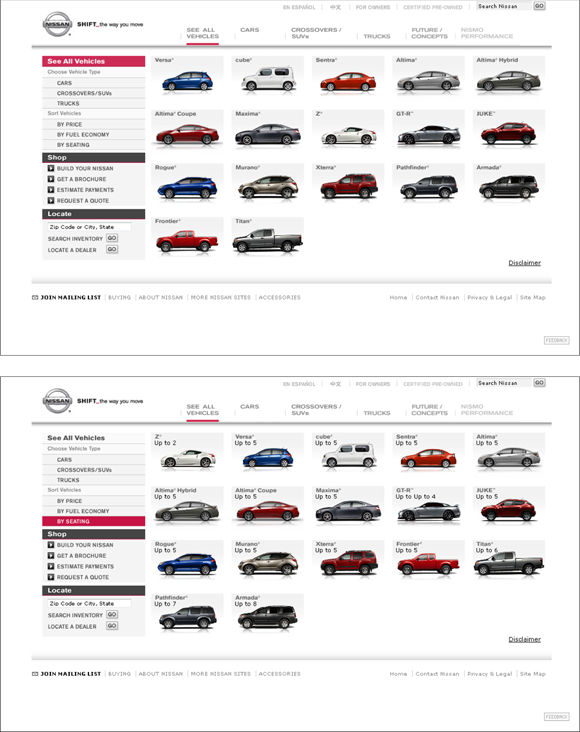
Figure 3-1: For an A/B test, you run Version A (top) against Version B (bottom) to see which performs better.
The fifth step is creating the actual content variations you want to test. For a multivariate test, for example, you could try a heading in a new font and test out some new wording and perhaps a different image as well (see Figure 3-2). Smaller changes like this should be tested with a multivariate test, not an A/B test, because you get better results.

Figure 3-2: Multivariate tests use multiple variables on the same page.
For the A/B test, you need a Page A (your control page) and a Page B (the test page that has significant changes).
During the experiment, your visitors see either your control page (A) or your test page (B). This way, you can test whether variations in the page lead to more conversions. Do people react differently with different images or text? Or does rearranging your site differently lead to easier access for your users and more conversions for you?
The variations need to be significantly different than the original content. For example, you won’t see much change if your headline changes from “Welcome!” to “Come on in!” Someone brand new to your page should be able to tell at a glance what's different about the page. Subtlety has no place in an A/B test.
The last step is deciding how much traffic you want for your test, the minimum length of time you want to run the experiment, and the confidence level you’re comfortable with (Content Experiments lets you set this between 95 percent and 99.5 percent). You are running this test on your actual website, so you might not want to lose a whole lot of your site traffic. You can actually choose to limit what percent of your visitors see the new version of your page. But keep in mind that if you limit the amount of traffic to the test page, you'll have to wait a lot longer to get any sort of meaningful results from this test. We recommend running your test for at least a month to get any kind of decent results, and it may take even longer than that. Don't quit too soon and make a judgment based on early numbers.
Testing with Content Experiments
Content Experiments is a free tool that’s included within Google Analytics (available at www.google.com/analytics/) that runs A/B and multivariate tests. We walk you through using this tool because it’s quick, accurate, and free.
Set up your experiment
To start the testing process with Google Analytics Content Experiments, you need to first make sure that the Google Analytics tracking code is installed on all pages you’re using in the test (see Chapter 1 of this minibook for these instructions). Then you need to do the following:
Sign in to your Google Analytics account and select the site you’re working on.
Click the Reporting tab, and then select Behavior and then Experiments from the left-hand menu.
Click the Create Experiment button at the top of the page.
The Experiments list page, which displays a summary of all your experiments, appears. If this is your first experiment, your list is empty, as shown in Figure 3-3.
The Create a New Experiment screen appears (see Figure 3-4).
- Name the experiment and select an objective along with the percentage of your traffic to serve the experiment.
- Click Advanced Options to set the minimum length of time the experiment should run and your confidence threshold (your choices are 95, 99, or 99.5 percent confidence). Then click Next Step.
On the next screen that appears, enter the URLs of your original page and test variation page.
If you’re testing multiple variations of the page, click +Add Variation and enter another URL. You see a preview of each page, as shown in Figure 3-5. When you’ve finished adding up to ten test variations, click Next Step.
Choose to add the Content Experiments code to your website.
Select Manually Insert the Code if you’re comfortable with copying and pasting some code in the Head section of the original page and all variation pages. If you have a webmaster to do that kind of thing for you, tell Content Experiments to send that code to your webmaster by clicking the Send the Code to Webmaster button and providing your webmaster’s email address.
After the code has been added to the pages being tested, click Next Step.
Content Experiments validates that everything is set up right.
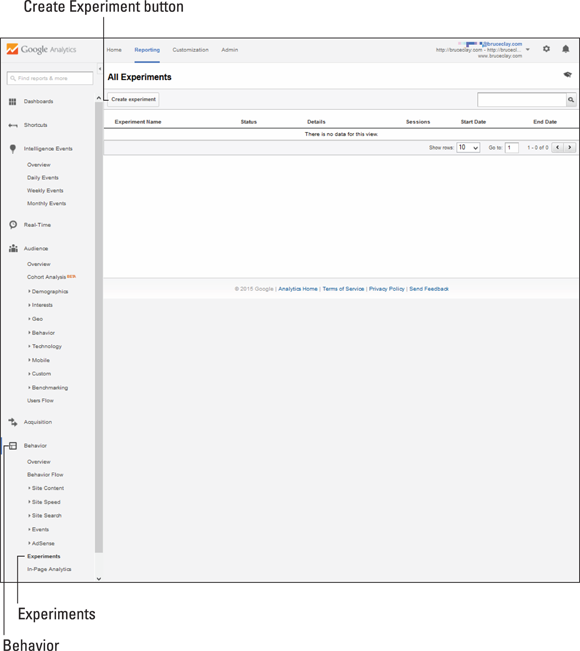
Figure 3-3: Click “Create experiment” to proceed with setting up your test.
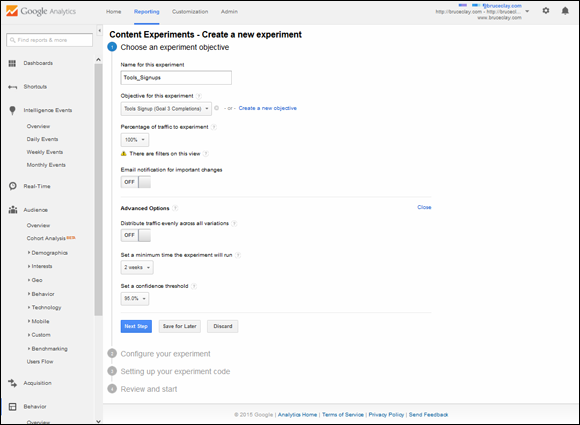
Figure 3-4: Use the Content Experiments Wizard to start running a test on your site.
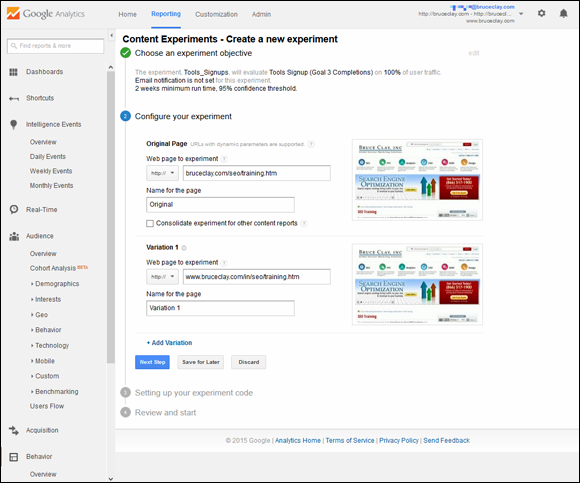
Figure 3-5: Enter the URLs of your original page and up to ten test pages.
Review and start the experiment
After you’ve created your variations and tagged your pages, relax: The hard part’s over. All you need to do now is turn the experiment on by clicking the Start Experiment button at the end of the Setup Wizard. But be warned: After you start running the experiment, you can’t change any of the variables, so make sure that everything is as you want it to be before you start.
If you do find a problem, all you need to do is return to the experiment from the list page, and then click edit for any step in the wizard. But if you change the page URLs at this point, you have to go through and reinstall the code on the new pages and revalidate everything.
Before you click Start Experiment, you get one last chance to preview the alternate page variations that are displayed to visitors during the experiment. If anything needs to be changed, click edit to change the names, objectives, or page URLs.
Ready, set, go!
After you click Start Experiment, you are sent back to the Experiments list page.
You also see an additional section on the page describing the progress of this experiment, including the status, number of impressions, and start and end dates of the experiment. Your test page starts showing different variations immediately, but a delay of about an hour takes place before your reports start displaying data. The progress and duration of the experiment depends on how much traffic goes through your test and conversion pages.
After you’ve got some significant data, the reports have preliminary results ready for you. Click the experiment from the list to see the experiment’s results.
Viewing your results
Be sure to check that visits and conversions are being recorded soon after starting your experiment. If you're not getting any visits or conversions, check the troubleshooting guide for some suggestions on what might be causing this error. Sometimes errors occur that don’t show up until the experiment is actually running.
Hold off on checking your reports right away. Until a minimum amount of data has been collected, you get a message along the lines of Hold on There, Cowboy, We Don’t Have a Complete Report Yet. (Well, okay, not literally, but you get the idea.) Check back in a day or two in order to see your results start coming in. With any test, you want to wait long enough to gather enough data for it to be meaningful. When you have enough data, you can check your reports, which look something like Figure 3-6.
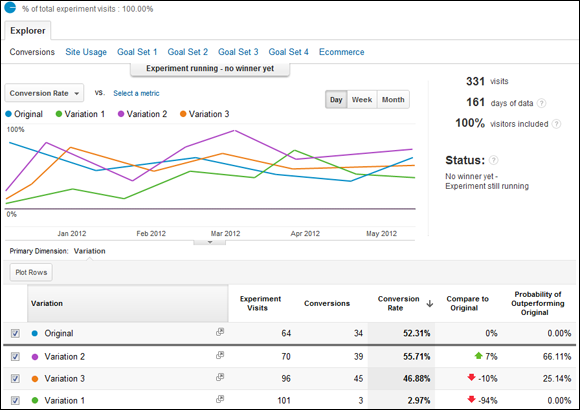
Figure 3-6: Reporting from Content Experiments provides the conversion rate of the original page and variations and predicts which is likely to perform best through the course of the test.
Google Analytics support explains how to read results at https://support.google.com/analytics/answer/1745152. The report tells you:
- Experiment status: If an experiment is in progress, the status reads that you have no winner yet. If enough data has been gathered to meet the level of confidence you set at the outset of the test, a winner is announced.
- Conversions and visits: This is the number of conversions and visits a particular page generated.
- Improvement: The Compare to Original column displays the difference (positive or negative) between the conversion rate of the variation and the original.
- Probability of outperforming original: While the experiment is in progress, this column displays the probability that a combination will be more successful than the original version based on the results so far. The higher the percentage, the better the test page is doing.
With enough time and data, Content Experiments identifies the winning variation. It’s all a matter of how long you run the experiment and how similar the variations are. If you’ve run the experiment for a long time and still don’t have a clear winner, your variations might be too similar to get correct data, so you may need to make some tweaks and run another experiment.
To stop the experiment at any time, click the Stop Experiment button on the Experiment page.
Discovering Page and Site Analysis Tools
Without wisdom, data is just numbers. To use the powerful analytics tools at your disposal, you first need to know what you want your website visitors to do. This can be anything from purchasing products to signing up for a newsletter or just getting more traffic to your website. After you know what you are measuring, you can view how well you’re doing in your analytics software.
Google Analytics is the free analytics package that we recommend using to see how your visitors are coming to your site and what they’re doing after they get there. With Google Analytics, you can segment your view of visitors by where they came from; those segments are paid and organic Google search results, social networks, and other special campaigns that the website owner may define. To see your organic search traffic from both Bing and Yahoo, you look to the analytics reporting that’s part of the free Bing Webmaster Tools. You can see your paid search traffic from the combined Yahoo and Bing ad networks in Bing Ads Reporting.
Viewing performance of paid search campaigns
When you run a pay per click (PPC) campaign, you spend money whenever potential clients click your advertisement. Because you’re spending money, you want to know how much money or value you’re getting back for that campaign. That’s where PPC conversion reports come in.
PPC conversion reports tell you things like how many people are buying products. They can also be configured to tell you how much money you made from selling products to people who came from a PPC advertisement. For example, in Google Analytics, you can link your AdWords account, receive reports about your paid search campaigns, and find the information shown in Figure 3-7. For Bing Ads, analytics reporting is provided in Bing Ads Reporting (https://secure.bingads.microsoft.com/).
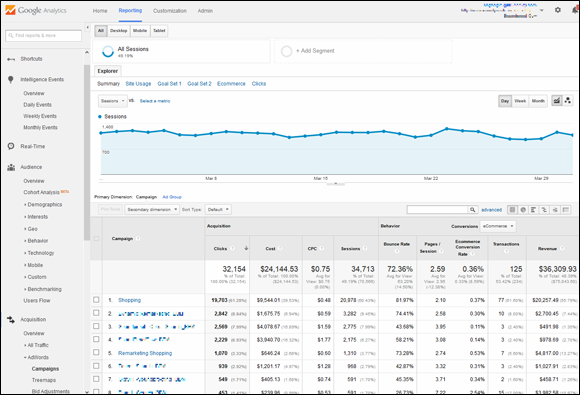
Figure 3-7: Google Analytics is a source of performance data about your AdWords campaigns.
You need to tell Google AdWords and Bing Ads what your conversions are in order to get an accounting of conversions by visitors from search ad clicks. Read about setting up goals in AdWords in the Google support article at https://support.google.com/adwords/answer/1722036. Creating and tracking goals for Bing Ads is explained in this support article at https://advertise.bingads.microsoft.com/en-uk/cl/256/training/campaign-analytics.
You can drill down from your campaigns to your ad groups to your keywords, seeing the number of clicks an ad received, your ad's click-through rate (CTR), how much your cost-per-click (CPC) was, your conversion rate, and how much you made from that advertisement, reported as revenue.
With these types of reports, you can analyze your spending and your revenue based on PPC ads. This information helps you decide which keywords, advertisements, and campaigns are working the best for you and which ones are not working so well. With this information, you can optimize your PPC campaigns by limiting your spending and maximizing your revenue based on the spending constraint.
Measuring traffic and conversion from organic search
Measuring how much of your traffic and conversion is from organic (non-paid) search is important because it tells you how much traffic and money you are getting for your SEO efforts. Every SEO campaign costs you time and money, so you want to know what you’re getting back for it. Most analytics software packages come with an out-of-the-box report for getting traffic from organic search. Figure 3-8 is from Google Analytics.
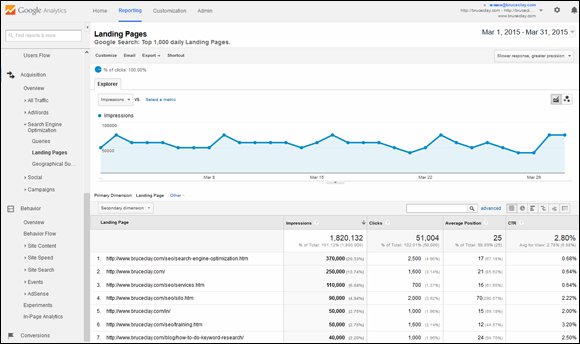
Figure 3-8: This graph from Google Analytics shows the pages on the site that received the most visitors from Google organic search.
Figure 3-9 shows a similar report from Bing Webmaster Tools. The graph shows the number of clicks from a Bing organic search that a site received. Below that, you can see a list of top pages receiving organic search traffic and the keywords the search visitors queried to see your site on a Bing search results page.
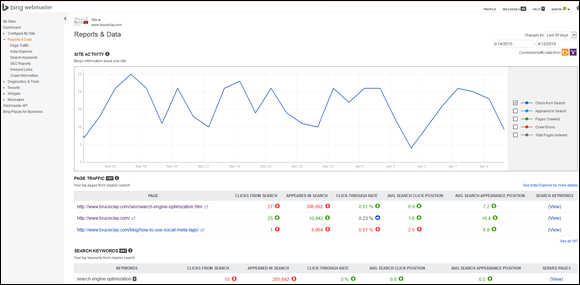
Figure 3-9: Bing Webmaster Tools reports site activity, page traffic, and search keywords from a Bing and Yahoo organic search.
Defining goals in Google Analytics
To get the most out of Google Analytics, define your conversions, called Goals in this analytics suite. You can choose from among four Goal types in Google Analytics:
- Destination: Triggers when a specific page loads because a goal action was completed, like a thank-you page
- Duration: Counted when a user is on the site for a specified amount of time or longer
- Pages or screens per session: Happens when a user views a specified number of pages or screens
- Event: Triggers when a defined action takes place, such as when a video is played or a specified link is clicked
Think of all the objectives you have for your website, and set up goals to track your visitors’ completion of those objectives. If yours is an e-commerce site, set a Destination Goal linked to the thank-you page that shows up after a purchase is made. If a white paper download is a goal, set an Event Goal to trigger when the Download button is clicked. You have the option of assigning a monetary value to your goals, and if you do, Google Analytics reports dollar amounts attributed to traffic from different segments. With Goals defined, you can measure the value of paid and organic search and social media marketing efforts. For more on creating and managing Goals in Google Analytics, review the Google Support article here: https://support.google.com/analytics/answer/1012040.
Viewing traffic from social networks
Another visitor segment that you can home in on through Google Analytics (GA) is traffic from social media. Social media refers to any sort of online environment that allows social interaction, including blogs, social news sites such as Reddit (www.Reddit.com) and Digg (www.Digg.com), social networking sites such as Facebook (www.facebook.com), Twitter (https://twitter.com), and Google+ (plus.google.com). In Book VI, Chapter 5 you learn about building a community and brand awareness through content shared on social media. With the social reports in Google Analytic, you can see what pages shared in social media brought visitors to your site. If you’ve set up Goals in GA, you can even see whether these visitors converted (took any action you want visitors to take).
Figure 3-10 shows the social network referrals reported in Google Analytics. You can reach this report by going to Acquisition and then Social in the left navigation. Social networks bringing traffic to the site are listed in order of most pages viewed.
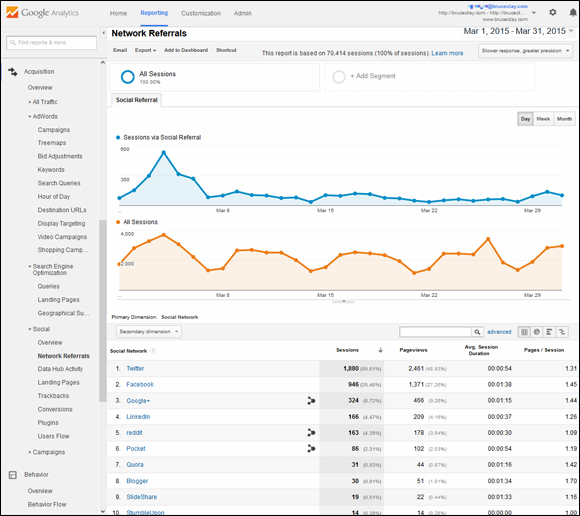
Figure 3-10: Twitter, Facebook, Google+, and LinkedIn are the biggest social networks and typically drive the most traffic from social media.
Seeing Visitor Paths through the Site
Now you know where visitors are coming from and whether a visitor converts. The final piece you can get from analytics is seeing how a visitor navigated through your site to wind up at her final destination. This helps you determine whether people are just searching through your site until they get something they are looking for or whether they are following a predetermined path that gets them to something you want them to get at.
Google Analytics shows you the path of visitors through your site, a report that you can slice and dice a number of ways. The example in Figure 3-11 is the flow of visitors who entered a site through a social network. In this flow chart, you can see the most popular paths taken by visitors who landed on the site from a social network, with the flow from Twitter highlighted.
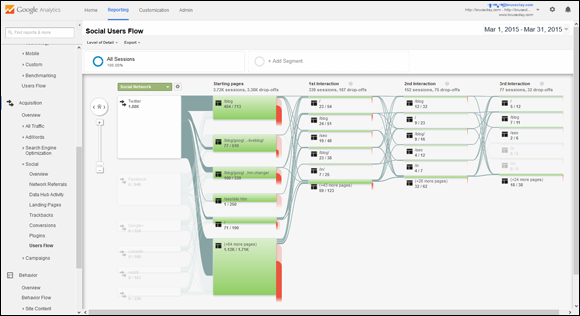
Figure 3-11: Behavior Flow reports in Google Analytics allow you to track popular paths on your site.
Go to Behavior and then Behavior Flow in Google Analytics’ left navigation. The default view is the flow of visitors starting at the landing page they entered on. You can also view paths by these dimensions:
- Acquisition source (traffic type)
- Advertising (by ad content, ad group, ad campaign and ad keyword)
- Behavior (by defined Goals)
- Social referrals
- Users (by browser, location, language, device, and many more subdimensions)
Get more on path reports, including how to set up advanced custom dimensions, in Google Analytics support: https://support.google.com/analytics/answer/2519989.
Understanding Abandonment Rates
On the flip side of knowing how users travel through your site after they get there is learning when and from where they leave. Abandonment rates can be broken up into two categories: how soon the visitors left your site and what page they were on when they left your site. These both have different meanings, and understanding what they mean is important.
When visitors leave your site, you naturally want to know why. When a visitor leaves after visiting a lot of pages or going through a process on your website, that is when you want to know which page he left from. If he leaves the site on the first page of his visit, the visitor is probably not satisfied with your site at that time. Reasons for his exit can range from the site’s not answering a specific need of the user to a bad design that just makes the visitor want to leave. Another reason is that the visitor came to your site for only one thing, found it, and then left — which is often the case with a blog. The percentage of visitors who leave after looking at only one page is called the bounce rate.
An exit page is the last page the visitor was on before she left the site. Most users leave because they have not found what they were looking for, or they find your site hard to use and think they can find a better alternative. Note that in most cases, the exit page that the most visitors leave from is usually the page that contributes most to your bounce rate.
Both types of reports can be found in almost every analytics suite. Figure 3-12 shows an example of a Content Drilldown report in Google Analytics. The line graph has been set to the Bounce Rate metric and shows how often a visitor leaves after viewing only one page. In the table below the graph, you can see the bounce rate and exit rate of the pages listed. Examining these metrics on a page-by-page level can help you strengthen the weak points in your conversion funnel.
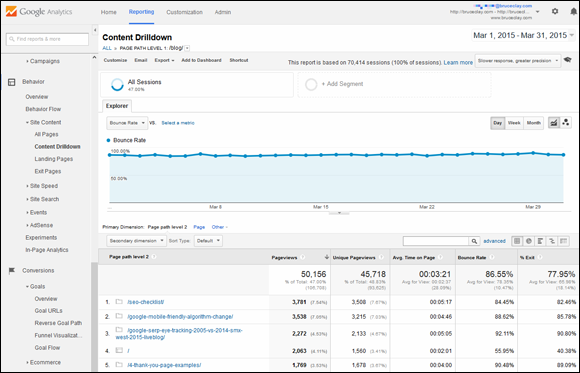
Figure 3-12: Knowing your bounce rate and exit rate can help you fine-tune your conversion funnel.