
At the end of Sprint Planning, after the team has broken down User Stories into tasks, the Scrum Master totals up the number of tasks in the Sprint Backlog. The Scrum Master then creates a Burndown chart.
The following diagram shows a Burndown for a Sprint already in progress:
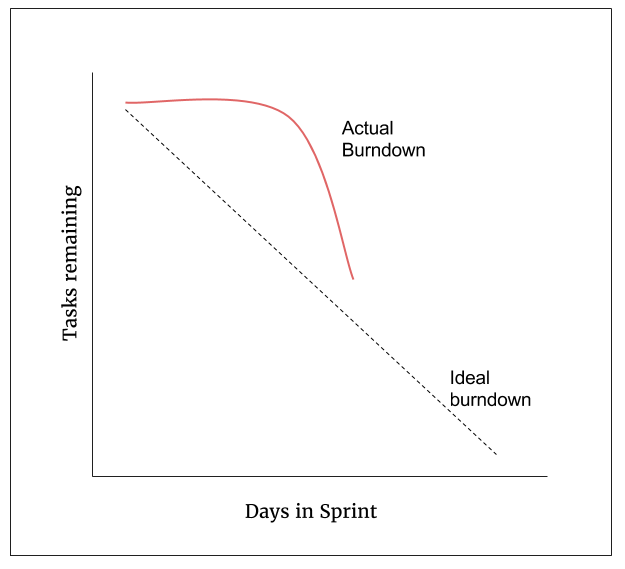
The y-axis represents the total number of tasks. The x-axis represents the number of days in the Sprint.
The red line on the following Sprint Burndown chart represents the number of tasks left to complete.
The dotted line represents the Ideal Burndown rate in order to complete all tasks by the end of the Sprint; as you can see in the preceding figure, the red line (the Actual Burndown) hasn't decreased in the way we expected.
In this case, the Actual Burndown shows that new tasks were discovered when the team began working on a User Story, and so the total number of tasks has increased. It is not unusual to uncover new information once work commences.