
1. What Do We Talk About When We Talk About Analytics?
Thomas H. Davenport
Every decade or so, the business world invents another term for how it extracts managerial and decision-making value from computerized data. In the 1970s the favored term was decision support systems, accurately reflecting the importance of a decision-centered approach to data analysis. In the early ’80s, executive information systems was the preferred nomenclature, which addressed the use of these systems by senior managers. Later in that decade, emphasis shifted to the more technical-sounding online analytical processing (OLAP). The ’90s saw the rise of business intelligence as a descriptor.
Each of these terms has its virtues and its ambiguities. No supreme being has provided us with a clear, concise definition of what anything should be called, so we mortals will continue to wrestle with appropriate terminology. It appears, however, that another shift is taking place in the label for how we take advantage of data to make better decisions and manage organizations. The new label is analytics, which began to come into favor in the middle of this century’s first decade—at least for the more statistical and mathematical forms of data analysis.
Jeanne Harris, my coauthor on the 2007 book Competing on Analytics, and I defined analytics as “the extensive use of data, statistical and quantitative analysis, explanatory and predictive models, and fact-based management to drive decisions and actions.” I still like that definition, although now I would have to admit that they are still analytics even if they don’t drive decisions and actions. If a tree falls in the woods and nobody chops it up for firewood, it’s still a tree.
Of course, no term stays static after it is introduced into the marketplace. It evolves and accretes new meanings over time. Particularly if it is a popular term, technology vendors claim that their product or service is at least a piece of the term, and they often represent it as being squarely in the center of the term’s definition. That is certainly the case with analytics. The term also has many commonly used variations:
• Predictive analytics
• Data mining
• Business analytics
• Web analytics
• Big-data analytics
I’ll attempt to shed more light on how the term analytics has evolved and the meanings of some of the key variations as well. Before doing that, however, I should remind you that analytics aren’t a new idea, and they don’t have to be tied up with analytical technology. The first writing on statistics was arguably by Al-Kindi, an Arab philosopher from the 9th century. It is believed that he possessed rather primitive computing tools. Even today, theoretically, analytics could be carried out using paper, pencil, and perhaps a slide rule, but it would be foolish not to employ computers and software. If you own a copy of Microsoft Excel, for example, you have the ability to do fairly sophisticated statistical analyses on lots of data. And today the vendors of analytical software range from open-source statistics-oriented programming languages (R, Julia) to specialized analytics firms (Minitab, Stata, and the much-larger firm SAS) to IT giants such as IBM, SAP, and Oracle. Because they involve data and computers, analytics also require good information management capabilities to clean, integrate, extract, transform, and access data. It might be tempting, then, to simply equate analytics with analytical information technology. But this would be a mistake, since it’s the human and organizational aspects of analytics that are often most difficult and truly differentiating.
Why We Needed a New Term: Issues with Traditional Business Intelligence
Business intelligence (BI) used to be primarily about generating standard reports or answering queries, although many viewed it as incorporating more analytical activities as well. Today it has come to stand for a variety of diverse activities. The Wikipedia definition of BI (as of April 10, 2012), for example, is rather extended:
Business intelligence (BI) mainly refers to computer-based techniques used in identifying, extracting, and analyzing business data, such as sales revenue by products and/or departments, or by associated costs and incomes.
BI technologies provide historical, current and predictive views of business operations. Common functions of business intelligence technologies are reporting, online analytical processing, analytics, data mining, process mining, complex event processing, business performance management, benchmarking, text mining and predictive analytics.
Business intelligence aims to support better business decision-making. Thus a BI system can be called a decision support system (DSS). Though the term business intelligence is sometimes used as a synonym for competitive intelligence, because they both support decision making, BI uses technologies, processes, and applications to analyze mostly internal, structured data and business processes while competitive intelligence gathers, analyzes and disseminates information with a topical focus on company competitors. Business intelligence understood broadly can include the subset of competitive intelligence.
You know there is a problem when a definition requires that much verbiage! BI has always had its issues as a term. While surely preferable to “business stupidity,” it lacked precision as to what activities were included. One business school faculty colleague of mine suggested that it was highly presumptuous for the IT field to claim “business intelligence” as its own. Aren’t all business activities supposed to add intelligence? And how does business intelligence relate to such fields as competitive intelligence (which is described as a subset of business intelligence in the Wikipedia definition, but tends not to involve much quantified data at all) and customer intelligence?
The problems of BI multiplied when the term analytics began to gain favor around the middle of the last decade. There was much confusion about the difference between these two terms. The CEO of a software vendor in this category told me he thought that analytics was a subset of business intelligence. Another CEO in the same industry argued that BI was a subset of analytics. Obviously neither term is entirely clear if each can be a subset of the other in educated executives’ minds.
There is little doubt, however, that analytics have become a more contemporary synonym for business intelligence, but with a more quantitatively sophisticated slant. The reporting-oriented activities that primarily characterized BI are now considered a part of analytics by many people and organizations. However, it’s fair to say that every form of analytics is in some sense a struggle between the reporting-centric activities common in business intelligence and the more sophisticated analytical approaches involving statistics and mathematical models of data. Therefore, it’s important to be clear about the different types of activities that are possible under the banner of “analytics.”
Three Types of Analytics
If the term analytics is to retain any real meaning with so much evolution in the term, we probably require some subdefinitions of analytics. For example, if we include the various forms of reporting—standard or ad hoc reports, queries, scorecards, alerts—in analytics, perhaps they should be called descriptive analytics (see Figure 1.1). They simply describe what has happened in the past. Descriptive analytics may also be used to classify customers or other business entities into groups that are similar on certain dimensions.
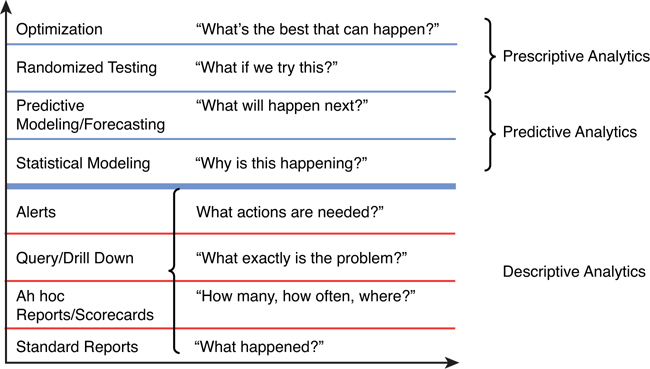
Figure 1.1. Three types of business analytics.
It would be difficult to argue that understanding what has happened is not a good thing for organizations to do. What could be objectionable about it? Nothing, really, except that there are more sophisticated ways of using data to understand a business. Your statistics textbook didn’t end with means, medians, and modes, and you can go beyond descriptive analytics. The numbers from descriptive analytics don’t tell you anything about the future, they don’t tell you anything about what the numbers should be, and they usually don’t tell you much about why they are what they are.
Predictive analytics use models of the past to predict the future. They typically use multiple variables to predict a particular dependent variable. Examples include using various measures of growing season rainfall and temperatures to predict the price of Bordeaux wine, or using variables about your credit history to predict the likelihood that you will repay loans in the future. Predictive analytics models are very popular in predicting the behavior of customers based on past buying history and perhaps some demographic variables.
Note that incorporated into the predictive analytics category in Figure 1.1 is statistical modeling. Technically this type of analysis is still about explaining—rather than predicting—what happens in an organization. However, it is a necessary step in predictive analytics. You can’t project a model into the future unless you start with a good model fitting past data. Once you do have a model, you can plug in various estimates of what your independent variables might be and come out with a prediction for your dependent variable.
Prescriptive analytics are less widely known, but I refer to them as prescriptive because, in effect, they tell you what to do. Randomized testing, in which a test group is compared to a control group with random assignment of subjects to each group, is a powerful method to establish cause. If you compare the two groups and find that one is better than the other with statistical significance, you should do the thing that’s being tested in the test group.
Optimization is another form of prescriptive analytics. It tells you, based on a statistical model, what the optimum level of key variables is if you want to maximize a particular outcome variable. If you want to maximize your profitability, for example, pricing optimization tells you what price to charge for your products and services.
Each of these three types of analytics is valuable, but in most organizations, descriptive analytics dominate in terms of frequency of use. Reporting tools are widely available and easy to understand. Managers often demand them, as do external regulatory bodies. Therefore, they tend to become so common that they drive out more sophisticated analytics. Companies that want to emphasize predictive and prescriptive analytics sometimes have to control the demand and supply for descriptive analytics. One way to do this is by encouraging managers to do their own query and reporting work, rather than have quantitative analysts do it for them.
Where Does Data Mining Fit In?
Data mining can fit into any of the three categories just described, but it most commonly involves statistical and predictive models—predictive analytics in Figure 1.1. The Wikipedia definition (as of April 12, 2012) starts with the following:
Data mining (the analysis step of the knowledge discovery in databases process, or KDD), a relatively young and interdisciplinary field of computer science, is the process of discovering new patterns from large data sets involving methods at the intersection of artificial intelligence, machine learning, statistics and database systems.
As this definition suggests, data mining implies a discovery of trends and patterns in data—not by humans, but by the computer itself. Artificial intelligence (notably, neural networks) and machine learning approaches rely on computers and software to try a variety of models to fit the data and determine the optimal model. Traditional analytics rely on a human analyst to generate a hypothesis and test it with a model.
Data mining implies a lesser need for smart humans, but this is not the case in the companies I have studied. In fact, every company I have seen with an aggressive data mining initiative also has a large complement of sophisticated quantitative people. It is true that machine learning can increase the productivity of those smart humans, but they are still necessary to configure the machine learning programs, tune them, and interpret the results. In big data environments, machine learning is often necessary to create models for the vast and continuing amount of data; human analysts using hypothesis-driven analytics alone just can’t keep up.
Business Analytics Versus Other Types
Over the past several years, the term business analytics has become popular. It merely means using analytics in business to improve business performance and better satisfy customers.
Analytics are also being applied in other nonbusiness sectors, such as health care and life sciences, education, and government. Some of these areas have particular names for their approaches to analytics. In health care, for example, the use of the term health care analytics is growing in popularity, and you also are likely to hear informatics and clinical decision support used as synonyms.
Each industry and sector has its own orientations to analytics. Even what is called “health care analytics” or “clinical decision support” in health care is somewhat dissimilar to analytics in other industries. It is likely, for example, that the primary method for supporting decisions in health care will be a series of if/then rules, rather than statistical models or algorithms—although there is slow movement toward more quantitative data.
Web Analytics
Web analytics is about analyzing online activity on websites and in web applications. Perhaps obviously, it is one of the newer analytical disciplines. And perhaps because of its youth, it is relatively immature and rapidly changing. For most organizations, web analytics is really web reporting—counting how many unique visitors have come to the site, how many pages they have viewed, how long they have stayed. Knowing these details is certainly valuable, but at some point perhaps web analytics will commonly employ more sophisticated analyses. As Brent Dykes puts it in the fun book Web Analytics Action Hero, if all you do is count things, you will forever be stuck in “Setupland” as opposed to becoming an action hero.
The great exception to the web analytics = web reporting equation is the use of prescriptive analytics in the form of randomized testing, often called A/B testing in web analytics. This involves testing two different versions of a web page, typically to learn which receives more traffic. Customers or users of the website need not even know they are participating in a test. More sophisticated testing is sometimes done using multiple variables and even testing across multiple channels (a website plus a print ad, for example).
Highly analytical companies such as Google and eBay typically run hundreds or thousands of tests at once. They have millions of customers, so it is relatively easy to create test and control groups and serve them different pages. eBay has an advanced testing platform that makes it easy for different groups within the company to run and interpret tests. However, there is still the issue of ensuring that the same customer is not participating in too many tests—participating in one test may confound the results from another—and determining for how long the learnings from a test remain relevant.
Big-Data Analytics
The newest forms of analytics are related to big data. This term usually refers to data that is either too big, too unstructured, or from too many different sources to be manageable through traditional databases. It is often encountered in online environments such as text, images, and video on websites. Scientific data, such as genomic data in biology, also usually falls into the big-data category in terms of both volume and (lack of) structure.
As Bill Franks of Teradata pointed out in an IIA blog post, “the fact is that virtually no analytics directly analyze unstructured data. Unstructured data may be an input to an analytic process, but when it comes time to do any actual analysis, the unstructured data itself isn’t utilized.” He goes on to say that in almost all cases, unstructured data—text, images, whatever—needs to be converted into structured and usually quantitative data before it is analyzed. That’s what increasingly popular tools such as Hadoop and MapReduce do—“preprocess” data in various ways to turn it into structured, quantitative data that can be analyzed. For example, a company might be interested in understanding online consumer sentiment about the company or its brands. They might take text from blog posts, Twitter tweets, and discussion boards that mention the company as the input to an analysis. But before it can be analyzed, they need to classify the language in the text as either positive, negative, or neutral. The analysis typically just averages the resulting numbers (typically 1, 0, or –1).
Unfortunately, that relatively simple level of analysis is all too common in big-data analytics. The data management work needed to wrestle big data into shape for analysis is often quite sophisticated and demanding. But, as in web analytics, the actual analysis techniques used on the data are often underwhelming. There is a lot of counting and reporting of categories, as well as visual representations of those counts and reports. There is very little predictive or prescriptive analytics performed on big data.
Perhaps this will change over time as the data management activities around big data become more routine and less labor-intensive. Certainly many of the “data scientists” who work with big data have highly quantitative backgrounds. PhDs in scientific or mathematics/statistics abound in this job category. These people presumably would be capable of much more sophisticated analyses. But at the moment their analytical skills are being tested far less than their data management skills.
Conclusion
What’s in a name? Using the term analytics instead of prior terms may help inspire organizations to use more sophisticated mathematical and statistical decision tools for business problem-solving and competitive advantage. Just as the term supply chain management created a sense of process and interdependence that was not conveyed by “shipping,” a new term for the widespread analysis of data for decision-making purposes may assist in transforming that function. We live in a world in which many amazing feats of data manipulation and algorithmic transformation are possible. The name for these activities might as well reflect their power and potential.
One risk with the field of analytics, however, is that too much gets wrapped into the name. If analytics becomes totally synonymous with business intelligence or decision support—and the great majority of the activities underneath the term involve simple counting and reporting—the term, and the field it describes, will lose a lot of its power. Organizations wanting to ensure that analytics is more than just reporting should be sure to discriminate among the different types of analytics in the terminology they employ.