
9. Product Life Cycle Analysis
Description and Purpose
Product life cycle (PLC) analysis describes how sales of a product evolve as a function of time. This model states that, similar to all living organisms, products pass through four stages during their life: introduction, growth, maturity, and decline. Taken together, these four stages provide a framework that recommends specific marketing strategies for each PLC stage to maximize profitability over the product’s lifetime.
The PLC theory has been around for decades. It is generally attributed to the work of Joel Dean, who wrote about the concept in a 1950 article in the Harvard Business Review titled “Pricing policies for new products.”1
The product life cycle provides an invaluable perspective on the development of product and marketing strategies, because each phase of the life cycle has distinct characteristics that affect a firm’s operation. Different strategies are often required through each stage as customer attitudes and needs, the number of competitors, and market forces change and evolve through the course of the product’s life cycle.
The PLC when drawn looks like the bell-shaped logistics curve shown in Figures 9.1 and 9.2. The following sections describe the components of the PLC.

Figure 9.1. The classical product life cycle.

Figure 9.2. The product life cycle identifying sales, profits, and investment factors.
Stage 1: Introduction
Introduction refers to the development and market introduction of a new product. It is often accompanied by slow sales growth. Prior to introduction, the product may have been in a long period of development, and at introduction, the financial requirements to effectively roll it out can be extensive. When a product is first introduced into the market, it often meets initial resistance from consumers because they are unaware of its existence or they are unsure of its risks and benefits. Hence, only a small proportion of the potential market purchases the product.
Stage 2: Growth
Consumers become aware of the product and its benefits through heavy promotion by the pioneering firm(s). With increasing consumer acceptance, unit sales begin to grow. During this stage, product and brand differentiation begin as firms start to jockey for competitive advantage. As demand outstrips supply, leading indicators at the wholesale and production levels provide an incentive for more growth than is warranted by retail demand. Typically, sales and profits rise, competitors are attracted, and improved products or imitations enter the market. Eventually, this increased competition leads some of the firms to consider competing on price. This signals the onset of the maturity stage.
Stage 3: Maturity
The profit associated with the growth stage attracts many more competitors to the market. Market saturation soon ensues, resulting in a sales growth plateau as the majority of potential consumers have already purchased the product. Replacement purchases become the major factor driving subsequent sales. As the maturity stage unfolds, price competition intensifies, ever-finer distinctions between competitive product attributes are made, and promotion and advertising to niche segments within the product market rapidly develop.
Stage 4: Decline
In Stage 4, the industry structure becomes radically altered. Sales begin to rapidly drop from the plateau of the maturity stage as consumers start to buy newer and more innovative products. Over-capacity results in an industry shakeout. Industry concentration is precipitated by severe price competition, mergers and acquisitions, and bankruptcies. Sales continue to decline. The few remaining firms may then decide to take the product off the market. Last but not least, the possibility that the market might actually be impacted through disruptive innovation also suggests that the decline stage may actually serve as a launchpad for the sales of related new products.
These explanations for the shape and stages of the classic PLC curve were enhanced with various strategic prescriptions designed to optimally guide product managers to make better decisions through the various stages. Several generalized strategic prescriptions became routinely associated with each stage of the PLC. They are described in the following sections.
Introduction Strategies
Product life cycle theory prescribes a strategy of aggressive promotion during the introduction stage. Heavy investment is required to establish a market by educating consumers about the product’s existence and its relative benefits. The main message of marketing efforts should be directed toward convincing potential early adopters of the merits of the product compared to the status quo of existing products. Typically, PLC theory advocates a selective distribution strategy based on securing channels used by early adopters. Retail prices usually are set fairly high to recover the costs of product investment and development. A generalized manufacturing strategy is employed to defer heavy fixed-cost investments until a feasible market demand is justified.
Here are some potential strategies available to the organization at this stage of the PLC:
• Rapid skimming means launching the new product at a high price and with heavy promotion. This strategy attempts to accelerate the rate of market penetration. An example is the introduction of the Lexus automobile.
• Slow skimming means launching the product at a high price using low promotional activity, as with the Apple “i” products. Using this strategy may open the firm to greater potential competition.
• Rapid penetration means launching the product at a low price with heavy promotion. This strategy is often used with household consumer products.
• Slow penetration means launching the product at a low price with little promotion. This is typical when small businesses introduce products.
Growth Strategies
During the growth stage, the emphasis switches from a focus on early adopters to the entire market as more customers acquire the product. The marketing strategy now focuses on the firm’s proprietary branding attributes. Generally, the advertising emphasis is medium intensity, because sales growth normally challenges production capacity even in the absence of intensive advertising. Additionally, during the growth stage, the firm may consider switching its manufacturing strategy to a batch process to support the growing demand. With the increase in demand, most distribution channels will no longer need to be convinced to carry the product.
One of the most important strategic decisions to be made in the growth stage is pricing strategy. Essentially, the firm can pursue a skimming or penetration pricing policy. A skimming strategy involves setting an initially high price to capture the economic rents associated with first-mover advantage.
Alternatively, the firm may choose to implement a penetration pricing policy. The rationale for pursuing such a pricing policy is to underprice the competition to secure a larger market share in the long run as the PLC progresses. Penetration pricing strategy essentially defers profits until the maturity stage, when having the lowest cost structure in the market ensures high profitability. A penetration strategy assumes that the losses incurred during share building in the growth stage will be more than offset by profits in the maturity stage.
In summary, following acceptance by early innovators, conventional consumers start following their lead. New competitors are likely to now enter the market attracted by the opportunities for large-scale production and profit. New product features may appear as the market expands. Prices will remain steady or fall only slightly. Profit margins will peak as expenses are spread over a larger volume.
Strategies include the following:
• Improving quality and adding new features and/or models
• Sourcing new market segments
• Sourcing new distribution channels
• Shifting marketing strategy focus to increase demand
• Lowering prices to attract price-sensitive buyers
Maturity Strategies
During this stage, generalized PLC strategy reverts to holding market share as opposed to expansion. Pricing strategy is limited to setting prices according to the market’s willingness to pay. An important dimension of this stage is to avoid initiating a price war in which none of the participants emerges victorious. Price wars effectively transfer any available producer surplus to consumer surplus—an outcome that benefits none of the firms involved. It is equally important for the firm to recognize the onset of maturity so as to delay the entry of private-label competition into the product market by deterring price reductions. The ultimate pricing strategy in Stage 3 hinges on selecting a broad strategy for the product market. During the maturity stage, the primary strategic choice is whether to pursue a low-cost-based or differentiation strategy.
Promotional strategy focuses on the distribution channel offering heavy trade discounts to established retailers to protect valuable shelf space rather than attempting to expand distribution channels. Advertising expenditures are moderate and are developed to support brand differentiation. More intense during this stage are promotional strategies targeted at consumers to encourage rivals’ customers to switch brands. To support low costs and consequent margins, manufacturing strategy often switches to assembly-line processes to maximize the experience effects associated with higher volumes.
Many firms today operate in a mature market that also has three stages:
• Growth maturity, in which sales start to decline due to distribution saturation
• Stable maturity, in which sales remain level as the market gets saturated
• Decaying maturity, in which sales decline as consumers move to new products and services
As mentioned previously, a key feature of Stage 3 is overcapacity due to intensifying competition. Three main strategies can be used:
• Market modification involves looking for new markets and market segments to stimulate increased usage. This strategy may include repositioning the brand.
• Product modification addresses issues of product relaunch, quality improvement, additional product features, and/or style enhancements.
• Marketing mix modification involves reviewing several elements of the marketing mix, such as pricing, advertising, and distribution channels. The danger is that the competition would quickly imitate any step.
Decline Strategies
The PLC theory essentially offers two strategic choices for managing a product in the decline stage. The first is to exit the product market to stem financial losses in a rapidly declining market. The second is to extract as much cash flow as possible with minimal promotional investment. This involves a low pricing strategy to ensure that no unsold inventory is left over. Unprofitable distribution channels are systematically closed. Advertising, consumer incentive programs, and trade discounts are phased out. Some firms may choose to extend feasible production volumes by acquiring rival firms that want to exit the market. A common supporting manufacturing strategy in this scenario may be to switch to a continuous-flow process to achieve minimum cost structures. Eventually, product sales decline, resulting in the product’s ultimate removal from the market.
The key problem in this stage is the lack of systematic policies to manage declining products. Management’s attention has often shifted to new or mature products. The key actions to be reviewed in the decline stage are
• Identifying weak products
• Determining whether marketing strategies and opportunities are still available; this is called a milking strategy
• Deciding whether to abandon the product
The last action creates a great deal of angst and reluctance. Logic and good analysis play a key role as the premature acceptance of product decline often predisposes managers to focus more intensely on new products to the detriment of older, established brands. This fixation is fraught with at least two dangers. First, the introduction of new products is extremely resource-intensive. Second, the premature neglect of established brands essentially orphans the large investment and valuable consumer goodwill generated from previous brand-establishing campaigns.
Tables 9.1 and 9.2 summarize the key points about the PLC stages.
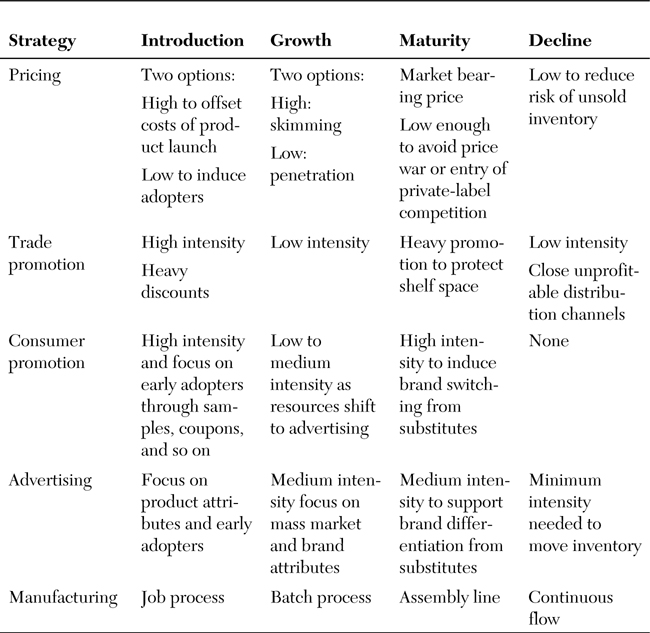
Source: Adapted from Rowe, A., Mason, R., and Dickel, K., Strategic Management (Reading, MA: Addison-Wesley, 1986), p. 156.
Table 9.2. Key Characteristics of PLC Stages
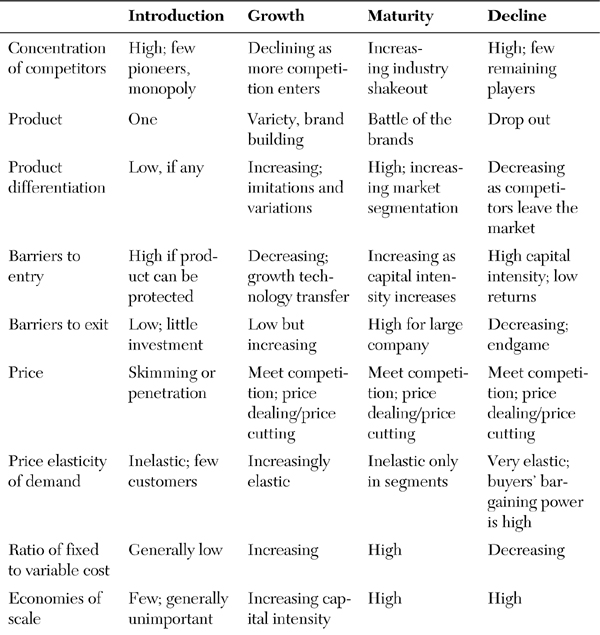

Source: Adapted from Rowe, A., Mason, R., and Dickel, K., Strategic Management (Reading, MA: Addison-Wesley, 1986), p. 156.
Strengths
Although the classic bell-shaped PLC has been validated in some industries, it is only one of many different types of product life cycles. Most of the research done on PLC theory has been limited to consumer products that are frequently purchased, low-priced, and widely distributed.
Despite the lack of breadth of empirical support, the PLC continues to make a deep impact on management thought. General acceptance of PLC theory reached its height with its inclusion in portfolio matrix theory in the 1970s. Most notable was the use of the PLC combined with experience curve analysis2 and as the basis of the BCG growth/share matrix (see Chapter 3, “BCG Growth/Share Portfolio Analysis”).
In fact, even today, most new marketing textbooks still devote several pages to a discussion of the PLC. In terms of the strategic choice between low cost and differentiation strategy, the PLC has a deterministic bias toward low-cost strategy. Perhaps the greatest contribution of the product life cycle to strategy theory was as a contributing basis to evolutionary S curve analysis.3 This promising theoretical development deals with shortening product life cycles and the pervasive impact of proliferating innovation in technology.
Ironically, the main weakness of PLC theory may turn out to be its most significant contribution to management thought. By applying diffusion theory to market analysis, the PLC has shed much light on the demand-side issues of strategy. It appears that research into the PLC has pointed the way toward exploring the other side of the market dynamic equation—the supply dimension.
Weaknesses
Several implementation issues for PLC analysis present formidable challenges, such as identifying product distinctions. Will you group products via product classes, product forms, or product brands? These distinctions are often ambiguous, depend on significant amounts of judgment, and drastically affect the shape and implications of PLC analysis.
Another challenge is the difficulty of distinguishing within which stage a product currently sits. By defining markets too narrowly as a result of a product focus rather than a customer orientation, management often instigates market decline of its own accord.
The PLC may lure some managers into deemphasizing the fact that marketing effort is a significant factor in determining the shape of the PLC. The PLC implies that sales is an independent variable when, in fact, it is the opposite—a dependent variable. Applying the PLC therefore can potentially confuse the cause-and-effect sequence of dynamic markets.
As mentioned, the PLC is strongly affected by marketing effort. The strongest cases in point that support this fact are products that rejuvenate after a long period of stability or the persistence of products that have been in the maturity stage for an inordinate period of time without showing any signs of decline. The continued existence and sales acceptance of product brands such as Jell-O desserts, Arm & Hammer baking soda, Listerine antiseptic mouthwash, Tide detergents, 7-Up soft drinks, Kleenex tissues, Maxwell House coffee, and Planter’s peanuts challenge the assumptions of the PLC.
Similarly, product classes such as nylon, Scotch whisky, Italian vermouth, French champagne and perfume, and cold breakfast cereal also defy the conventional logic of PLC theory.
The distinguishing feature of all these products is that they satisfy a basic human need and have unique product attributes supported by creative promotion and marketing communications. These characteristics are all the result of effective marketing strategies that help override any notion of product life cycles. In this regard, consider the impact of a Kellogg’s marketing campaign: “Kellogg’s Corn Flakes: Taste them again for the very first time.” This campaign was at least part of the reason why cereal manufacturers successfully expanded the adult cold cereal market—a market that the PLC would have prematurely slated for decline.
As an analyst, it is important that you consider the flaws of PLC:
• The PLC is biased toward viewing eventual decline of markets as a certainty. This leads to a self-fulfilling prophecy as the acceptance of maturity and decline fosters generalized strategies that reduce investment and often cause the market decline. Many successful and profitable firms are competing in low-growth mature or declining markets.
• Generalized strategies do not adequately incorporate competitive market dynamics. These include differences between large and small firms, established versus new firms, original entry versus market entry through acquisition, licensing, joint venture, and firms employing different strategies central to the PLC analysis.
• The PLC makes no concessions for the fact that, in an established industry, the developed infrastructure makes subsequent product introductions easier, delivering a much higher probability of success.
• Blind application of the PLC usually endorses the bias toward a low-cost strategy and does not take into account the effects of experience. Additionally, the PLC theory gives short shrift to the strategic importance of maintaining technology, marketing, and manufacturing process flexibility.
How to Do It
Step 1: Estimate Potential Demand
The first step in applying PLC theory is understanding market demand. Market research is required to identify the consumer segment(s), estimate total demand, understand tastes and preferences, identify unmet needs, and gauge the strength of potential and incumbent substitutes. All the standard tenets of market research apply to this first step and must be analyzed to determine where the market exists to support a reasonable probability of success.
Step 2: Determine the Price Range
Several methods approximate a competitive price point:
• Expert consultation. Ask internal and external sources to suggest a reasonable price. Engineers, operations managers, and other technical staff can offer insights into the technical feasibility of producing the item for a specified price range. Established distribution channels often offer a rich source of information about the value that the proposed new product would offer the consumer relative to competitive offerings.
• Consumer research. Many of the standard techniques of consumer research can be used to determine a reasonable price range such as barter equivalent analysis and in-depth interview techniques. These techniques also give the analyst a rough approximation of price elasticity.
Step 3: Forecast Sales for a Range of Possible Prices
Use the concept of customer value analysis4 to determine proposed product’s total value of ownership. This should include a breakdown of all the costs and all the benefits that the product bestows over its life span. This customer value analysis should then be repeated for competing products. Next, use this analysis as a backdrop to compare the relative competitiveness of the new product to potential and incumbent products at the various price points.
Step 4: Consider the Risk Associated with Competitive Price Cuts
If a product will not compete directly with any substitutes or will encroach on only a small portion of an incumbent’s established market, the probability of a competitive price decline will be lower. However, if the new product is presumed to displace a significant portion of an incumbent’s market share, a competitive price cut can be expected and must be incorporated into any pricing and costing decisions to ensure future product profitability.
Step 5: Determine the Fundamental Market Strategy for the Growth Stage
At this point in the analysis you must make a fundamental decision about selecting the targeted market segment. Incorporating the analysis from the previous four steps, the firm must decide to pursue a skimming or market penetration strategy. Although a generalized analysis can never hope to capture all the potential idiosyncrasies of specific markets, the PLC curve offers these general guidelines for choosing a skimming or penetration strategy:
Skimming strategy:
• The new product is truly unique.
• The total market demand is forecast to be small.
• The demand is price-inelastic.
• Cross-elasticity of demand is low.
• Promotional elasticity is high.
Penetration strategy:
• The new product shares many qualities with established products:
• Attribute superiority is small.
• Price elasticity of demand is high.
• Experience curve effects will probably be realized.
• Total market demand is expected to be large.
• A steep experience curve results.
• The risk of competition is high.
This selection of a fundamental marketing strategy determines the pricing strategy over the growth stage.
Step 6: Define the Level of Aggregation
The level of aggregation between product class, form, or brand is vital to PLC analysis. Although each level of aggregation offers you unique insights, practical application criteria usually override theoretical concerns.
Product life cycle research has shown a tendency to favor product form as the best level of aggregation. Product class usually does not reveal any trends because it includes too many different product markets. In addition, product class only shows trends over a very long time period.
Conversely, aggregating around product brands does not reveal trends, because their volatility makes them difficult to model properly. If you remember that a product is defined as the application of a particular technology to satisfy a specific need or desire of a customer segment, the final selection of a product definition depends in large part on your judgment.
Step 7: Forecast Turning Points
At this stage PLC analysis starts to distinguish itself as separate from traditional marketing strategy. In PLC theory, each cycle stage requires radically different strategies. Thus, implementing strategies offered by PLC analysis hinges on correctly identifying turning points when the product moves from one stage to another.
Although there are many business and economic forecasting techniques (regression analysis, exponential smoothing, leading indicators, market research), they all extrapolate from past data. Hence, they are useful only for short-term forecasting, and then only as long as the independent variable assumptions do not radically change. Furthermore, they are most useful for predicting turning points in the economy-wide business cycle. For PLC analysis, however, these techniques are not applicable at the micro level.
What is required are several turning point forecasting techniques. Unfortunately, this is the most difficult part of PLC analysis. Nonetheless, several helpful methods of forecasting these turning points are readily available.
• Declining prices. This indicator of weakening prices manifests itself in several ways, such as reduced retail prices or the increasing prevalence of discounting, which are often informally negotiated. The important distinction for turning point analysis is to detect when the magnitude of discounts changes substantially.
• Increasing sales resistance. A weakening market requires increasing sales effort, such as more salespeople, more calls, more attention paid to individual consumer needs, and products spending more time on the shelf.
• Increasing inventories. Declining market demand usually precedes excessive inventory accumulation. Although macroeconomic measures of inventory buildup indicate a general slowing of economic growth, the analyst needs to focus on inventory buildup in the relevant product market. Sources of information to aid detection include market-specific inventory data published by the government or available through subscription from private sources. When composing the subsequent time series, using a moving average will help prevent misleading temporary aberrations.
• Decreasing order backlogs. Sources of information include company announcements, financial reports, government statistics and trade association data. Again, current data is the most relevant to performing turning-point analysis.
• Analysis of internal sales data. Changes in the rate of growth of product sales may indicate the point of inflection on the PLC between the growth and maturity stage. It is recommended that a moving average be employed to remove any distorting temporary aberration from the analysis.
• Media analysis. Turning points are often predicated by negative press and editorial commentary about the product.
• Bubble syndrome. Ironically, turning points often occur when market participants unanimously assert that the sky is the limit. Such unbridled optimism often indicates that the market is close to saturation.
• Declining brand preferences. Weakening markets are often preceded by escalating cross-elasticity of demand.
• Increasing product standardization. Decreasing attribute differentiation may signal a turning point into the maturity stage as commoditization initiates.
• Market entry by private labels. This has been especially used by large warehouse clubs to generate high volumes of sales in long-standing product categories.
• Market saturation. Satiated market demand is often indicated by an increasing ratio of replacement sales to initial sales.
• Common production processes. One sign of a maturing market may be the uniform adoption of a particular production process, indicating an increasing focus on benefiting from experience effects across the industry.
Step 8: Modify the Strategy for Each Stage
The strategies for each stage in the PLC are then implemented in a staged process, with the identification of the turning points for each stage of the PLC. Tables 9.1 and 9.2 contain guidance for managing the variables of the market mix in each PLC stage.
Step 9: Remain Watchful for a New PLC
The introduction of innovative technology or any other disruptive competitive parameter may precipitate the evolution to a new PLC. In this case, a new PLC analysis must be conducted that incorporates these altered assumptions driving the independent analytical variables.
Case Study: Apple’s Product Life Cycles and Growth Potential from the iPod to the iPad
The Apple product life cycles indicate just how big the iPhone and iPad will be over the next few years (see Figure 9.3). It took the iPod five years to break the 30 million units per year mark. The iPhone got there in four, and the iPad made it in two. Overall, 67 million iPads have been sold. It took Apple 24 years to sell as many Macs, five years to sell as many iPods, and three years to sell as many iPhones. The Sony Walkman took more than 10 years to top out, and the iPod topped out within eight years of launch. What is becoming evident is that Apple product life cycles are moving faster, sooner than ever before.

Figure 9.3. Apple product sales and life cycles.
iPod sales may have peaked in 2008 at just under 55 million units and may fall to less than 45 million units in 2012. But the iPhone is set to sell over 120 million units, and the iPad is following a steep sales curve as well. It all adds up to an exciting phase of growth for Apple over the next four years, with revenues set to rise over $120 billion in 2012.
For Apple, four years of strong growth are evident from products already in the lineup. Both the iPhone and the iPad are set to hit the 100 million units per year mark in the next year or two. Despite the march of the Android, the Apple growth story will continue.
Source: Adapted from http://jkaonline.typepad.com/jkaonline/2011/04/apple-case-study-from-the-ipod-to-the-ipad-product-life-cycles-and-growth-potential.html, accessed June 18, 2012.
Endnotes
1. See Dean, J., “Pricing policies for new products,” Harvard Business Review, 29 (November/December), 1950, 45–53 (reprinted with retrospective commentary in 54(6), 1976, 141–153) and Moyer, R., “Forecasting turning points,” Business Horizons, 24(4), 1981, 57–61.
2. See Chapter 20, “Experience Curve Analysis,” of the authors’ book Strategic and Competitive Analysis: Methods and Techniques for Analyzing Business Competition (Upper Saddle River, NJ: Prentice Hall, 2003) for more details on this technique.
3. See Chapter 24, “S-Curve (Technology Life Cycle) Analysis,” of Strategic and Competitive Analysis for more details on this technique.
4. See Chapter 13, “Customer Value Analysis,” of Strategic and Competitive Analysis for more details on this technique.