14
Product Line Analysis
Short Description
Product line analysis is the process of examining a company's product line to determine if the line is maximizing the company's use of resources and is able to meet its strategic goals. The process involves assessing whether the correct volume and type of products are present in the line, an awareness of the life-cycle stages products are in, the manner in which product markets are segmented, the methods by which products are marketed to those segments, how the product is perceived by customers in the marketplace, and how a company allocates resources to products within its line.
Background
There were considerable advancements in products being made available in the marketplace after the Second World War that made a difference in how people lived. All a company essentially had to do was present the products with their fabulous features to waiting customers, and the growing marketplace would flock to purchase the item. Disposable razors and nylon pantyhose were products launched during this time and were readily adopted. However, by the 1960s, the competition had intensified, and managers became mindful of the fact that in order for a firm to prosper, a simple "build it and they will come" approach was not going to be sufficient. As competition for customers' favor intensified, the scope of managers' responsibilities—particularly marketing, brand, and product-related managers—started to include understanding the needs and wants of the customer and designing products to meet their actual (and not just assumed) needs. By the 1970s, concepts like segmentation, perceptual mapping, consumer behavior, and the product life cycle had been formulated and generally accepted, and the constructs aided in the product line analysis process.
Strategic Rationale
For those enterprises competing in global markets, the world's population is only growing at a little more than one percent per year.1 Managers increasingly recognize in industry after industry that market share will not grow unless it is being taken from competitors. Products can achieve sales growth by out-performing or under-pricing competitors' offerings. In order to do this, it is important for managers to understand a product's potential, as well as the potential of all products that the company has in the competitive marketplace. For example, discerning managers will need to know where the product is in its life cycle, what market the product is in, how that market is segmented, and how profitable the product is to the firm.
The reality of just-in-time delivery systems, efficient value chains, and shorter business cycles means that product line managers are under increasing pressure to get products to market faster and have fewer margins for error with steadily empowered and newly enlightened customers.2 "Design for postponement" strategies allow last-minute customizations to suit customers' preferences.3 These are among the reasons that customers' expectations of products' abilities and features offered are at historically high levels, putting more pressure on managers to get the product mix right the first time.
Product line analysis is a beneficial tool used in both business and competitive analysis. Decisions about whether or not to add or subtract products can have large consequences. Many apparently well thought-out new products have gone awry—wasting time, wasting money, and destroying careers along the way. Experiencing adverse consequences such as these leads many company executives to adopt a fast follower strategy, thus avoiding the risks, and rewards that are associated with new product development.4
In a competitive sense, knowing where a competitor's products are vulnerable can be a key facet of understanding what tactics might be employed by your company in exploiting these vulnerabilities. Turned on its head, knowing where your own company's products are vulnerable to competitive attacks allows you the opportunity to shore up the product's defenses or to employ cross-product or cross-line tactics and methods to maximize the return of the entire line of products in any given market space.
Strengths and Advantages
A critical tenet of economics suggests that competitive firms have limited resources. Product line analysis (PLA) is a valuable tool in determining where and which products should be the recipient of scarce, valuable organizational resources. The product life cycle can help in the forecasting process and in the ability to compare firms' products in terms of past and future to other products in a company's product line, and to competitors' products as well.5 Realistic expectations of profits, growth, and market share can be developed for the firm if each product and brand is viewed objectively within the context of the entire product portfolio offering. This objectivity is important if the manager who is evaluating a products' viability is, in some way, emotionally attached to the product. If the manager helped develop a product or spent a great deal of time resurrecting or marketing it, s/he may be less likely to cut it loose or alter it without persuasive empirical evidence of why the resulting business decision is beneficial.
Tools like the product life cycle (PLC), which are used in doing product line analysis, enable marketers and managers to see product life stages for what they are. Profits can be forsaken for market share in the beginning stages, and profits will follow in later stages when managers see the "big picture." Profit maximization for the life cycle can be most effectively realized when managers are not focused on the myopia of profit realization for the quarter or year.6
The ability of PLA to help the analyst categorize markets and position products according to segments ensures maximum efficiency in an overall product line. The process of analyzing the product line can reveal actual or potential cannibalization, duplications, met or unmet customer needs and wants, and availability or shortcomings of market size or structure. The overall strategy of a company's product line is improved when viable segments are identified, and resources are allocated with the intent of satisfying needs and communicating product attributes effectively.
Weaknesses and Limitations
A limitation of product line analysis is that the outlook tends to be limited to organizational phenomena, and external, less organizationally controlled factors like economic, social, and political circumstances are not taken deeply into consideration. Potentially significant macro-environmental conditions like recessions, demographic shifts, exchange rate fluctuations, and other risk factors outside the immediate control of the firm are frequently neglected; consequently, contingency plans for maximizing profitability from a product line facing these conditions may not be put in place.
From a business analysis perspective, there is a risk that product line analysis may lead to a too quick abandonment of some products or brands because they may appear to be at the end of their life cycle, even though they may have a loyal and still profitable (albeit less so than in the product's heyday) following for years to come. Product life cycles are not something that exists in absolution. They are metaphorical tools used to classify certain stages that many products or brands potentially pass through over a given period of time. If a manager views all products and brands through the product life cycle lens, there is a risk that some products' longevity will therefore be thwarted simply because the manager is looking for them to expire. Many classic products are simply exempt from the construct or run an atypical cycle.7 For example, combinations of nostalgia, technological developments, and/or good marketing have saved many toys from the scrap heap. Long-standing products like Hasbro's "My Little Pony," "Transformers," and "G.I. Joe" have all been resurrected from the PLC-prescribed phase-out in time to regain popularity with the original market's children. Mattel's "Barbie" line and Hasbro's "Monopoly" line of games use landmark anniversaries to build momentum, rather than lose it.
Another business-oriented risk inherent in product line analysis is that management become "product-focused" rather than "customer-focused." Entire industries have failed as a result of that very perspective. Theodore Levitt noted decades ago that had the railways seen themselves in the transportation industry (providing service that clients were actually looking for) rather than the railway industry (in the business of operating rail transportation), rail companies would be in a better position today.
The result of the product line analysis is the risk that some managers will use these concepts as hard and fast rules to develop or eliminate strategies, without taking into consideration the many unquantifiable nuances that can result from product line changes. A good example of this was the elimination of 25-cent coffees at Nordstrom stores. The Seattle-based retailer has built a reputation for legendary customer service over its 100+ year history. For decades, coffee has been available in the Nordstrom Café for a quarter. Payment is based completely on the honor system, and the product is there for anyone who wants it, customers and employees alike. In the late 1990s, Nordstrom share price was taking a beating in the stock market, and the company wanted to build a much more cost-conscious culture in order to help improve profitability. Some of the cost-cutting measures made a lot of sense—vastly reducing bloated inventories and speeding cycle times, as well as training employees to be more aware of the true cost of sales. One cost-cutting measure, however, was the elimination of the quarter coffee. Overnight, the cup of coffee was raised to a dollar! The outrage that resulted from the elimination of one little gesture, a coffee for 25 cents, and the nostalgia that was lost along the way, left a bitter taste with many loyal customers and employees, and may have ended up costing the company more money than it saved.
Process for Applying the Technique
Ideally, at the time of analyzing a product line, the analyst (or product manager) has firmly defined the goals of the product(s) in questions, and these are checked for consistency with the overall corporate strategy. It is also worthwhile to identify whether the target market has been identified and the marketing, pricing, and promotion strategies are consistent with the goals. The process of analyzing the product line will identify if the products are able to meet these goals given their current position, if the products need to be replaced with newer options, improved, or if market opportunities are being missed because the firms lacks a certain offering.
Step 1: Initial Product Audit
Volume of products in a line: The goal of maximizing profit over the long term is complicated when numerous products exist in a line. If a company is looking to exploit a low-cost strategy, they may choose to try and drive out costs by eliminating products that in any way duplicate or cannibalize sales of other products in the line. Alternatively, if a company is pursuing a differentiation strategy, they may seek to have more products in the line, which are tailored for and customized to different market segments. In a perfect world, any company product would not cannibalize the sales of other products within the company; nevertheless, cannibalization does occur to varying degrees where similar products are offered, and it is important for managers to be able to assess the impact of this phenomenon. Likewise, they must be able to assess any potential cannibalization that may occur to existing products if a new product is being introduced. Customer information systems, like CRM software, can be used to track how many mature-product sales are being lost to new products.8
However, cannibalization by itself, even if deemed at an intolerable level, is not a sufficient reason to eliminate products without properly evaluating alternatives. Data optimization techniques can use sophisticated mathematical modeling to generate revenue projection based on objectives and constraints. Programs like Excel Solver, Crystal Ball, and others use programming techniques, like linear, non-linear, dynamic, and stochastic techniques to attach a fiscal value to competing options.9 Ideally, these optimization techniques will identify a range where long-term goals and profits can both be realized, which helps managers decide how to apportion resources to different products. The process should aid in incremental analysis. Basically, for each additional unit produced, how much profit can the enterprise expect to realize?
Raw data alone cannot be the full extent of this step of the analysis. Each product must be viewed within the context of where it is in its expected life. In the same way that we would not expect a five-year-old child to perform the way we would expect a 15-year-old child to perform, organizations should have different expectations of products at different stages in the life cycle.
Step 2: Assess the Product Relative to Its Position in the Product Life Cycle
The product life cycle (PLC) is a marketing construct that applies a stylized life span to brands or products. The idea is that generally speaking, a product will experience four stages during its life, measured in terms of sales, profit, market share, or some combination. 10
During Stage 1, the product will experience introductory minimal sales and slow growth in its infancy, while the product is still "catching on" and glitches are worked out. Depending on the product, marketers will choose a "price skimming" strategy with a very high introductory price to discourage demand that the company is unable to fulfill or a "penetration pricing" strategy, selling the item at a low price in order to gain market share and then slowly raising the price in the growth stage. In Stage 2, the product will start to gain momentum and experience the greatest sales growth of the cycle. Stage 3 will see maturity and saturation, reflected in consistent sales, followed by Stage 4, the period of sales decline. Figure 14.1 is a summary of some of the trends that are represented in each stage of a traditional product life cycle.
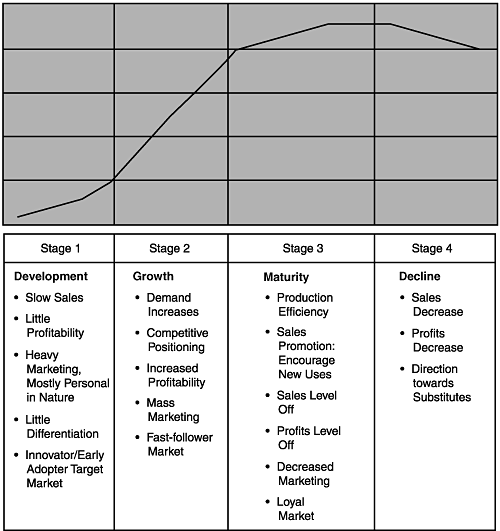
Figure 14.1 Traditional product life cycle framework
There are variations of this traditional cycle. As many as 11 different types of life cycle patterns have been identified in the literature, and probably more exist than this number.11 Life cycle performance can partly be determined by market demand (external, outside the direct control of firm) and partly by marketing efforts (i.e., internal locus of control). Not only will managers want to know where their or their competitor's products are in a life cycle at any given time, they will also want to know what sort of cycle the product is likely to experience and how sensitive the product's market is to expansion efforts. It is important to note that products' fates are not necessarily at the whim of pre-determined cycles—many elements will combine to determine products' longevity.12
Once one is familiar with the product life cycle, product line analysis will include examining data on all products, keeping in mind each product's holistic revenue and profit implications for each stage in the life cycle.13
Cost and revenue projections should be developed for the product at each stage of the product life cycle, particularly those in the future. Product success using this conceptual lens can be evaluated not based on comparisons between products, but how each product performs or has performed at the various stages. Product substitutions, extensions, sequels, and improvements can also be planned or projected by stage. Last but not least, the product life cycle can highlight profit contribution of the product, sales trends, and customer migration patterns within a valid construct.
Product Market Segmentation
A key to product line analysis is to develop an understanding of how the product is actually segmented among customers in the market. After all, the customer has to see the product in terms of features that matter to them and meets their needs, be it on price, quality, service, or other attributes. Being able to segment the market means being able to identify relatively homogeneous groups of customers, understanding what matters to these groups and how they behave. Apart from understanding the groups, product line analysis is also aided by segmenting because the process can identify if the segment is big enough to be served in a cost-effective manner.
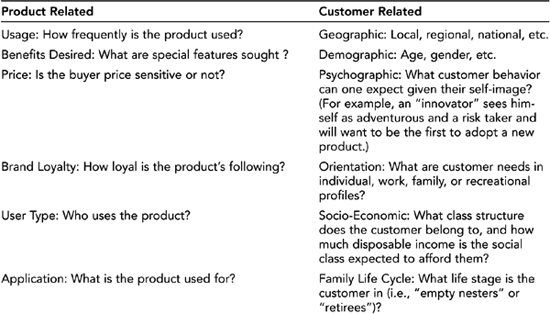
Segments can be broken down into two types: customer-related and product-related. A segmentation perspective assumes that competition comes from other products in the same product category. For example, a company may see mint-flavored toothpaste products as competing against one another, but not competing against baking soda, a product that, aside from doing other things, can clean teeth. A customer segmentation approach, however, might see mint-flavored toothpastes as competition against baking soda, if the target group is being segmented based on their values and self-image. A customer may value baking soda over mint-flavored toothpastes if they see it as environmentally friendly, less expensive, creative, and/or it satisfies a customer segment's desire for a multi-use, all-natural product. Table 14.1 gives an example of how markets can be segmented within these categories. The answers to the product or customer-market questions in Table 14.1 can aid analysts in developing an understanding of products' overall strategies, based on needs, wants, preferences, and motivations that are revealed by this process. The answers can also provide an idea of the proportion of products purchased by segments and shed light not only on the segment where marketing may be directed, but how they are being communicated with and whether there are problems in the process that can be addressed through insightful tactics or strategies.
Table 14.1
Product- versus Customer-Related Perspectives on Segmentation

Once this process is complete, managers should know if their or their competitors' strategic goals and product offerings are aligned. They should know if they are offering too many or not enough products to customers and which of those products are meeting the needs of desirable segments.
Understanding Positioning
Along with product positioning comes the more elusive task of deciphering how customers relate to a product's image and how that image compares with competing brands in the marketplace. The key to successful positioning is that a product delivers real desired benefits to the consumer in a form that they can easily understand and relate to.15
An assumption underlying most businesses is that in order to be viable, the company's goal is to grow and prosper over time. The growth can occur in profits, market share, geographical reach, and the like, but fundamentally, a company's overall product strategy in order to realize these goals will fall into the differentiation or low-cost strategy categories. Porter's Generic Strategies, as they are known, are attractive because they can be applied to one-product firms or multinational corporations. In short, the low-cost strategy seeks to gain competitive advantage by bringing a product to market, which is equivalent to competitors' in features and quality, at a lower price than the competitor. The differentiation strategy is where the company seeks to gain market share by offering a product that has superior features, quality, or services than the competitors. The low-cost and differentiation strategies can further be segmented by the scope of the product's market. The product's target can be broad (mass) or narrow (niche). The result is four generic strategies that can be applied to companies, product lines, and products. In summary, these four strategies are discussed next.
Cost Leadership
This is where enterprises try to provide low-cost products that have a mass market appeal. This requires these enterprises to employ very strict management controls and drive out costs at every level from production and distribution to sales and marketing. Examples of products in this category include the so-called "house brands," which are found at nearly every major supermarket chain. Companies using this generic strategy use their lower-cost edge to under-price competitors and attract price-sensitive buyers in great numbers to their products as a means of increasing their total profits. Alternatively, they can avoid price reductions and maintain an average price in the marketplace and use their lower cost edge to earn a higher profit margin on each unit of the product actually sold.
Differentiation
A product or business with a differentiation strategy appeals to the mass market but seeks to set it apart by offering a product that is better than the competitors in some way that matters to the customer, like features or quality. Procter & Gamble's Tide is an example of a product that appeals to a mass market and charges a premium based on its ability to fight stains, which is something that is important to people when they wash their clothes. This strategy has also pushed the Tide brand to develop innovative products like the Tide-to-Go Pen, Tide Coldwater, and Tide for High Efficiency washing machines. Consumers are typically willing to pay more for these products because of the convenience and effectiveness that they offer.
What sets the two focused strategies, discussed next, apart from cost leadership or differentiation strategies, is that the enterprise's focus is on products aimed at a narrow slice of the total market. The target segment or niche can be defined by geographic uniqueness (e.g., a restaurant chain that focuses on only the major cities of the UK), by specialized requirements in using the product (e.g., portable game playing units like the Nintendo Game Boy or Sony PlayStation Portables that are able to be played anywhere by their owners), or by special product attributes that appeal only to niche members (e.g., banks that offer certain financial products and services only to their wealthiest customers).
Generic focus strategies gain in their overall attraction as more of the following conditions are met:
- The industry has a wide variety of customers and different customer needs, thereby providing the opportunity to target products at many different segments.
- The focused segments are not being targeted by strong rivals.
- The focuser has built up unique capabilities or resources that allow it to serve the targeted niche in ways that are difficult for rivals to match.
- The niche targeted by the enterprise's products is large enough to be profitable and may also grow over time.
- The market share leaders in the larger product category don't perceive the niche as one that is crucial to their profitability.
Cost Focus
This is a low-cost strategy that targets a particular pre-determined group of buyers. Companies employing a cost-focus strategy are focused on securing a competitive advantage by serving customers in the targeted market niche at a lower price than rival competitors. An example of a company employing this strategy is Motel 6, a provider of overnight lodging in the U.S., which caters to price-conscious travelers seeking a clean, no-frills room for a night.
Differentiation Focus
A focused strategy based on differentiation aims at securing competitive advantage by offering the targeted niche customers something they perceive is more closely aligned to their own unique needs or preferences compared to the products offered by rival sellers.
This strategy focuses on a narrowly defined segment and seeks to differentiate the product based on product features, service, or convenience. The philosophy is that the focused strategy can serve the unique needs of the market better than any generalist. Local wineries often successfully employ this generic strategy.
The number and type of products offered in a product line will depend on what category the product is in. If a category is dominated by value brands with little differentiation, a variety of product types with innovative features will not be appreciated in the marketplace. Differentiation and innovative features should be saved for categories dominated by high-end niche markets where consumers are willing to pay more for product quality and features.16
Categories dominated by house brands where products are hard to differentiate between one another should focus on cost reduction and efficiencies, resulting in less SKUs and economies of scale.
A perceptual map can be a useful tool to understand where the consumers see firms in the market place in terms of image and product offerings. Not only can a perceptual map help managers understand where their product stands relative to other products in the marketplace, it can reveal holes or openings in the marketplace, where a company may want to direct future efforts.17 In order to construct a perceptual map, we must know the following:
- What criteria customers use to evaluate competitive product offerings
- How important this criterion is in the marketplace
- Where our product is perceived in the marketplace relative to competitors
Because positioning has an external locus of control (it is in the mind of the consumer), market research is a good way to obtain this information. Sometimes companies will conduct surveys or focus groups as a way of understanding customers' priorities and how well their product is performing in the areas that matter. Companies can also hire third-party market research firms to get unbiased feedback through surveys and data mining.
Figure 14.2 is an example of a perceptual map for laundry detergents available to customers in North America. In this example, a company would have determined on their own, or by purchasing research, that price and innovative product offerings, like special detergents for dark colors, high-efficiency washers, or organic stains, are important to the majority of purchasers. Then the company or researcher would determine how the product in question and those of the closest competitors are performing in meeting price and innovation expectations in the mind of the customer. In this example, Tide is perceived as more expensive than most competitors and most innovative as well. Persil products manufactured in Germany are the highest priced and are distributed in the U.S. by Miele, a high-end appliance company. For that reason, Persil targets a niche market of high-end customers and is not widely available.
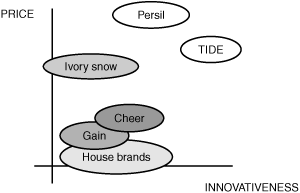
Figure 14.2 Perceptual map of laundry detergents
Resource Allocation and the Product Line
Resource allocation is tantamount to product line success. Under-capitalization will choke a product before it is able to succeed, and over-capitalization can waste valuable resources if they are better spent elsewhere. At this point in the analysis, managers will know where their product is in the expected life cycle, how the market is segmented, what is important to consumers, and how well the product is positioned to meet the needs of the target segments. From here, three factors remain that are important in determining resource allocation:
- What are the incremental sales and profits that can be realized per unit of capital injection?
- What are the inter-relations and dependencies that exist between products in the line?
- How cohesive are the cost and design structures that bring the product to market?
In its simplest form, modeling techniques can be used to create sales projections based on different levels of resources allocated to a product. Modeling programs are designed to determine the optimum combination of resource allocation that is needed to maximize profits. Unfortunately, in all but the most straightforward cases, products in a line have relationships with one another that will create some sort of interdependence. For example, when a printer is discontinued, sales of cartridges that fit that printer will also be affected. If the product line was designed to minimize this affect, then multiple printers will use the same type of cartridge, and cartridge sales will be less affected.
In order to maximize supply chain performance, many companies design products that share common components. Where possible, products are also created that share the same assembly process and are made to be different at the latest possible stage. If a product is eliminated from the line, other products in the line may therefore become more expensive on a per-unit basis. Manufacturers may lose some advantage of economies of scale, like discounts on components bought in volume. It is important for the analyst and decision-making client to understand how profitability will be affected. On the other hand, the cost of bringing a new or replacement product to market can be reduced if it is designed to share the cost structure with existing products.
Case Study: eBay, Inc. in 2004
This case study provides an illustration of how you perform product line analysis along the lines just described. The analysis looks at online auctioneer eBay's product line and shows how the process described previously can answer key questions about its product lines.
eBay is a person-to-person, business-to-person, and B2B online auction service provider. eBay's mission is "to provide a global trading platform where practically anyone can trade practically anything." eBay has created the world's largest online auction community where people buy and sell goods of all kinds, including collectibles, artwork, memorabilia, and increasingly larger ticket items like cars, boats, and real estate.
eBay has some considerations in product line development:
- Should eBay continue to grow by securing a global presence?
- Should eBay grow their fixed price format and go toe to toe with e-tailers like Amazon.com and brick and mortar stores with online selling?
eBay will start with a product audit, examining the products in their product line, looking at sales trends, and customer migration patterns. Currently, eBay's platform supports three formats, or products in their line:
- Online auction format, where buyers bid on items.
- Fixed price format, where buyers have the opportunity to submit a best offer or pay a fixed "Buy it Now" price.
- Store inventory format, where registered users have their own store pages and can manage and showcase their inventory, combine shipping, and create their own marketing plan or incentives.
eBay's sales trends are tremendous. The company's 41,000 registered users in 1996 grew to 94,900,000 registered users by the beginning of 2004, realizing a compound annual growth rate of 202%.18 In 1996, eBay reported $7 million in merchandise sales, which grew to $24 billion in 2003, representing a compound annual growth rate of 220%. This seems to demonstrate that the value of merchandise sold is increasing even faster than the number of users, meaning that existing users are increasing their usage, while new users are being attracted. Since eBay's inception in 1996, the users have shifted in focus from collectors to bargain hunters. The fixed price format is increasing in popularity, and this could represent a migration away from the auction format toward a general e-tailing format, changing the nature of eBay's competitive landscape. This shift would bring eBay into direct competition with e-tailers and traditional retailers with online presence like Amazon.com, Staples, Best Buy, and Wal-Mart. However, eBay's CEO, Meg Whitman, is wary of abandoning the core business too soon.
The online auction industry is in a tremendous growth stage, with eBay enjoying approximately 88% market share. Figure 14.3 reveals that eBay's products have reached Stage 2, or the growth stage.
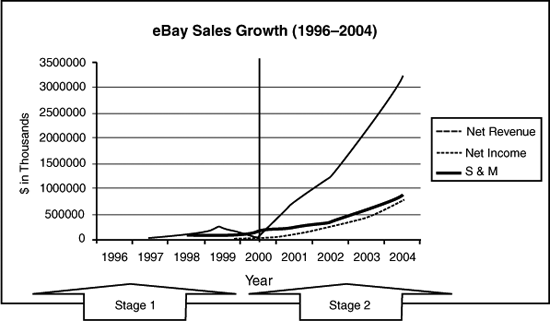
Figure 14.3 eBay's sales growth
eBay employed a first mover strategy in Stage 1. During that time, eBay avoided mass media in favor of careful PR and a community building approach. The user-friendly format attracted users who then touted eBay's benefits, and the company is now enjoying the affects of being the first to many markets and accumulating the critical mass that is creating global dominance. During Stage 2, or the growth stage, eBay's revenue is soaring, and sales and marketing costs are decreasing on a per-user basis. eBay started to use more mass-marketing techniques after 2002 and acquired many more auction formats in international markets. Stage 2 is typically when competitors will adopt a fast follower strategy and is crucial for positioning.
eBay's culture is unique in that the users have a sense of bonding with the company and other users. This phenomenon can translate to a core competence when the critical mass has been accumulated and their needs are continually anticipated and met. Although switching costs to other platforms are low, the feeling of comfort with a different platform would be hard to replicate, and the credibility that users have gained over time through eBay's rating system is not transferable to other sites.
eBay's position in the marketplace is consistent with the differentiation positioning strategy. The global Internet retail sector is very fragmented. Only 5.7% of the global sector value belongs to the top-five companies. The nature of the Internet lends itself to segments that are niche—focusing on one industry segment—but eBay has gone against the grain and resisted the urge to chase growth through traditional methods. Figure 14.4 demonstrates eBay's valuable positioning in the marketplace on the perceptual map, being the brand with the most awareness and greatest geographical scope.
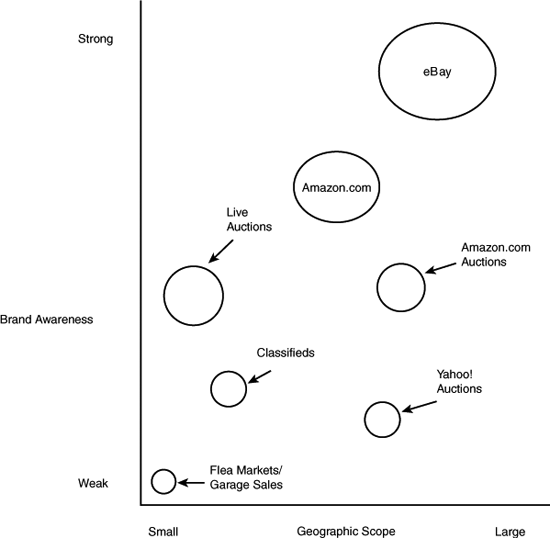
Figure 14.4 Perceptual map positions
eBay's first mover strategy meant that it beat Yahoo! Auctions and Amazon Auctions to many markets. Amazon.com is a competitor in the fixed price segment and may continue to be a closer competitor if the fixed price segment grows at eBay. Live auctions and flea markets cannot touch eBay's presence or scope, but the advantage that local outlets have is that they allow the purchaser to view the merchandise before buying.
The company is fortunate to be in a good financial position, having close to $2 billion to fund growth as of 2005. Nonetheless, the incremental sales growth per investment unit in marketing dollars appears to be quite small. Currently, there is significant inter-dependence between the formats because three of them will turn up in a search for any given item. For example, if one searches for a Burberry handbag, some sellers will have listed a fixed price, some will be auctioning the item, and some will have stores with other styles or brands of handbags for sale as well. The fact that all three are available to a buyer when they are considering making a purchase is a big part of what makes eBay attractive to many users.
The wiser money would be spent continuing international expansion and executing the first mover strategy or acquiring existing online auction houses in new markets, particularly where Internet usage is increasing. Many cultures worldwide are much more comfortable with bargaining than North American culture and may be even more receptive at first blush to eBay's platform. New markets also present opportunities to move into bigger ticket auctions, like cars and boats, which generate bigger fees, once the market is established. The fixed price format is attractive, but eBay would face fierce competition from traditional e-tailers and face a significant departure from its format and culture.
FAROUT Summary
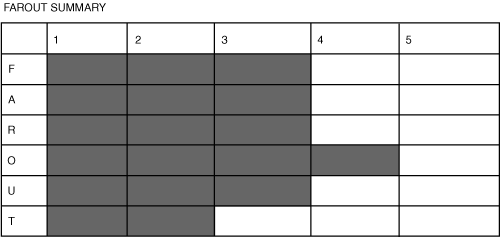
Figure 14.5 Product line analysis FAROUT summary
Future orientation—Medium. The focus of product line analysis is more current than future.
Accuracy—Medium. There are many factors that influence product performance, some of which include social and political forces, and not within the scope of the technique.
Resource efficiency—Medium. A lot of information is required in order to do a thorough analysis of a product line.
Objectivity—Medium to high. The process of analyzing the product line is meant to lessen some of the subjectivity that managers, particularly those with a vested interest in seeing certain results become a reality, project onto products.
Usefulness—Medium. This normally needs to be done in addition to a variety of other analyses, and as such, in and of itself offers only moderate utility.
Timeliness—Low to medium. It can take a while to conduct a very thorough product line analysis.
Related Tools and Techniques
- Customer segmentation analysis
- GE Business Screen/portfolio analysis
- Porter's Five Forces
- Product life cycle analysis
- Strategic group analysis
- SWOT analysis
- Value chain analysis
References
Buchalter, A., and H. Sakhnini (2006). "Fighting cannibalization," McKinsey Quarterly, 1, pp. 12–13.
Cox, W.E. (1967). "Product life cycles of marketing models," The Journal of Business (University of Chicago), 40, pp. 375–384.
Dhalla, N.K., and S. Yuspeh (1976). "Forget the product life cycle concept!," Harvard Business Review, 54, pp. 102–111.
"eBay Canada: About eBay: Company overview." ebay.ca. Accessed Feb. 28, 2006: http://pages.ebay.ca/aboutebay/thecompany/companyoverview.html.
Fleisher, C.S., and B.E. Bensoussan (2003). Strategic and Competitive Analysis: Methods and Techniques for Analyzing Business Competition. Upper Saddle River, NJ: Prentice Hall.
Jones, M.C. (2004). "eBay lays its cards on the global table," Brand Strategy, September, pp. 12–13.
Lee, H.L. (2004). "The triple-A supply chain," Harvard Business Review, 82, October, pp. 102–112.
Lefton, L.A., Brannon, L., Boyes, M.C., and N.A. Ogden (2005). Psychology, 2nd edition. Toronto: Pearson Education Canada, pp. 1–757.
Levitt, T. (1960). "Marketing myopia," Harvard Business Review, 38, pp. 45–56.
Levitt, T. (1965). "Exploit the product life cycle," Harvard Business Review, 43, pp. 81–94.
Marino, L., and P. Kreiser (2006). "eBay: In a league by itself," pp. C322–C352 in Thompson, A., Gamble, J.E., and A.J. Strickland III. Strategy: Winning in the Marketplace, 2nd edition, New York, NY: McGraw-Hill Irwin.
Porter, M.E. (1985). Competitive Advantage. New York, NY: Free Press, pp. 317–382.
Quelch, J.A., Farris, P.W., and J. Olver (1987). "The product management audit: Design and survey findings," The Journal of Consumer Marketing, 4, pp. 45–58.
Sellers, P. "eBay's secret." Fortune, Oct. 18, 2004, March 2, 2006: http://money.cnn.com/magazines/fortune/fortune_archive/2004/10/18/8188091/index.htm.
Shewchuk, J. (1992). "Life cycle thinking," CMA Magazine, May, pp. 34–36.
Swan, J.E., and D.R. Rink (1982). "Fitting market strategy to varying product life cycles," Business Horizons, 25, pp. 72–76.
"The World Factbook: United States." CIA—The World Factbook. January 10, 2006. February 21, 2006: http://www.odci.gov/cia/publications/factbook/geos/us.html.
Tractinsky, N., and O. Lowengart (2003). "E-retailers' competitive intensity: A positioning mapping analysis," Journal of Targeting, Measurement, and Analysis for Marketing, 12, pp. 114–136.
Vishwanath, V., and J. Mark (1997). "Your brand's best strategy," Harvard Business Review, 75, pp. 123–129.
Endnotes
1 2005 estimate of 1.14% comes from the CIA World Factbook.
2 Quelch, Ferris, and Olver, 1987.
8 Buchalter and Sakhnini, 2006.
9 Buchalter and Sakhnini, 2006.
10 Cox, 1967; Fleisher and Bensoussan, 2003.
12 Fleisher and Bensoussan, 2003.
14 Lefton, Brannon, Boyes, and Ogden, 2005.
15 Tractinsky and Lowengart, 2003.
