21
Event and Timeline Analysis
Short Description
Event and timeline (E&T) analysis is a group of related techniques that display events sequentially in a visual manner. Event analysis isolates external events and highlights trends, commonalties, and aberrations in competitor or other-actor behavior. When done systematically, E&T analysis can uncover important trends about a firm's competitive environment and serve as an early-warning function by highlighting when a competitor or another market player is straying from its normal course of behavior.
Background
Throughout history, different cultures have displayed diverse beliefs about the nature of time. It can also have an important place in the nature of competition between rivals in the marketplace.
Timelines of historical events (the linking particular units of time with specific events) are graphic representations of how individuals in secular society characterize time. A timeline displays a sequence that points to things that have already occurred, things that are occurring (the present), and things that have not yet occurred (the future).
The direction implied by the timeline says that time and history proceed forward in a line, not in a circle. Portrayed in a line in this fashion, specific events in history are always unique and are never repeated in the same manner. History invariably incorporates change, yet past patterns are often replicated to some degree in the present and future.
The study of events and time in organizations and in economics1 provides an explanation of the past, present, and future of industries and companies, how and when organizations respond to environmental factors, whether organizational decision makers are impacted adversely by inertia or momentum, and other developmental phenomena. Other common uses for E&T analyses include the deconstruction of criminal events by policing organizations, reasons why accidents have occurred, the ways in which terrorists might attack a sovereign state, and other forms of intelligence applications.
E&T analysis as presented in this chapter is a technique that most analysts probably already employ, though ordinarily not with the rigor and discipline that it requires. E&T analysis entails the systematic charting of events related to the subject in question. The analysis can take the form of a graph, chart, table, or line, among other formats.
E&T analysis is a way to chart the order of how companies perform certain activities, label the information spun off from these activities, and place that information into an analytical framework. Most business processes, including mergers and acquisitions, market entrances or exits, strategic relationship developments, or major market movements, follow a known pattern. These patterns may differ from firm to firm, and even within the firm over time if the patterns are studied and improved; nevertheless, most businesses attempt to document these patterns and improve major processes. They do this to promote learning over time. These efforts are commonly part of knowledge management initiatives and allow firms to seek greater efficiency in the performance of the process as opposed to constantly "reinventing the wheel."
Strategic Rationale and Implications
Even the simplest of tools can help illuminate many competitive analytical issues. When the amount of data and information regarding a specific rival's activities or an event overwhelms an analyst's ability to understand patterns and spot trends, it is beneficial to employ a clear chronology, such as that called for E&T analysis.
E&T analysis helps you to study data in a chronological and evolutionary context. Instead of just seeing "event 3, event 6, event 5, event 9, and so on," E&T assists in establishing a pattern—events 1,2,3, . . . n, and so on. This is particularly helpful since most of the information is gathered in an asynchronous fashion, and much of it, particularly that which is gathered over the WWW, lacks specificity in terms of dates (for example, year, month, season, quarter, or day) or times.
The presence of specific sequences in a timeline, where some events happen before others, can suggest the possibility of cause and effect—events exist in a relationship with one another; that is, in a particular context. Timelines suggest turning points, linear trends, and also progressions. Thus, making a timeline allows one to plot events in a graphic way, to see potential relationships, to help spur memory, and to grasp sequence. In the process, culling certain items from the many possible dates or events sharpens one's appreciation for the dates or events that are necessarily excluded. Simple chronologies of competitive activity within an industry, an isolated look at patterns evident from recent acquisitions, or a geographical representation of competitor activity all make for excellent E&T analysis applications.
Strengths and Advantages
E&T analysis is a basic technique that is most useful in answering "when is (X event) going to happen?" It is nearly always taught to individuals at some point in any basic educational program and, as such, should not require as much training time to master as some of the more sophisticated tools it often complements.
There are a variety of software applications to support the analyst performing E&T analysis. These programs are relatively inexpensive and can usually be mastered quickly. Many project management software applications can also be used by business and competitive analysts in performing this technique. Some applications of E&T analysis allow for a statistical examination of the collected data through time series analysis techniques that attempts to determine correlations between particular events.
E&T analysis is best used when dealing with a large number of discrete events that are spread over a long period of time or are otherwise obscured. It allows you to visualize a sequence of events and more easily see patterns than other more sophisticated forms of analysis. It is one of the best tools available for sorting out and making sense of a large number of events.
Often used as a planning aid, E&T analysis is highly supportive of, and is complementary to, other analysis techniques. When used in combination with other techniques, such as activity flow charts, event flow analysis, linchpin analysis, or the analysis of competing hypothesis process that are not as focused on answering when some event will occur, it can add the evolutionary element that the other techniques overlook.
Used in combination with other techniques for supporting a client's strategic decision, E&T analysis can help you achieve, among others, the following objectives:2
- Spot relationships among multiple organizational actors.
- Identify trends and patterns over time.
- Spot discontinuities.
- Differentiate between the analysis of the facts and the resultant conclusions.
- Evaluate the factual basis of possible recommendations.
- Identify matters requiring further analysis and examination—significant event blocks with vague or non-existent causal factors can alert the analyst to the need for additional fact finding and analysis.
- Understand the relationships among primary and secondary forces impacting an event.
- Weigh discrete events.
- Anticipate likely future events.
Weaknesses and Limitations
E&T analysis requires determining which events should or should not be included in the timeline. If this decision is made too narrowly (too exclusive), then important patterns in events may not be revealed. If you are too inclusive, you may be overwhelmed with data that makes it too complex to assess or will require additional time to perform the subsequent pattern deciphering task.
Determining the event constituting the starting point of a timeline can be difficult. You don't want to set the starting event either too early and include extraneous events in your analysis or too late and miss milestone events that should be considered. This difficulty is often addressed through the development of multiple starting points and trial and error.
Non-events (events that did not occur) can often be the most important facets of a timeline and may be overlooked in the process of gathering data. Decisions not made or action not taken can often be just as, if not more, important than those that escaped the analyst's notice in less-sophisticated data gathering or analysis efforts associated with the use of this technique. You must also properly distinguish milestone events from less significant events in the population being studied.
The determination to use E&T analysis tends to be after a key event has occurred so that an analyst and decision maker can deconstruct the pattern of activities that occurred leading up to a critical event. This is done in order to help executives learn from the pattern and to help prevent its reoccurrence. For it to serve a strategic purpose and be of predictive value, E&T analysis needs to be done well in advance of key decisions or events.
It can be difficult to project what will occur in the future, and you need to articulate assumptions clearly when projecting. Conditions, driving forces, and trends are often not captured or not captured accurately in some E&T analyses. You must fight the temptation to extrapolate events along a similar path when conditions or drivers are changing. You must also fight the temptation to be overly optimistic in anticipating that something will happen or to be too pessimistic in predicting that something will occur later than reasonable probabilities would suggest. As in all forms of analysis, you must be careful to weigh the data, facts, and evidence carefully so as to avoid imputing causation where none or little exists, or lack of causation when it does actually manifest itself—that is, avoiding type 1 errors (false positives) and type 2 errors (false negatives).
Process for Applying the Technique
Organization of event data should begin with construction of a timeline. The timeline orders events progressively. Transcribing onto paper what happened and when it happened can provide you with a clear picture for understanding a focal topic and how it evolved. The format of the timeline can be as simple as making a list of what happened and when it happened. Small "post-its" can be used to make a chain of events, with a sentence describing what happened and when it occurred on each post-it. This latter method is preferred since it is more easily expanded. Times and dates of events could also be entered into a computer database, spreadsheet, or word processor and sorted chronologically. This is commonly done in most E&T analysis applications, and the digitalization of this data can make it more effective for future retrieval and sorting. Last, there are tailored programs that are expressly designed for performing E&T analysis and allow for archiving information about the events and for producing visualizations of the eventual product.
In the material immediately to follow, we present several E&T analysis techniques that are used by business and competitive analysts. We begin with the simplest of them—the development of the basic timeline, and proceed to more complex applications like chronological tables, events matrices, and events and causal factors analysis techniques. To finish this section, we provide a case study showing a competitive analysis application of E&T analysis.
Plot the Target Firm's History of Key Events on a Line
Based on our experience, we recommend using the following generic 10-step process for creating the timeline in a graphic format. We also briefly describe how to develop it in a tabular format—otherwise known as a chronological table—at the end of this section. Most of these steps need to be carried out independently for each timeline, although some of these steps may be further consolidated depending on the nature of the question you are examining.
- Decide what the timeline will show: major events, market expansions, product introductions, events related to a geographic area, randomly chosen events, and so on.
- Make a comprehensive list of events that you wish to put on the timeline. This will require you or others to gather the population of events that are associated with the subject matter being focused on.
- Consider how you will choose events to include and exclude from the final timeline. Not all events will be of equal importance in developing an understanding of the evolution of a firm's decisions and/or actions. As such, it is important that you define the rules to use for excluding and including events for consideration. The ultimate criteria employed for this task is that these should be based on the client's critical intelligence needs or topics.
- Research and note the specific dates when the events that you wish to include occurred. It is a good idea to make a detailed note of your source(s) so that you can later verify the dates or the details of what transpired. As well, background documentation should be maintained in separate files for each event, should further examination or inquiries of the events be required.
- List the chosen events in a chronology. A chronology is a sequence that starts with the earliest item and ends with the most recent one. Make a special note of the earliest and latest dates that you wish to include. This will also allow you to determine the period of time that their timeline will cover.
- Decide what units of time you will use (days, months, quarters, years, decades, and so on) to divide the timeline into segments. These decisions may be a matter of trial and error. Calculate the number of segments that your timeline will have.
1992 to 2007 = 15 years total/1 segment/year = 15 segments - Draw a line and divide it into the number of equal segments that you figure you will need.

- Put the dates on the appropriate segments, from left to right

- Using the chronology that you made of events and dates, figure out where they would fall on your timeline. It is useful to devise a scheme for how you mark and label them. For instance, you could write certain symbols (for example, $ for acquisitions and * for alliance formations) on the timeline, attach different colored labels, or make a code that refers back to your chronology.
- If there is no room on your timeline to include all of your chronology, cull some of the dates or make a timeline with larger segments (for example, one timeline for events in the firm's home country and one for events that take place outside its primary market). If your dates can be divided into two or three smaller categories or themes, try making parallel timelines with identical segment sizes. You can then see how the theme develops, and you can also compare two or more themes at a time.
Develop a Chronological Table of Events
"Event flow analysis" is the compilation and analysis of data and information relating to events as they have transpired over time. It allows you to draw conclusions and make recommendations based on your analysis and is commonly used in relation to one specific action or event by a competitive rival, where the important events leading up to the event are noted.
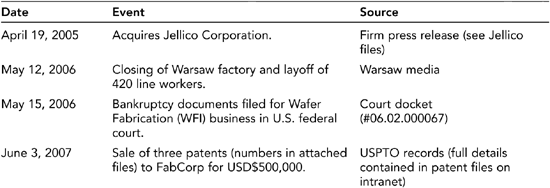
A popular way of performing E&T analysis is in tabular format, typically with three columns that contain the dates that events occurred, basic descriptions of the events, and data indicating the source of information concerning the event. These are often supported by digital files that are searchable on intranets designed for tracking particular competitors or other intelligence targets (see Table 21.1).
Table 21.1
Illustration of a Chronological Table

Develop an Events Matrix
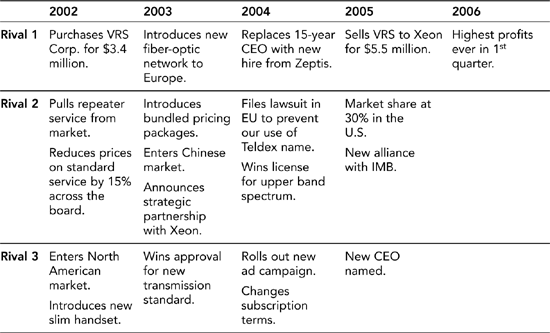
An events matrix is particularly useful for looking at multiple rivals, best exemplified by rivals within one's own industry. In this technique, you list the rivals in the first column of the matrix and array the timeline segment across the top. Critical events pertaining to the industry rivals are then put in the cells. This method can be particularly helpful for identifying relationships between rivals and events (see Table 21.2).
Event and Causal Factors Analysis
Experience has shown that major market events are rarely simple and almost never result from a single cause; instead, they are typically multi-factorial and develop from clearly defined sequences of events. You need to identify and document not only the events themselves, but also the relevant conditions affecting each event in an event sequence.
Event and causal factor (ECF) charting is a technique that displays the events sequentially in a visual manner using squares, ovals, and arrows to show the relationship between events important to the problem and potential causes of the problem. It displays the reason why each event occurred.
To accomplish this, a simple straightforward approach can be used that breaks down the entire sequence into a logical flow of events from the beginning of the market event development. It is important to realize that the end point may be defined either as the event itself or as the end of the firm's response phase. This flow of events will not necessarily lie in a single event chain, but may involve confluent and branching chains. In fact, the analyst often has the choice of expressing the event's sequence as a group of confluent event chains, which merge at a common key event, or as a primary chain of sequential events into which causative factors feed as conditions that contribute to event occurrence, or as a combination of the two.
Construction of the ECF chart should begin as soon as the analyst or decision maker begins to gather factual evidence pertinent to the event in question. As already discussed, the events and causal factors will usually not be discovered in the sequential order in which they occurred, so the initial ECF chart will be only a skeleton of the final product and will need to be supplemented and upgraded as additional facts are gathered. Although the initial ECF chart will be incomplete and contain many information deficiencies, it should be started as close to the market event as possible because of its innate value in helping to:
- Organize the event data
- Guide the subsequent assessment process
- Identify and validate factual findings, probable causes, and contributing factors
- Simplify organization of the resultant report
- Validate and confirm the actual event sequence
- Illustrate the event sequence in the report provided to decisions makers
With all its virtues as an independent analytical technique, ECF analysis is most effective when used with other E&T analysis tools that provide supportive correlation or no confirmation. Further, ECF can be the framework into which the results from other forms of analysis are integrated. An appropriate combination of the major E&T analytic tools, including ECF analysis, provides the core for a good, triangulated analysis process.
Figure 21.1 illustrates the conventions of performing the ECF analysis charting technique.3
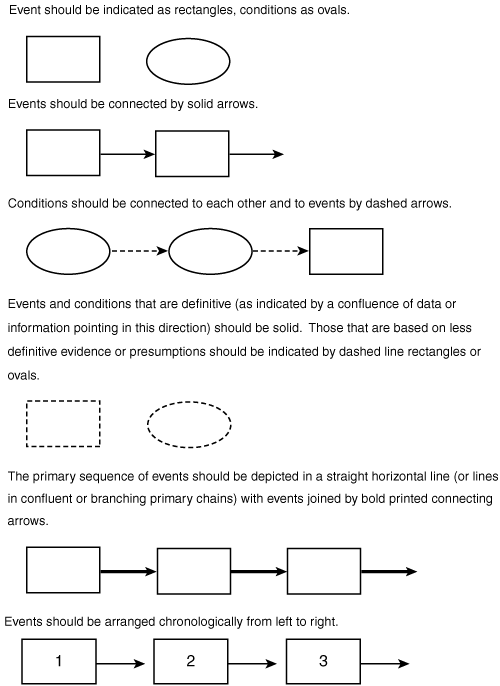
Figure 21.1 Process for performing ECF analysis
Secondary event sequences, contributing factors, and systemic factors should be depicted on horizontal lines at different levels above or below the primary sequence (see Figure 21.2).
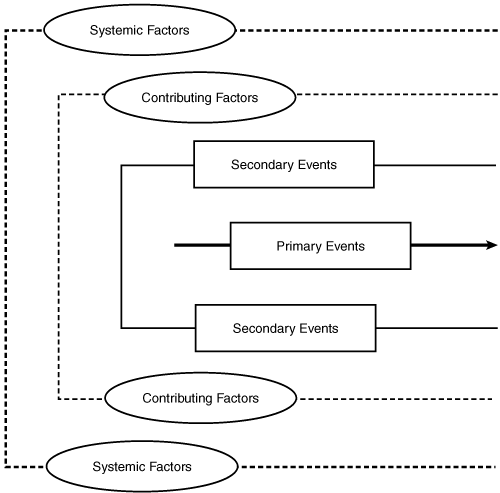
Figure 21.2 General ECF analysis chart format
Events should track in logical progression from the beginning to the end of the targeted event sequence and should include all pertinent occurrences. This necessitates that the beginning and the end be defined for each event sequence. Analysts frequently use the focal marketplace action as the key event and proceed from it in both directions to reconstruct the pre-event and post-event sequences. The general format is illustrated in the following section.
Suggested Criteria for Event Descriptions
- Each event should describe an occurrence or happening and not a condition, state, circumstance, issue, conclusion, or result; that is, "began accepting subscriptions," not "contracted with electronic retailer to provide retail channel."
- Each event should be a single, discrete occurrence, not combinations of events or multiple occurrences.
- Each event should be described by a short sentence with one subject and one active verb; that is, "Web site accepted subscriptions," not "Web site accepted subscriptions and potential customers received newspaper inserts."
- Each event should be described as precisely as possible; that is, "rival announced they had achieved 100,000 two-year subscriptions in UK marketplace on January 18, 2007."
- Each event should include appropriate quantification if possible (see preceding example).
- Each event should be derived directly from the event (or events, in the case of a branched chain) and conditions preceding it; that is, "firm reduced price on two-year subscriptions" is preceded by "firm received many calls questioning its multiyear pricing policy," which is preceded by "firm tried to discourage one-year subscriptions by pricing this term at 10 percent less than two-year term for same options." The idea here is that each event is derived logically from the one preceding it. When this is not the case, it usually indicates that one or more steps in the sequence have been left out.
- Conditions differ from events insofar as they: (a) describe states or circumstances rather than happenings or occurrences; and (b) are passive rather than active. As far as is practical, conditions should be precisely described, quantified where possible, posted with time and date where possible, and derived directly from the conditions immediately preceding them.
E&T analysis is a tool that helps you bring logic and order to data, typically in the form of a timeline, chart, or table. The timeline subsequently becomes input and a complement to other analysis techniques. It is also an important part of the analyst's report on the focal firm or event, since it explains what occurred and the sequence of occurrence. Thus, the final timeline must be written clearly and correctly so that the decision makers who use the analyst's report will understand it. Last, but importantly, E&T analysis methods truly are an essential element in any analyst's tool kit and can be employed for a myriad of different analytical purposes.
Case Study
The following case study4 provides a detailed description of how E&T analysis can be used to answer a question posed by a strategic decision maker. It describes how an analyst identified several months in advance, when and in what quantities, a rival competitor would be releasing a competitive generic pharmaceutical product into the marketplace and how the decision makers used this information in planning tactics to counter and lessen the adverse market impact of the pending introduction.
Timelines in Competitive Analysis
A pharmaceutical company had learned that a competitor received U.S. Federal Drug Administration (FDA) approval for the potential marketing of an over-the-counter (OTC) drug that directly competes with one of its own OTC consumer products. This stage of FDA permission only permits the rival firm to prepare its manufacturing facilities for FDA production quality inspection, in advance of getting a potential final FDA approval for marketing the drug, which is expected within the next year.
The focal firm wanted to know exactly the date of the launch time, as well as the quantity of product to be launched. This insight would give the client firm the time and ability to accurately develop a pre-emptive marketing strike, using some responsive advertising and pricing tactics. The client firm stood to lose millions of dollars and market share if its decision makers failed to identify the nature and timing of this introductory window being opened by the rival.
The nature of the problem usually indicates the nature of the analytical solution. In this instance, the client's concern centered around "time." "How long," the client wanted to know, "will it take for the competitor to introduce its product?" FDA approval only signaled a warning, not the actual product launch date. The analysts needed to find a way to link the element of time with the release of information about the competitor. The method they chose to generate a solution was to timeline the situation.
Development of the Timeline
1. Identify Each Process Taking Place
The analyst needed to understand each piece of equipment and how it worked, along with the expertise and personnel required by the rival firm at each major stage of the process. The client took the analyst on a detailed tour of one of its plants. This allowed the analyst to learn about each major piece of equipment and its purpose. The client also introduced the analyst to key employees in its engineering, marketing, and production units. They helped answer the analyst's technical questions. The manufacturing details received during these internal client interviews were what later helped the analyst to project the competitor's production volume up to one year into the future, which was particularly helpful since the rival's plant had not opened yet.
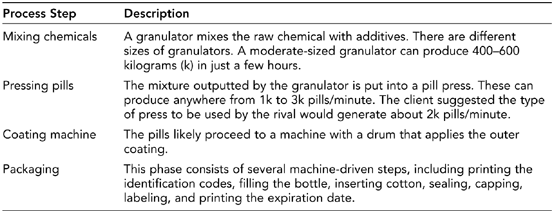
Because the FDA must certify all production equipment for quality control, it was important to understand the machinery being used. These process details were important for the analyst to probe for details on the timing of the expected product launch. Some of the process details and the machinery used are described next.
Table 21.3
Basic Steps in Producing Over-the-Counter Pills
2. Collect the Data
Data was gathered from a variety of sources, including news, interviews, and FDA documentation. It came in randomly as it was found. Some examples of what was found included the following:
- An estimate from the client of the level of inventory a manufacturer must have in order to prepare for this kind of product roll-out.
- The number of pills expected to be packaged per bottle.
- Three different bottle sizes of 24 pills, 50 pills, and 100 pills would be used as well as the estimated dosage.
- The first shift for the plant was already being recruited.
- A firm estimate of the expected production yield over the course of the start-up period before roll out.
- Equipment manufacturers and, through interviews, an identification of likely key equipment to be used.
- The granulator's capacity.
- The rival's chosen brand name for the product.
The analyst began developing the pattern of activities under the timeline during the data collection phase. This was accomplished by combining the gathered information with the analyst's views and in dialogue with the client.
3. Organizing the Data over Time; Develop the Timeline
The analyst next mapped the sequence of events involving the focal process, particularly which event came first, second, third, and so on. The following describes the timeline sequence for the prospective roll-out.
Table 21.4
Major Steps in the Sequence of a Drug Roll-Out
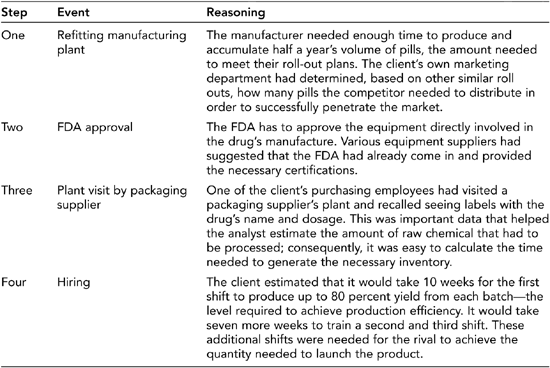
The analyst had to support the pieced-together timeline with more corroborating data before drawing conclusions. This required additional data gathering in the form of interviews of other industry contacts, such as corrugated box manufacturers, graphic designers, packaging materials suppliers, retail buyers, and trucking/shipping companies, among others. The gathered information became intelligence when the analyst assembled it using the timeline.
4. Draw Conclusions
The analyst was able to project how long it would take for the competitor to stockpile enough pills to launch the product by combining knowledge of the plant's actual FDA certification date and hiring information with the time it would take for the new employees to produce products at a certain yield rate. The intelligence produced by the analyst was an estimated six- to seven-week product launch window, which helped the client to successfully plan a pre-emptive strategy by flooding the market with discount coupons, special institutional promotions, and related sales activity.5
FAROUT Summary
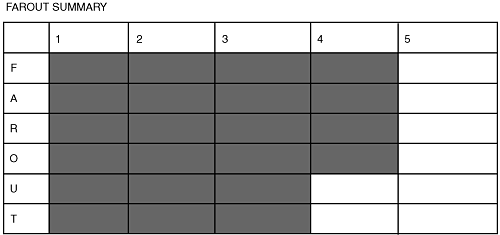
Figure 21.3 Event and timeline analysis FAROUT summary
Future orientation—Medium to high. E&T analyses array items over time. They are designed to help analysts better understand past events in order to predict the future.
Accuracy—Medium to high. This method is typically more accurate than others because it relies on the analyst using and organizing empirical events. To the extent that the analyst has accurate and verifiable data, the technique should result in higher than average accuracy.
Resource efficiency—Medium to high. Much of the information needed to perform this technique can be found in open, public sources. For more specific purposes, it may also require other forms of data collection, particularly primary collection methods.
Objectivity—Medium to high. This technique does not suffer from potential biases that most other techniques do, in that the only real subjective choice comes from deciding which events to include or exclude from the timeline. The level of objectivity is also lowered when doing advanced applications requiring identification of drivers, conditions, or primary and secondary causal factors.
Usefulness—Medium. Although this technique is complementary to many others, it requires a lot of analytical manipulation to help clients use it "out of the analyst's box."
Timeliness—Medium. The gathering of the data and organization of it underlying this technique, as well as arraying it in a timeline and placing it in easy-to-communicate formats, can be time consuming.
Related Tools and Techniques
- Activity flow charting
- Competitor profiling
- Driving forces analysis
- Event flow analysis
- Event matrix analysis
- Forecasting
- Historiographical analysis
- Indications and warning analysis
- Issue analysis
- Strategic relationships analysis
References
Buys, J.R., and J.L. Clark (1995). Events and Causal Factors Analysis. August. SCIE-DOE-01-TRAC-14-95. Idaho Falls, ID: Scientech Inc., Technical Research and Analysis Center.
Fuld, L.M. (1995). The New Competitor Intelligence. New York, NY: John Wiley & Sons.
Heuer Jr., J.R. (1999). The Psychology of Intelligence Analysis. Washington, DC: Center for the Study of Intelligence.
Kimberly, J.R. and H. Bouchikhi (1995). "The dynamics of organizational development and change: How the past shapes the present and constrains the future," Organization Science, 6(1), pp. 9–18.
Krizan, L. (1999). Intelligence Essentials for Everyone. June, Washington, DC: Joint Military Intelligence College.
Miller, D., and P.H. Friesen (1980). "Momentum and revolution in organizational adaptation," Academy of Management Journal, 23(4), pp. 591–614.
Peterson, M. (1998). Applications in Criminal Analysis: A Sourcebook. Westport, CT: Praeger.
Van de Ven, A.H., and M.S. Poole (1995). "Explaining development and change in organizations," Academy of Management Review, 20(3), pp. 510–540.
Endnotes
1 Kimberly and Bouchiki, 1995; Miller and Friesen, 1980; Van de Ven and Poole, 1995.
2 Buys and Clark, 1995; Heuer, 1999.
