Optimization principal 1: Work smart not hard. The best performance improvements are achieved when effort is focused to optimize those parts of the game that take up the most computer resources—the "bottlenecks". Code profiling involves identifying resource bottlenecks by analyzing how long different actions take to complete their tasks. For graphics-intensive operations, the Stats panel of the game window can be used to record frame rates and "dropped calls". For memory and processor-intensive code, Unity-Pro offers detailed, frame-by-frame, code profiling. Finally, for those who do not have Unity Pro, there is a freely available code profiling class from the Unify Community Wiki, which we will demonstrate in this recipe. Code profiling involves timing how long it takes between starting to do something, and ending it. Individual statements or loops may be profiled within a method, or the duration of a complete method may be analyzed, or the time spent between one event and some other may be checked (for example, the time between Unity to be asked to load a new scene, and that scene to then load and start running).
Note
The Unity C# code profiler demonstrated in this recipe is by Michael Garforth, and can be found at http://wiki.unity3d.com/index.php/Profiler.
To profile your code performance, perform the following steps:
- Start a new project, and import the C# script
Profile.cs. - Add the following C# script class to the Main Camera:
// file: ProfileScript.cs
using UnityEngine;

public class ProfileScript : MonoBehaviour
{
  private void Awake() {
    Profile.StartProfile("Game");
  }

  private void Start(){
    Profile.StartProfile("Start");
    int answer = 2 + 2;
    print("2 + 2 = " + answer);
    Profile.EndProfile("Start");
  }

  private void OnApplicationQuit() {
    Profile.EndProfile("Game");
    Profile.PrintResults();
  }
}
The Profile class defines three important static methods that can be called to record times for profiling: StartProfile(<taskName>), EndProfile(< taskName>), and PrintResults(). Different tasks can be timed by choosing an appropriate string (such as Game) and calling StartProfile() when they begin, and EndProfile() after they have completed. Finally, PrintResults() tells the Profile class to display the results of all recordings in the Console window:
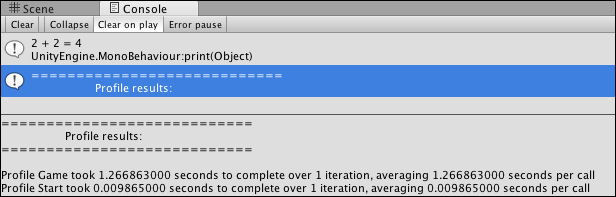
Our ProfileScript object added to the Main Camera requests two named tasks be profiled: the simple 2 + 2 calculation in the Start() method (tagged Start); and the time between the Awake() method being called and the application quitting, because the user stopped game execution (tagged Game). As can be seen in the preceding screenshot, the profile for Start shows that the time taken was 0.009865000 seconds; and for Game it was 1.266863000 seconds.
This recipe illustrates a straightforward way to measure the time taken between different points in your game. If the same string "tags" are used for StartProfile() and EndProfile() many times (for example, in a loop), then the Profile class will output the average time the profiled task took to complete.
The following are some details you don't want to miss:
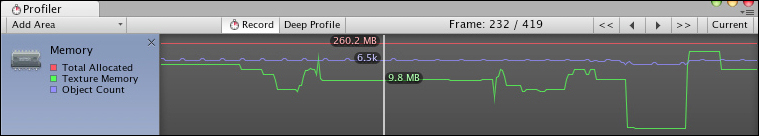
If you have Unity Pro then the Unity's code Profiler can provide much more detailed timing analysis of your game on a frame-by-frame basis. For example (see the following screenshot), the number of objects in each frame can be analyzed (the middle line in the screenshot).
For more information, see Unity's documentation pages at http://docs.unity3d.com/Documentation/Manual/Profiler.html.