Real World Solutions
Challenge
A line-of-business multi-tier application has stopped functioning correctly, with one of the nodes involved in the tiers appearing to have stopped network communications.
As the application has been deployed to our cloud, all the nodes involved in the tiers are virtual, thus rendering it impossible to have our networking team set a switch port into monitor mode without seeing all the traffic for each virtual machine hosted on the host. This is far too much data to consume and process, and as a result, this is a last-resort option only.
The Windows Server 2012 Hyper-V extensible switch presents new options to address this scenario.
Solution
Start by creating a new virtual machine on your Hyper-V host with a single network interface. This node should then be configured with your favorite Windows Server 2012 Hyper-V-supported operating system deployed to it, along with a copy of Wireshark that can be downloaded from the following site: www.wireshark.org/download.html.
Launch Wireshark. On the Capture pane, select the sole listed network adapter, which should start with the name Microsoft Corporation: DeviceNPF. Then click Start. The view will change, and packet capture will begin to scroll on the screen.
Back on the Hyper-V console of your hosting server, open the properties of your WireShark virtual machine. On the Hardware list, expand the Network Adapter to present the section called Advanced Features. Selecting this option will render a new properties page. Locate the section titled Port Mirroring, and set the Mirroring mode for the Wireshark machine to Destination.
While still in the Hyper-V console, select the VM that is illustrating the problem, and open its properties dialog. As before on the Hardware list, expand the Network Adapter to present the section called Advanced Features. On the properties page, locate the section titled Port Mirroring, and set the Mirroring mode for this machine to Source.
The Wireshark virtual machine can now capture the traffic that is mirrored from the source machine. Decoding this capture will still be a task for the engineers with networking experience, however as a visualization administrator, the only requirement you have to focus on, is to ensure that both the source and destination virtual machines must be located on the same Hyper-V host.
Challenge
As we deploy additional VM Hosts and VMs to our environment, tracking their utilization becomes an ever-increasing challenge. Hyper-V 2012 has been extended with new metering functionality which vastly simplifies our options to report on utilization, however out of the box generating reports from this data, requires some skill and time to configure and prepare.
As we deploy additional VM Hosts, and VMs to our environment, tracking their utilization becomes an ever increasing challenge. Hyper-V 2012 has been extended with new metering functionality that vastly simplifies our options to report on utilization, however out-of-the box, generating reports from this data requires both skill and time to configure and prepare.
We could create a set of scripts that would, at a scheduled interval, export the current metrics for each of our virtual machines, which could then be parsed to create a set of reports, updated at our defined interval.
Solution
Leveraging the Open Source world, well respected and fellow MVP Yusuf Ozturk has addressed our scripting challenge and released packaged solution called PoSHStats (located at http://poshstats.net). The package is designed to be installed on your Hyper-V host, or a member of a Hyper-V cluster, gathering metrics from both your Hosts and VMs, to be presented in using a lightweight web server, which has also been created in PowerShell, as Microsoft has recommend against installing the IIS role on your Hyper-V servers.
Once downloaded and installed, PoSHStats is started from the Powershell interface with the following command:
Start-PoSHStats –Hostname localhost –port 8080During the first execution, the script will prepare to store and capture the metric from your VMs and also verify if it should enable metric collection on all your VMs. Once the script has completed, the new light web server will be listening for your browser connection at the port you specified; in the above example, this would be http://localhost:8080/, which will render a web page similar to Figure 5-12.
Figure 5-12 PoSHStats VM Metrics
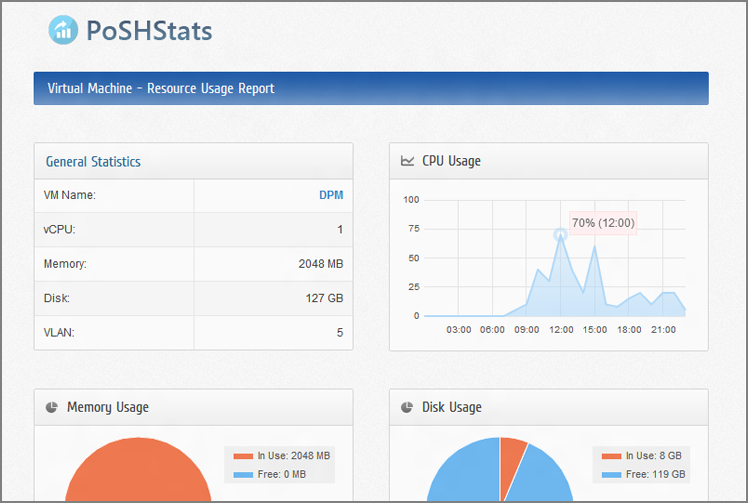
PoSHStats gathers data hourly, and presents details for CPU, Memory, Disk, and Network usage in Hourly, Daily, Weekly, and Monthly views, along with the options to copy, export, or print the reports for further analysis.