Chapter 1
INTRODUCTION
Cancer, Princess Dido, and the city
To look at the cross-section of any plan of a big city is to look at something like the section of a fibrous tumor.
—Frank Lloyd Wright
X = ?: WHAT ARE CITIES?
Although this question was briefly addressed in the Preface, it should be noted that the answer really depends on whom you ask and when you asked the question. Perhaps ten or twelve thousand years ago, when human society changed from a nomadic to a more settled, agriculturally based form, cities started to develop, centered on the Euphrates and Tigris Rivers in ancient Babylon. It can be argued that two hundred years ago, or even less, “planned” cities were constructed with predominately aesthetic reasons—architecture—in mind.
Perhaps it was believed that form precedes (and determines) function; nevertheless, in the twentieth century more and more emphasis was placed on economic structure and organizational efficiency. A precursor to these ideas was published in 1889 as a book entitled City Planning, According to Artistic Principles, written by Camillo Sitte (it has since been reprinted). A further example of this approach from a historical and geographical perspective, much nearer our own time, is Helen Rosenau’s The Ideal City: Its Architectural Evolution in Europe (1983). But there is a distinction to be made between those which grow “naturally” (or organically) and those which are “artificial” (or planned). These are not mutually exclusive categories in practice, of course, and many cities and towns have features of both. Nevertheless there are significant differences in the way such cities grow and develop: differences in rates of growth and scale. Naturally growing cities have a slower rate of development than planned cities, and tend to be composed of smaller-scale units as opposed to the larger scale envisioned by city planners.
“Organic” towns, in plan form, resemble cell growth, spider webs, and tree-like forms, depending on the landscape, main transportation routes, and centers of activity. Their geometry tends to be irregular, in contrast to the straight “Roman road” and Cartesian block structure and circular arcs incorporated in so many planned cities, from Babylonian times to the present [1]. Some of the material in this book utilizes these simple geometric ideas, and as such, represents only the simplest of city models, by way of analogies and even metaphors.
ANALOGIES AND METAPHORS
Was Frank Lloyd Wright correct—do city plans often look like tumor cross sections writ large? Perhaps so, but the purpose of that quote was to inform the reader of a common feature in modeling. Mathematical models usually (if not always) approach the topic of interest using idealizations, but also sometimes using analogies and metaphors. The models discussed in this book are no exception. Although cities and the transportation networks within them (e.g., rail lines, roads, bus routes) are rarely laid out in a precise geometric grid-like fashion, such models can be valuable. The directions in which a city expands are determined to a great extent by the surrounding topography—rivers, mountains, cliffs, and coastlines are typically hindrances to urban growth. Cities are not circular, with radially symmetric population distributions, but even such gross idealizations have merit. The use of analogies in the mathematical sciences is well established [2], though by definition they have their limitations. Examples include Rutherford’s analogy between the hydrogen atom and the solar system, blood flow in an artery being likened to the flow of water in a pipe, and the related (and often criticized) hydraulic analogy to illustrate Ohm’s law in an electric circuit.
Analogy is often used to help provide insight by comparing an unknown subject to one that is more familiar. It can also show a relationship between pairs of things, and can help us to think intuitively about a problem. The opening quote by Frank Lloyd Wright is such an example (though it could be argued that it is more of a simile than an analogy). One possibly disturbing analogy is that put forward by W.M. Hern in the anthropological literature [3], suggesting that urban growth resembles that of malignant neoplasms. A neoplasm is an abnormal mass of tissue, and in particular can be identified with a malignant tumor (though this need not be the case). To quote from the abstract of the article,
Malignant neoplasms have at least four major characteristics: rapid, uncontrolled growth; invasion and destruction of adjacent normal tissues (ecosystems); metastasis (distant colonization); and de-differentiation. Many urban forms are almost identical in general appearance, a characteristic that would qualify as “de-differentiation.” Large urban settlements display “rapid, uncontrolled growth” expanding in population and area occupied at rates of from 5 to 13% per year.
The term “de-differentiation” means the regression of a specialized cell or tissue to a simpler unspecialized form. There is an interesting mathematical link that connects such malignancies with city growth—the fractal dimension. This topic will be mentioned in Chapter 18, and more details will be found in Appendix 9. For now, a few aspects of this analogy will be noted. The degree of border irregularity of a malignant melanoma, for example, is generally much higher than that for a benign lesion (and it carries over to the cellular level also). This is an important clinical feature in the diagnosis of such lesions, and it is perhaps not surprising that city “boundaries” and skylines are also highly irregular (in the sense that their fractal dimension is between one and two). This of course is not to suggest that the city is a “cancer” (though some might disagree), but it does often possess the four characteristics mentioned above for malignant neoplasms. The question to be answered is whether this analogy is useful, and in what sense. We shall not return to this question, interesting though it is, instead we will end this chapter by examining a decidedly nonfractal city boundary!
X = L: A CITY PERIMETER
In Greek mythology, Dido was a Phoenician princess, sister of Pygmalion, King of Tyre, and founder of the city of Carthage in northern Africa in 814 B.C. According to tradition, she did this in a rather unusual way. Pygmalion had her husband, Sychaeus, killed, and Dido fled to the northern coast of Africa. According to some, her brother agreed to let her have as much land as she could enclose within the hide of a bull; according to others, she bartered with the locals to accomplish this. She then cut the hide into a series of thin strips, joined them together, and formed a semicircular arc, with the Mediterranean Sea effectively as a diameter, thus enclosing a semicircular area [4]. Bravo! As we shall note in Appendix 1, given a straight boundary (as assumed in this story), a semicircle will contain the maximum area for a given perimeter, so Dido achieved the best possible result!
I grew up the son of a farm-laborer and had the occasional less-than-pleasant encounter with a certain bull; although he was British he was certainly not a gentleman. Here’s how the mathematics might have gone. Imagine the typical bull torso to be a rectangular box 5 ft long by 4 ft high by 2 ft wide. (Yes, that’s correct, we’ve cut off his legs, head, and tail, but only in our imagination.) The surface area of our bull-box is readily shown to be about 80 sq ft. We’ll round this up to 100 sq ft since we’re only interested in a rough estimate. And anyway, given how shrewd Dido appeared to be, no doubt she would have picked the biggest bull she could find! I don’t know what kind of precision Dido or her servants might have had with the cutting tools available but I’m going to assume that strips could be cut as narrow as one hundredth of a foot (0.12 in, or about 3 mm). This may be an underestimate, but it makes the arithmetic easier without changing the “guesstimate” by much. If the total length of the strips is L ft, then we have a simple equation for the area: 0.01L ≈ 100, or L ≈ 104 ft. This length would comprise the semicircular part of the city boundary. For a radius r ft,
![]()
where A is the area of the “city.” Hence
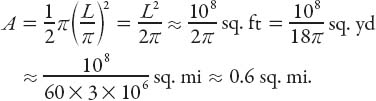
This is about 1.6 km2. That’s pretty impressive for a load of bull! If the boundary were circular instead of semicircular, the corresponding area would be half this amount, or about one third of a square mile. In Appendix 2 we shall generalize this idea to the case in which the boundary is of variable length l < L.
X = V: A CITY SIZE AND VOLUME
Let’s return to part of the quotation from John of Patmos (stated at the beginning of this book). He was in exile on the island of Patmos, off the west coast of Turkey, probably around 90–95 A.D. Recall that, according to one translation, “He found out that the city was as wide as it was long and it was as high as it was wide. It was as long as a man could walk in fifty days.” Another translation says that “it was twelve thousand furlongs in each direction, for its length, breadth and height are all equal.” A furlong is 220 yards, there being eight in a mile, so the city was a cube 1,500 miles on a side. Perhaps with windows and doors and open spaces it was like a Menger sponge! (See Appendix 9.)
Question: How far might an adult walk in those days without the benefit of modern transportation?
I want to estimate this one! At 3 mph for 10 hours, 30 miles a day for 50 days is, guess what, 1,500 miles!
Question: What was the volume of the heavenly city in John’s vision? In cubic miles? In cubic kilometers? In cubic furlongs? Estimate how many people it could accommodate.
An estimation question that can be generalized from the rest of the quotation—the number of leaves on a tree—can be found in Chapter 5.