Chapter 21
Image Rejection
One of the topics covered in this chapter is a quick review of image signals. These are radio-frequency (RF) signals within the band of interest that can mix into the intermediate-frequency (IF) stages and cause interference in the manner of having two radio stations’ signals demodulated at the detector or having a single station that pops up in two places within the band. We will examine how image signals are reduced via tuned circuits from the beginning days of the superheterodyne radio to using I and Q signals in an image reject mixer. Finally, an image-rejection mixer using I and Q signals will be analyzed.
Therefore, the objectives of this chapter are
1. To explain image signals
2. To show methods to reduce image signals in a superheterodyne radio
3. To analyze image-reject mixers and the advantages of using I and Q signals to select either or both desired and image signals
Although image signals have been discussed previously, this chapter will show a very detailed analysis of the image-reject mixer with I and Q signals. In essence, the last portion of this chapter is a continuation of Chapters 15 and 16. For readers who did not go through the previous chapters that mention image signals, that’s okay. This chapter is written to stand on its own.
What Is an Image Signal?
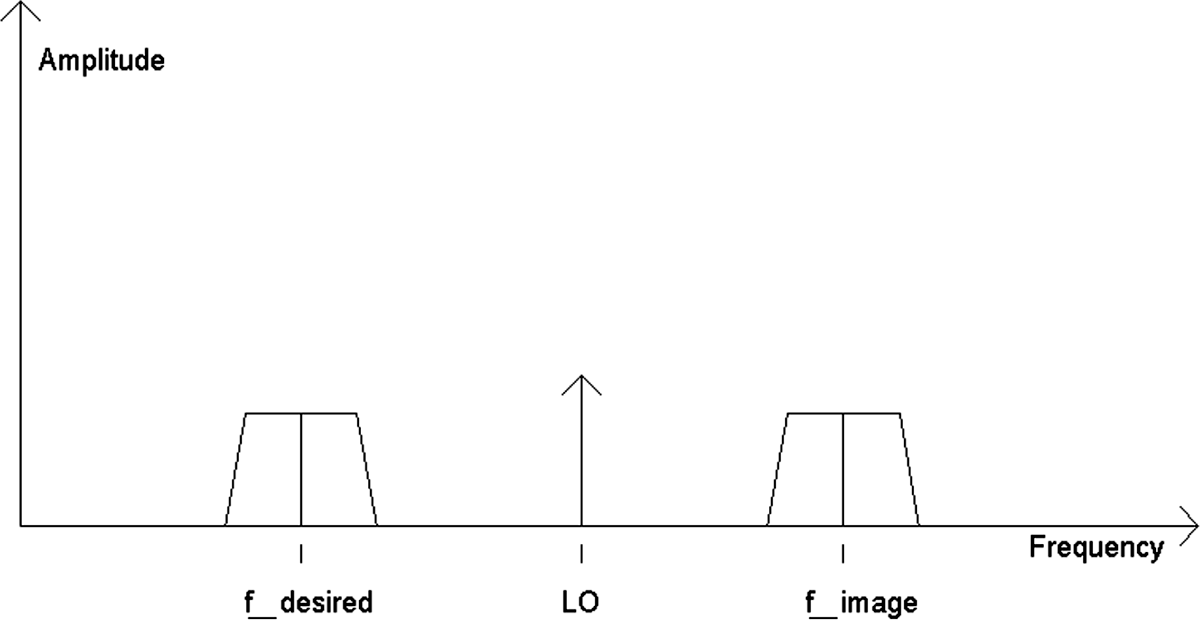
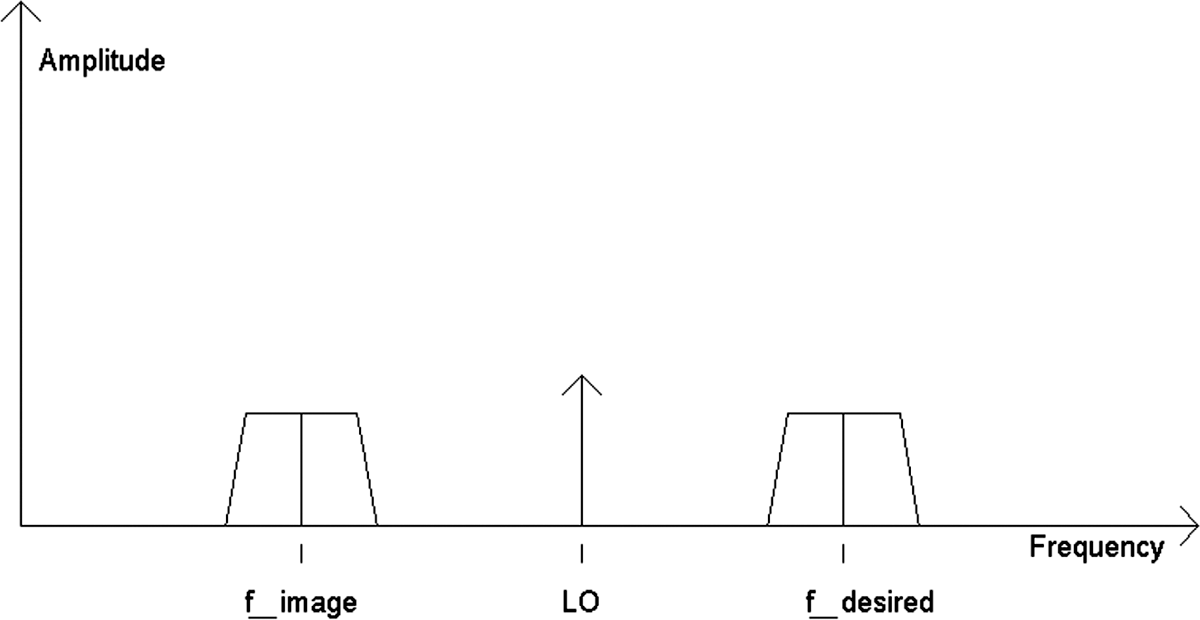
In a superheterodyne radio, an image signal is the signal whose frequency is the tuned RF signal frequency plus or minus twice the intermediate frequency. The local oscillator’s frequency is halfway between the tuned RF signal and the image signal (Figures 21-1 and 21-2).
FIGURE 21-1 Spectrum of the image signal defined whose frequency is above the LO, local oscillator’s frequency.
FIGURE 21-2 Spectrum of the image signal defined whose frequency is below the LO, local oscillator’s frequency
In Figures 21-1 and 21-2, the image signal thus is down-converted to the same IF band pass as the (desired) tuned RF signal. For example, in this chapter, the local oscillator frequency will be higher than the frequency of the incoming RF signal. Thus, for analysis, Figure 21-1 “defines” the image signal that has a frequency above the local oscillator’s frequency.
In the early days of frequency modulation (FM) radios, the frequency of the local oscillator (LO) was 10.7 MHz below the desired tuned RF signal, wherein the intermediate frequency was 10.7 MHz. Therefore, the image frequency would be located 10.7 MHz below the local oscillator’s frequency. Figure 21-2 shows a general example of image frequencies located below the local oscillator’s frequency. However, for this chapter, the image frequency is defined to be above the local oscillator’s frequency.
In other radios, such as tuned radio-frequency (TRF), regenerative, and direct-conversion radios (zero-frequency IF), the image signal does not exist. The TRF and regenerative radios do not employ oscillators for mixing. In a direct-conversion radio, the incoming RF signal is mixed with exactly the same frequency as the carrier from the transmitter end, and thus the radio also does not have any image-signal problem. Therefore, image signals exist mainly in single-conversion superheterodyne receivers, where there is an RF signal that is multiplied or mixed by the local oscillator’s signal.
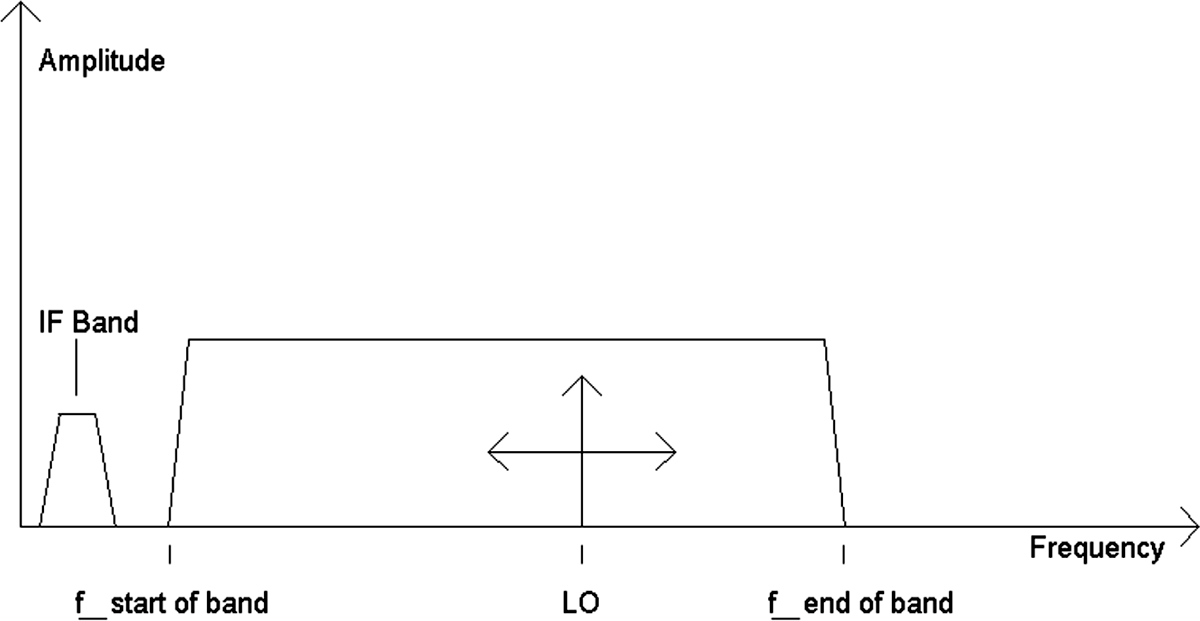
Figure 21-3 shows the frequencies of “vulnerability” that result in image signals when the local oscillator’s frequency is within the RF band of interest. The figure shows an example RF band of interest, such as the amplitude-modulation (AM) radio band from 540 kHz to 1,600 kHz. Also inserted is the local oscillator frequency, which can vary from about 995 KHz to 2,055 kHz. As the local oscillator’s frequency is varied, as long as there is a frequency space that exists 455 kHz above the oscillator frequency within the RF band of interest, image signals will exist. Fortunately, these image signals are reduced in amplitude sufficiently by a single-inductor capacitor–tuned circuit prior to mixing or converting.
FIGURE 21-3 The RF band of interest and the local oscillator’s frequency range.
For those who have never heard image signals in an AM radio, one can try an experiment. In older 1960s to 1980s portable (e.g., shirt-pocket) AM/FM transistor radios where the components are exposed when the back is removed, there is access to the primary winding of the AM ferrite antenna coil which is connected to the variable capacitor (Figure 21-4). With a soldering pencil, temporarily desolder the antenna coil lead to the tab of the variable capacitor. When the radio is turned back on, there is a good chance that stations that are broadcasting from 1,450 kHz to 1,600 kHz can be received when tuning to 540 kHz to 690 kHz on the radio dial. In addition, these stations can be received when tuned to 1,450 kHz to 1,600 kHz. Of course, the radio can be returned to normal operating condition by resoldering the antenna coil lead. When this is done, the tuned RF band-pass circuit/filter is activated again, and the image signals will no longer be received in the 540-kHz to 690-kHz range.
FIGURE 21-4 An AM/FM radio with the antenna coil winding accessible for desoldering from its variable capacitor.
This experiment can be done with a single-band AM transistor radio. However, to desolder the antenna coil lead located on the bottom side of the printed circuit board, usually the printed circuit board must be removed from its case by taking out the mounting screws.
Methods to Reduce the Amplitude of the Image Signal
One or more band-pass variable-tuned filters were used originally to reduce the amplitude of the image signals in a superheterodyne receiver. As mentioned previously, in the 1930s or earlier with low IFs such as 130 kHz and below, multiple stages of RF band-pass and/or band-reject filters were used to remove the reception of image signals. Eventually, simply by raising the IF.intermediate frequency to 455 kHz, a single, tunable band-pass filter proved sufficient to solve the problem of image signals.
Therefore, reducing image signals requires one or more variable tuned circuits such as two sections of band-pass filtering. However, with multiple stages of variable-frequency band-pass filters, tracking throughout the tuning range between the variable capacitor sections becomes difficult. Another method was shown in Chapter 11 when the IF was raised to at least 600 kHz, and a steep roll-off low-pass filter at 1,600 kHz was used to prevent reception of image signals.
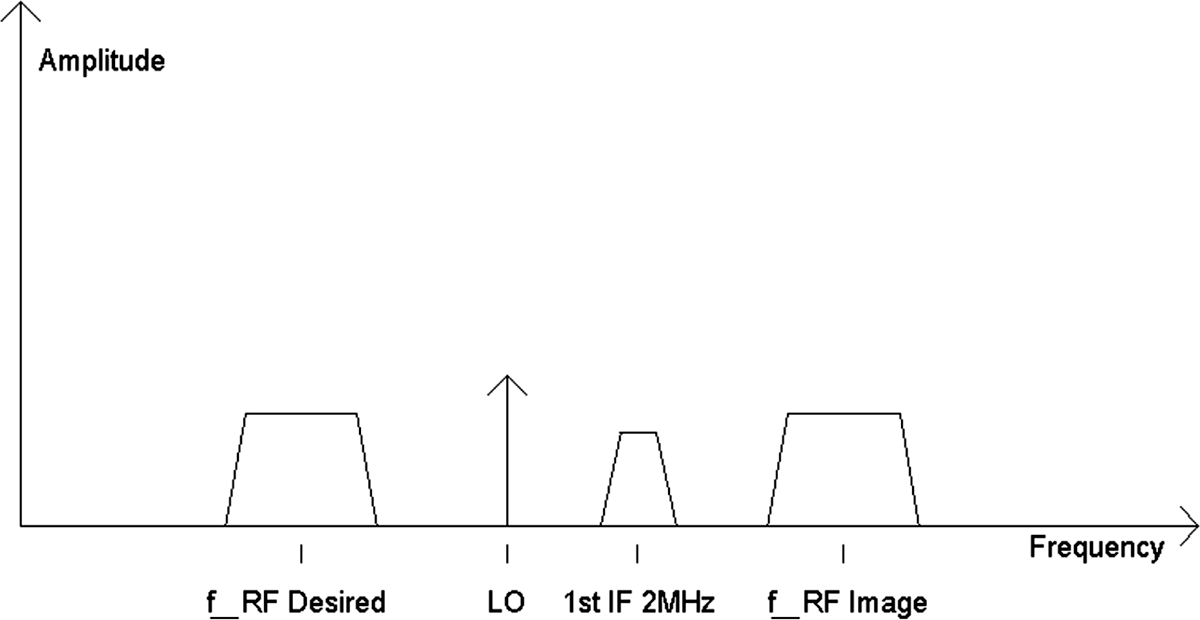
In Figure 21-3, it was shown that if the local oscillator’s frequency falls within the RF band of interest, and if there is enough “room” frequency-wise in that RF band above the local oscillator’s frequency, image signals can exist. Thus one method to remove image signals is to set the local oscillator signal beyond the highest RF signal of interest. This method includes double-conversion mixer circuits. A first mixer up-converts the incoming RF signal to a higher-frequency band beyond the original RF signal’s spectrum. A second mixer then translates or mixes the output signal from the first mixer back down to an IF such as 450 kHz. Figure 21-5 shows a redrawn version of a double-conversion superheterodyne receiver from Robert L. Shrader’s book, Electronic Communication, sixth edition (New York: Glencoe/McGraw-Hill, 1996). Also, Figure 21-6 shows a spectrum diagram of the up-conversion of the RF band and how image signals are handled.
In Figure 21-5, the RF spectrum of interest (e.g., the AM band, 540 kHz to 1,600 kHz) is up-converted to a high-frequency IF signal of 2 MHz. For example, the first local oscillator may have a range of 2.54 MHz to 3.6 MHz such that the difference frequency out of the first mixer is 2 MHz. When the local oscillator is at 2.54 MHz to 3.6 MHz, the image frequencies that are possible to mix or convert back to the 2-MHz IF are signals in the range of 4.54 MHz to 5.6 MHz (see Figure 21-6).
FIGURE 21-5 A redrawn partial block diagram of a double-conversion radio from Electronic Communication.
FIGURE 21-6 Spectrum of the up-converted signals, local oscillator frequencies, and possible image-signal frequencies.
By up-converting the original RF band of interest to a higher IF frequency, the new image signals are at frequencies that are easily filtered from the front end of the receiver. For example, a low-pass filter at 1.7 MHz that does not have to be variably tuned can be used instead of the usual tunable band-pass filter. In any event, none of the image-frequency signals from the up-converted process are from the original RF band of interest.
Analysis of an Image-Rejection Mixer Using I and Q Signals
For IFs that are very low, such as near direct current (DC) to about 200 kHz, rejecting the image signal becomes a larger problem if variable-tuned band-pass filters are used. For example, having an IF of 20 kHz results in an image signal just 40 kHz away from the desired signal. If the RF signal is at 1,000 kHz and the local oscillator frequency is at 1,020 kHz, the image signal will be at 1,040 kHz. An LC band-pass filter with a 10-kHz bandwidth to recover 5 kHz of audio information will require a Q of 100, which is “difficult” but workable.
Recall from Equation (20-14) that the attenuation factor from the center or resonant frequency is
![]()
At 1,000 kHz, a Q of 100 yields a bandwidth (BW) of 10 kHz. Therefore, 0.5BW = 5 kHz.
However, the attenuation factor of the image signal at 1,040 kHz is about 5 kHz/40 kHz = 0.125 = 12.5 percent, which is insufficient attenuation for a 20 kHz IF. In a system using a 455-kHz IF, the image signal has an attenuation factor of about 5 kHz/910 kHz = 0.0055 = 0.55 percent, which is acceptable. An attenuation factor of 2 percent or lower is sufficient.
Another way to attenuate image signals is to use an image-reject mixer that requires two IF signals. These two IF signals have the same amplitude but are phase-shifted in reference to each other by 90 degrees.
As stated previously, for the analysis on how an image-reject mixer works, the local oscillator frequency is always higher in frequency than the desired signal’s frequency, and the image signal’s frequency is above the local oscillator frequency (see Figure 21-1).
Analyzing the image-reject mixer requires three signals to be examined: the desired signal, the local oscillator signal, and the image signal. The question that summarizes the idea behind a image-signal-rejection mixer is simple: How does a circuit differentiate the image signal from the desired signal after both signals have been down-converted to the intermediate frequency?
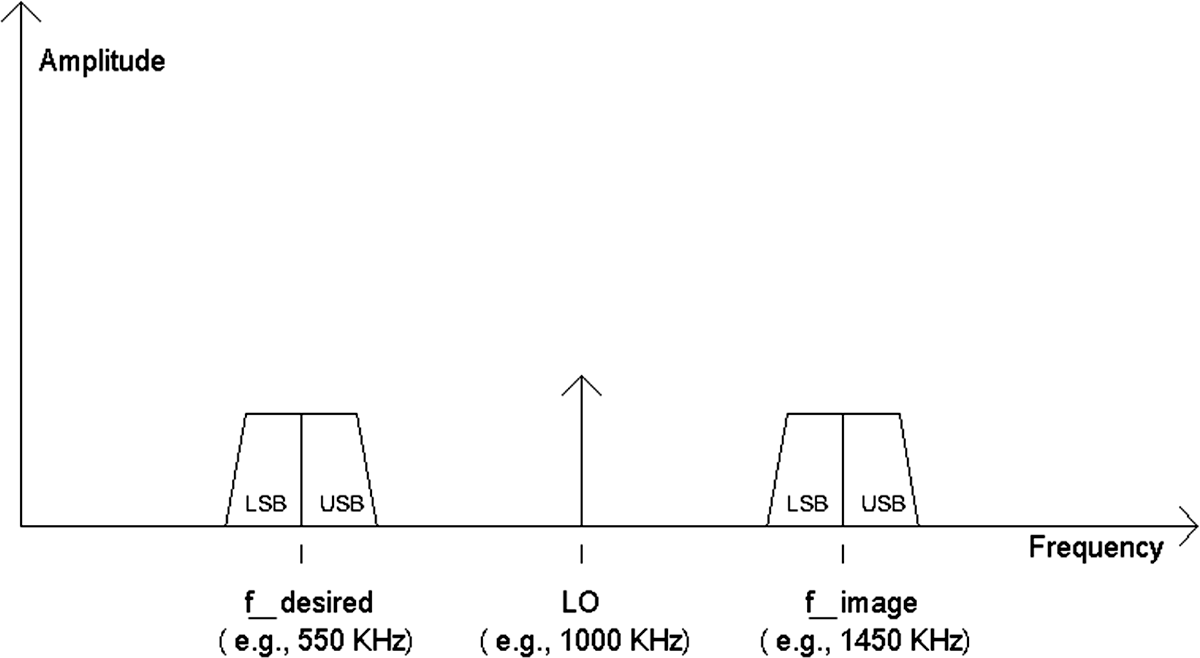
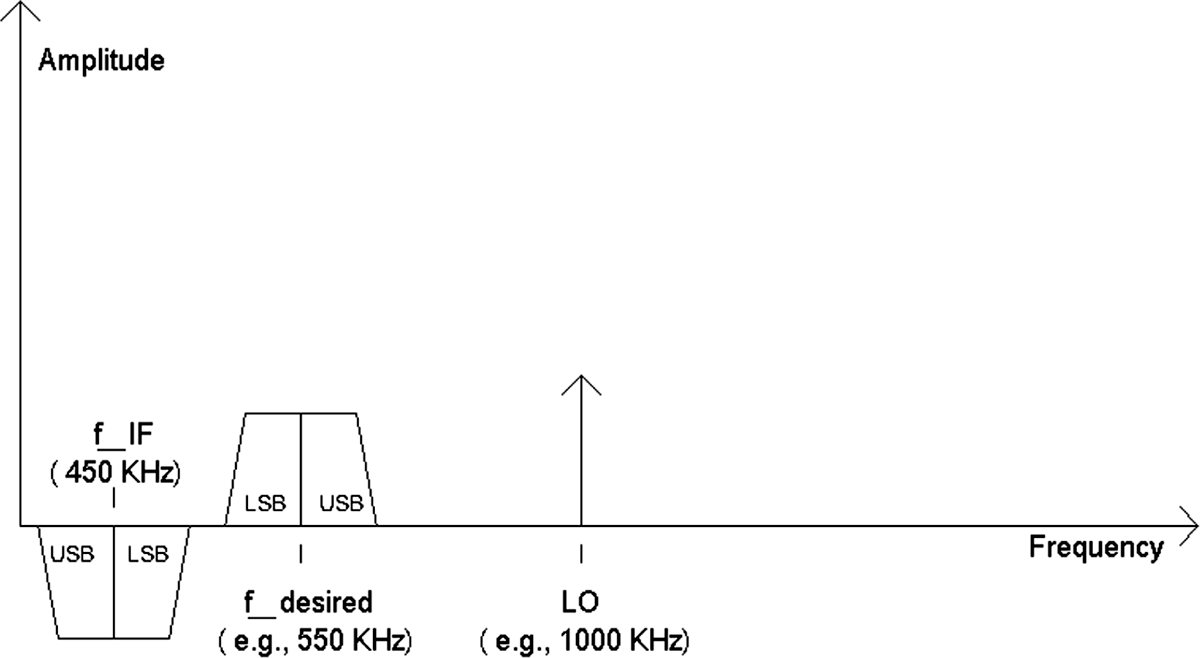
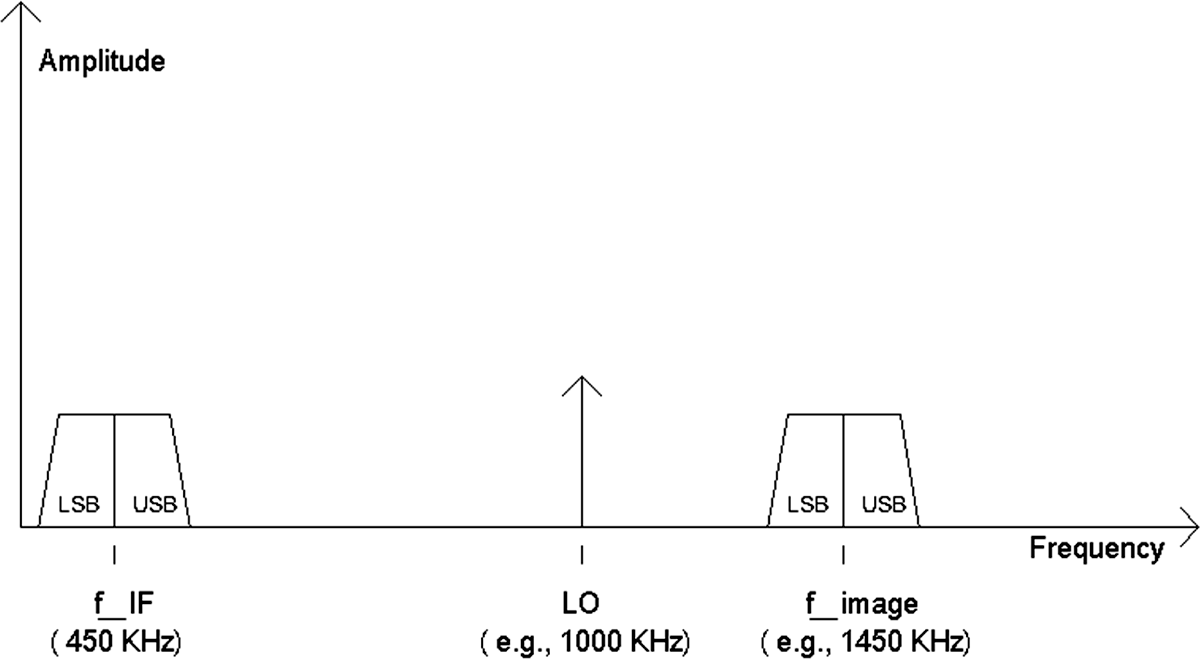
If one looks at the IF signal in terms of the desired signal, the upper and lower sidebands have been swapped, whereas the image signal’s sidebands are the same even when down-converted to the IF signal. So there is a difference between the two IF signals (Figures 21-7, 21-8, and 21-9). (Note: LSB = lower sideband and USB = upper sideband.)
FIGURE 21-7 An example spectrum showing the frequencies of the desired signal, local oscillator signal, and image signal.
FIGURE 21-8 The spectrum of the desired signal that has been down-converted to or mixed to the intermediate frequency.
FIGURE 21-9 The spectrum of the image signal that has been down-converted to or mixed down to the intermediate frequency.
Figure 21-7 shows an example spectrum of the three signals that are used in mixing down to an intermediate frequency. For now, a specific example is shown. For ease of arithmetic analysis, the intermediate frequency is set at or defined to be 450 kHz. (Note: Intermediate frequencies for standard AM radios were not always set to 455 kHz; there were slight variants at 450 kHz and 460 kHz.) As shown, the desired signal is centered at 550 kHz, with its lower-sideband limit at 545 kHz and its upper-sideband limit at 555 kHz. The local oscillator is set at 1,000 kHz, and the image signal’s center frequency is 1,450 kHz, with the image signal’s lower-sideband limit at 1,445 kHz and its upper-sideband limit at 1,455 kHz.
Figure 21-8 then shows what happens when the desired signal is mixed (multiplied) with the local oscillator’s signal, and the resulting difference-frequency signal is taken as the IF signal. This IF signal has a range from 445 kHz to 455 kHz with the center at 450 kHz, the intermediate frequency (IF). The mixed-down IF signal is first phase-inverted, which will be shown later with trigonometric identities, but the IF signal also is inverted in spectrum. By spectrum inversion, it is meant that the upper-sideband signals and lower-sideband signals switch places. For example, the upper-sideband frequency of the desired signal is 555 kHz. Therefore, with a 1,000-kHz oscillator signal, the 555-kHz upper-sideband signal is mapped to 1,000 kHz – 555 kHz = 445 kHz. Likewise, the lower-sideband signal at 545 kHz is mapped to 1,000 kHz – 545 kHz = 455 kHz. Thus the IF signal for the desired signal starts with the upper-sideband signal at 445 kHz and ends with the lower-sideband signal at 455 kHz. The swapping effect of the sidebands is called spectrum inversion.
Spectrum inversion is also used in simple audio scrambling processes. The audio signal’s low frequencies are mapped to a higher frequency, and the audio signal’s high frequencies are mapped to a lower frequency. In this type of audio scrambling, the signals for bass frequencies are converted (frequency translated) to treble frequencies and vice versa.
Figure 21-9 shows that the 450-kHz IF signal related to the image signal maintains lower- and upper-sideband integrity, so there is no sideband swapping. Also, there is no inversion, which is due to the trigonometric identities. For example, the lower-sideband frequency of the RF signal is at 1,445 kHz. When this signal is mixed with the oscillator signal, the resulting frequency in the IF band is 1,445 kHz – 1,000 kHz = 445 kHz. And similarly, the upper-sideband signal, when mixed with the oscillator signal, yields a frequency of 1,455 kHz – 1,000 kHz = 455 kHz. Thus the IF signal relating to the image signal has a frequency range of 445 to 455 kHz, with its lower-sideband frequency at 445 kHz and its upper-sideband frequency at 455 kHz, which then maintains spectrum integrity of the sidebands.
Because of trigonometric identities such as sin(–x) = – sin(x) and cos(–x) = cos(x), the other difference is that one of the IF signals will be “inverted” in phase relative to the other IF signal. Also, see Figures 15-15 and 15-17, which show an inverting effect when (RF) signals are mixed or sampled at frequencies slightly above and below the sampling frequency.
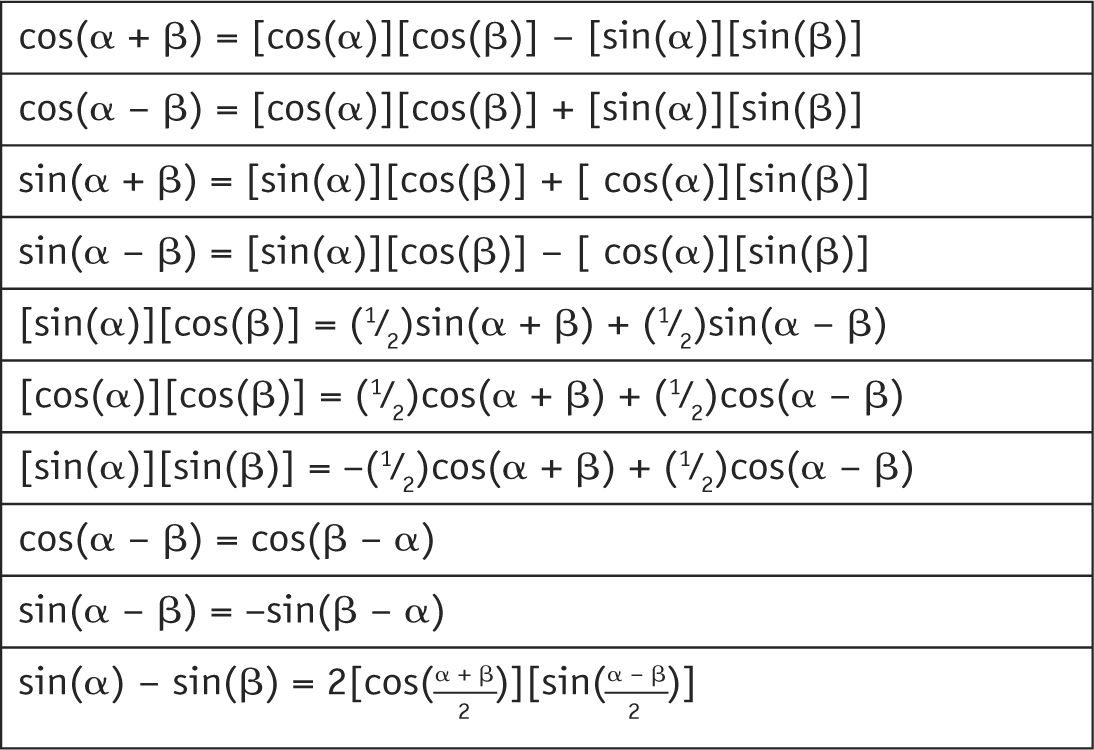
Since the analysis of the image-reject mixer will involve a multitude of sine and cosines, Table 21-1 presents a list of trigonometric identities.
Table 21-1 Trigonometric Identities
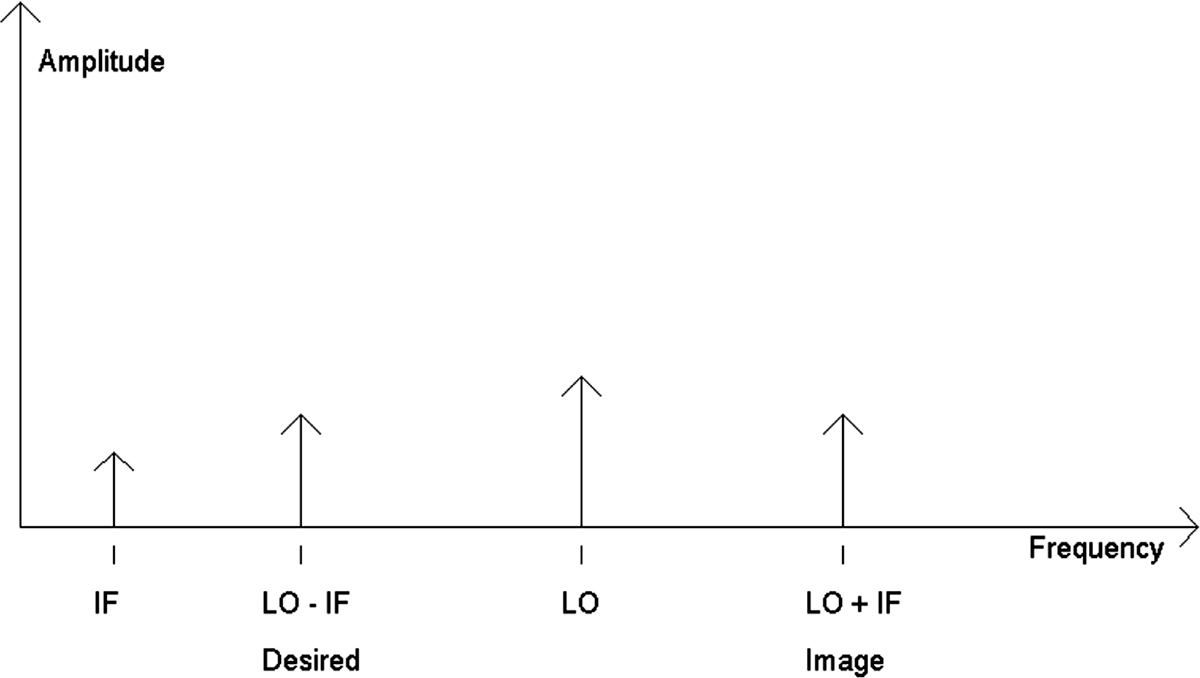
Figure 21-10 shows the spectrum of the three signals and the IF signal as tones (single-frequency signals). In Figure 21-10, with the local oscillator’s frequency = fLO, the desired signal’s frequency will be (fLO – fIF), and the image signal’s frequency will be (fLO + fIF).
FIGURE 21-10 A general spectrum of signals needed for analyzing how image-reject mixers operate.
Analysis of the Image-Reject Mixer
The analysis of the image reject mixer will be explained in two parts. The first part will cover the outputs of I and Q channels, and the second part will combine the two channels together with one channel processed with a 90-degree phase shift to provide cancellation of the image signal.
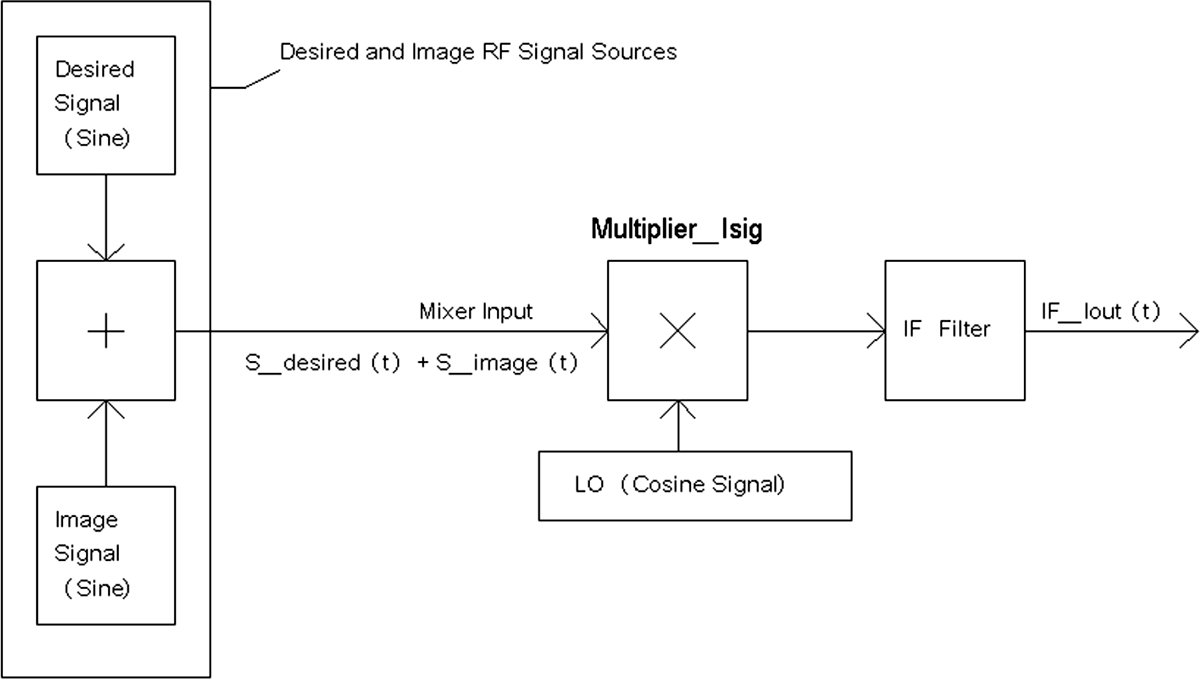
Figure 21-11 shows the basic flow of signals into a “traditional” mixer to provide two IF signals. This system does not reject the image, but it illustrates the phases of the two IF signals.
FIGURE 21-11 The image and desired signals are combined to a conventional mixer for providing IF signals.
In Figure 21-11, a desired signal S_desired(t) and an image signal S_image(t) are combined, usually by reception of the RF signals. The combination of S_desired(t) and S_image(t) are then mixed via a multiplier with a local oscillator signal LO(t). The output of the mixer then is filtered to pass on only the difference-frequency signal to provide the two IF signals. Let
![]()
Then the desired and image signals will be defined as follows:
![]()
![]()
The oscillator signal will be defined as
![]()
The input to the mixer is then S_des(t) + S_img(t), and the output of the mixer is


There are two products that concern sines and cosines; thus the following trigonometric identity will be used:
![]()
Also, since the IF filter will remove the summed frequency components (½) sin(α – β), only the difference-frequency signals (½) sin(α + β) will pass through the IF filter.
Thus, at the output of the IF filter, there are two IF signals:

Note that sin(–x) = –sin(x); therefore, at the output of the mixer IF_Iout(t), the two IF signals are
![]()
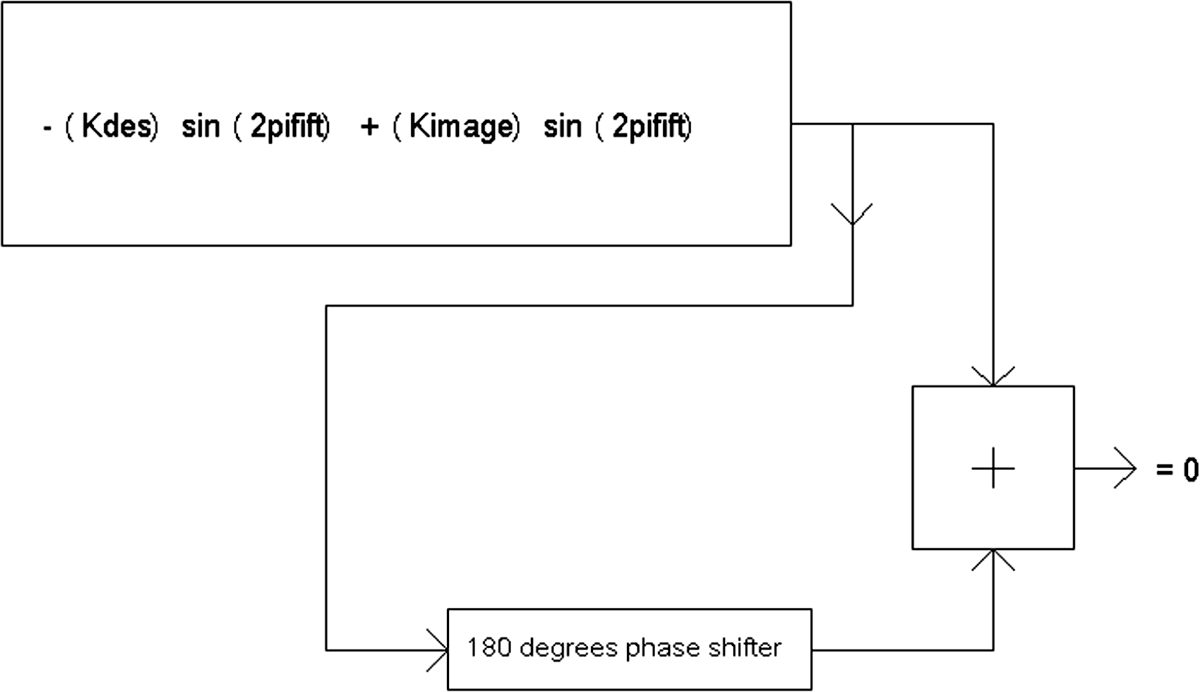
From the output of the mixer and IF filter, there is a sign change in the IF signal related to the desired signal compared with the IF signal related to the image signal. Can we somehow use this sign change advantageously to null one of the IF signals? For example, could a simple phase shifter as shown in Figure 21-12 work?
In Figure 21-12, unfortunately, when one of the IF signals is canceled out, so is the other. Thus the phase-shifting network does not work because we only want one of the signals canceled, not both.
FIGURE 21-12 Phase-shifting network and summing circuit.
However, we can take advantage of the two following trigonometric identities:
![]()
Note that there is no sign change in the cosine function compared with sin(–x) = –sin(x).
Now let’s take the same two signals below and use them in Figure 21-13:
![]()
![]()
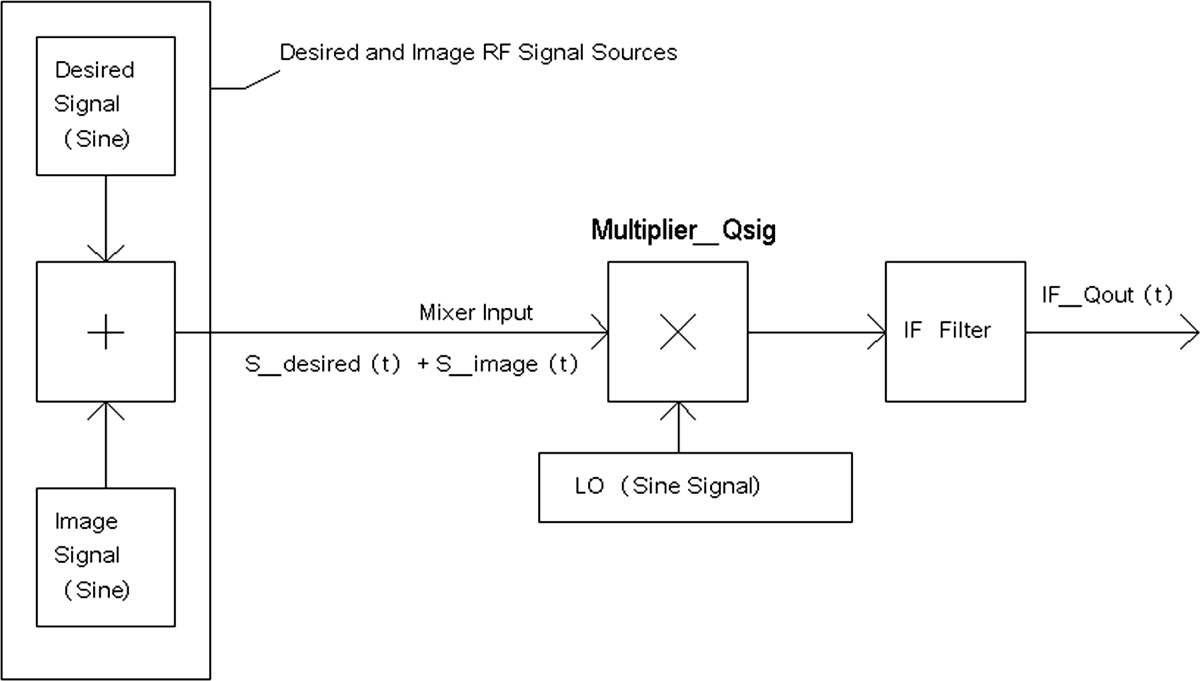
The circuits in Figure 21-13 are the same as the ones in Figure 21-11 except that the local oscillator signal now is a sine function instead of a cosine function. Thus the oscillator signal in Figure 21-13 is phase-shifted by 90 degrees when compared with the one in Figure 21-11.
FIGURE 21-13 A similar mixer and IF circuit as shown in Figure 21-11, but with a phase-shifted local oscillator signal.
Therefore, the output of the mixer in Figure 21-13 is

With the previously mentioned trigonometric identity, that is,
![]()
the output of the IF filter IF_Qout(t), which passes only the difference-frequency signals, is
![]()
and because cos(–x) = cos(x), we have
![]()
Now let’s compare the signals in Equation (21-6):
![]()
Also let

At this point in the analysis, by phase shifting either signal, IF_Qout(t) or IF_Iout(t), by 90 degrees and combining the two signals, extraction of the IF signal related just to the desired signal or just to the image signal can be implemented. Actually, if two combiners are used, one as a summer and another as a subtractor, both IF signals can be separated as an IF signal related to the desired signal and another separate IF signal related to the image signal.
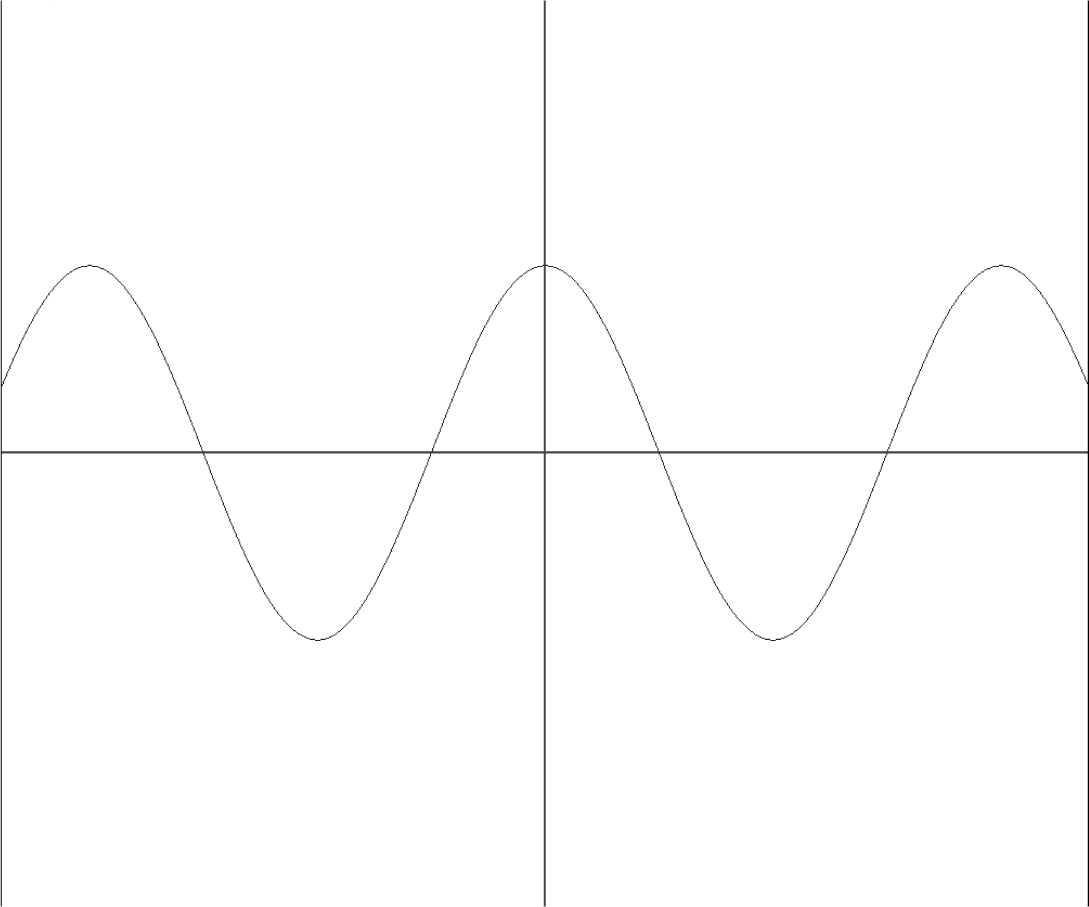
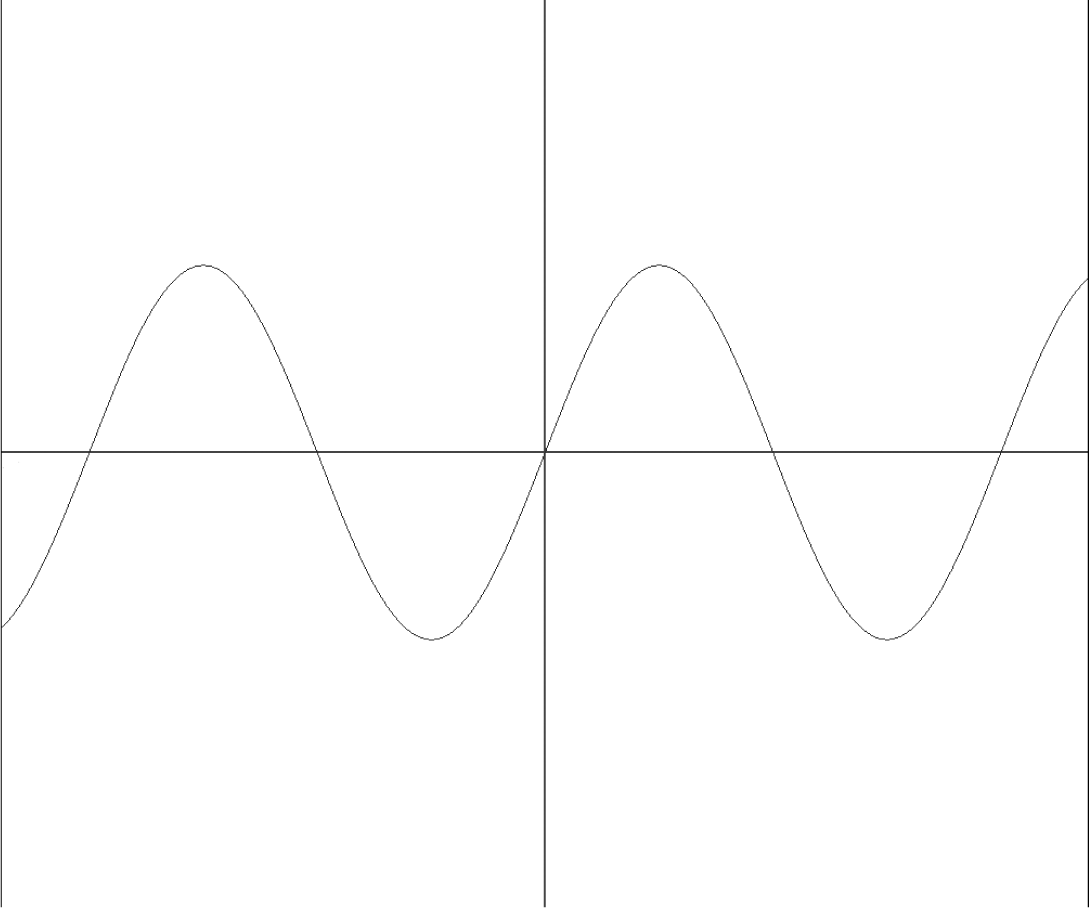
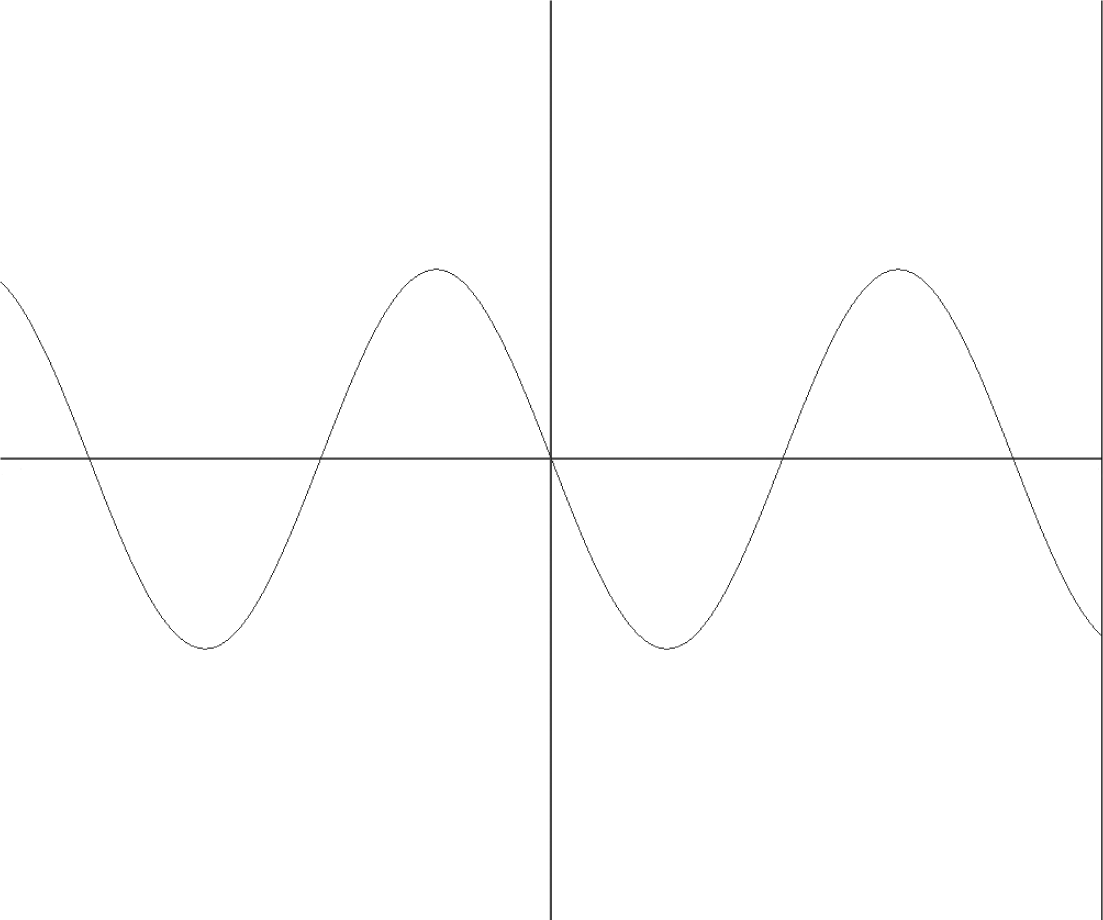
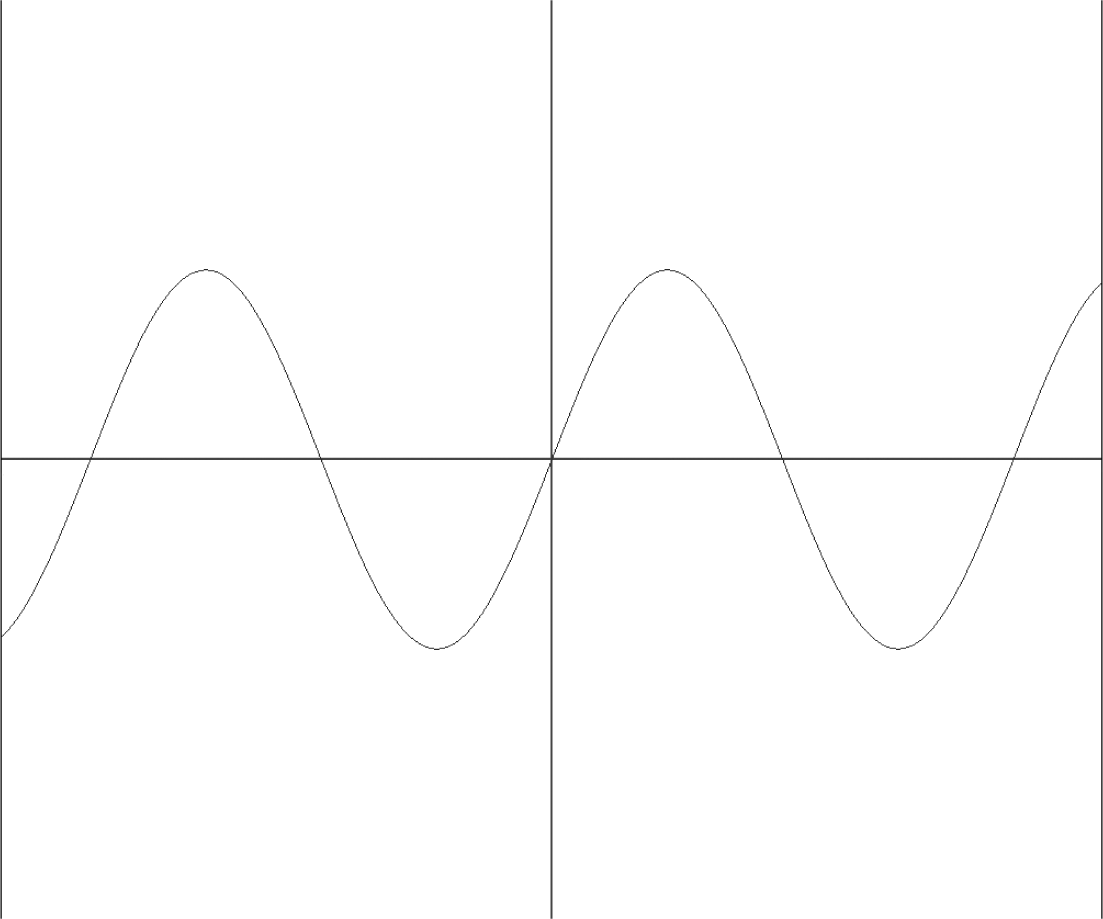
Before the complete image mixer is shown, let’s take a look at a phase-shifted cosine function. For any cosine function such as cos(x), a phase shift by a lagging 90 degrees = –π/2 results in a sine function, that is, cos[x (–π/2)] = sin(x); if the cosine function is phase-shifted by a leading 190 degrees = –π/2, then cos[x + (–π/2)] = –sin(x) (see Figure 21-14A, 21-14B, 21-14C, and 21-14D).
FIGURE 21-14A A cosine signal.
FIGURE 21-14B A phase-shifted cosine signal by –90 degrees.
FIGURE 21-14C A phase-shifted cosine signal by +90 degrees.
FIGURE 21-14D A sine signal.
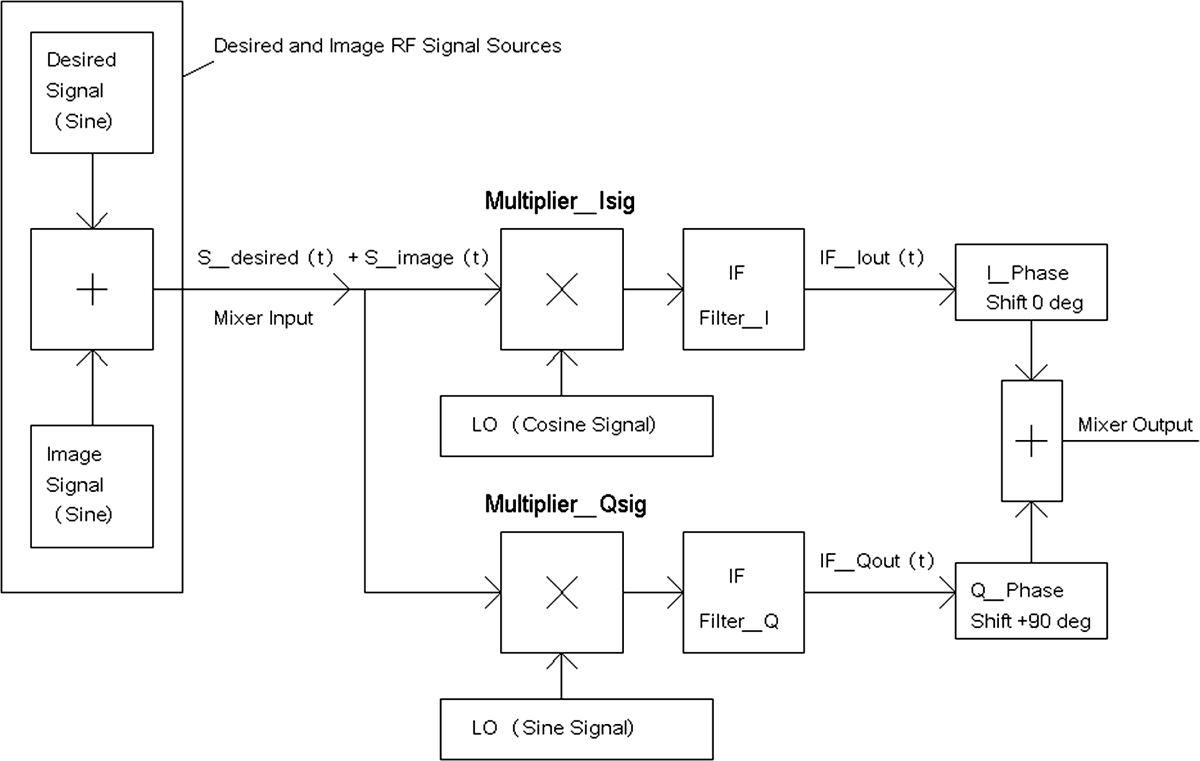
Now let’s combine the circuits from Figures 21-11 and 21-13 and include phase-shifting circuits or functions as shown in Figure 21-15 to form the complete image-reject mixer.
FIGURE 21-15 An image-reject mixer.
Referring to Figure 21-15, there is the signal IF_Iout(t) that is connected to a 0-degree phase shifter (I_Phase), which outputs the same signal IF_Iout(t) to the first input of the combiner or summer. The combiner provides the Mixer Output (see Figure 21-15) by summing the outputs from the phase shifters, I_Phase and Q_Phase.
![]()
The other signal, IF_Qout(t), is connected to a +90-degree phase-shifter circuit (Q_ Phase):
![]()
And the output of the +90-degree phase-shifter circuit provides a phase-shifted version of +π/2 of the signal IF_Qout(t), which is then
![]()
However, cos[x + (π/2)] = –sin(x). Therefore,
![]()
Combining Equations (21-6) and (21-8) results in

The result of adding the outputs of the 0- and +90-degree phase-shifting circuits provides an IF signal related to the desired signal at the output of the image-reject mixer.
Note the cancellation of the IF signals related to the image signal:
![]()
and
![]()
Given the two signals,
![]()
![]()
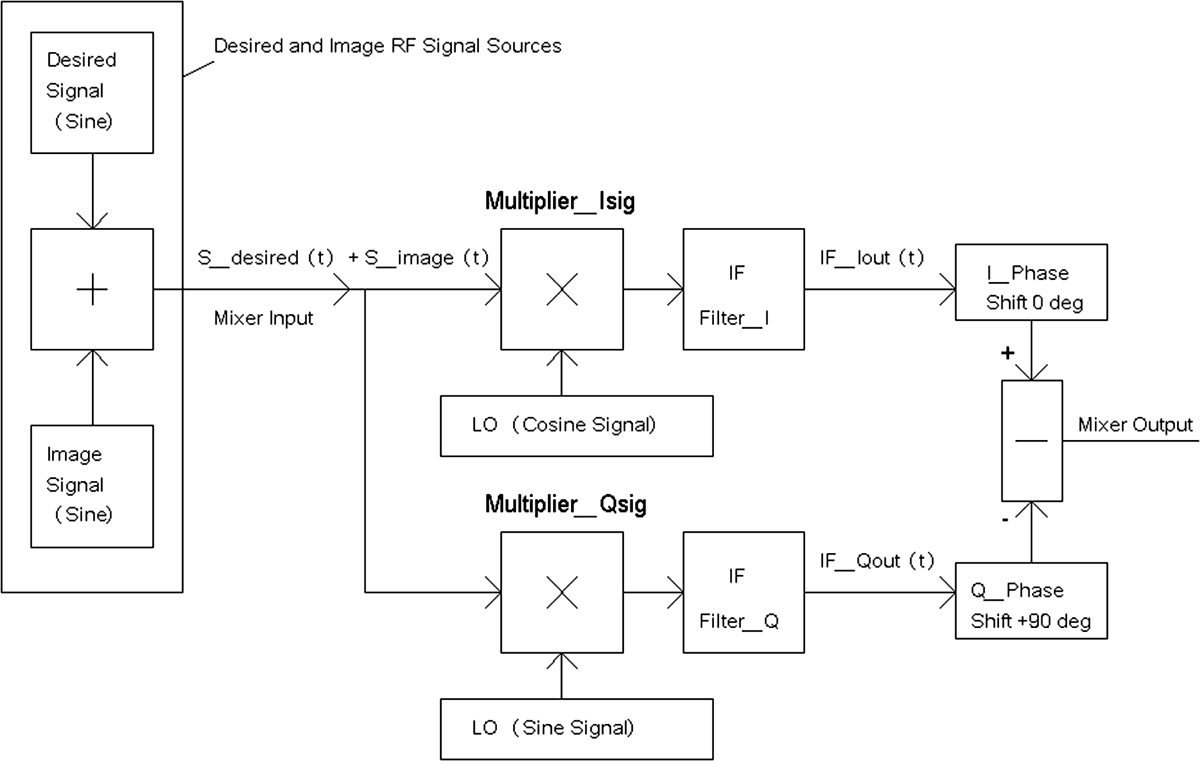
If we subtract the two equations by using a subtractive circuit or function, as shown in Figure 21-16, the IF signal related to the desired signal will be canceled out, and the IF signal related to the image signal will be provided instead.
FIGURE 21-16 A subtractive circuit following the phase-shifting networks provides an IF signal related to the image signal.
Two minuses = a plus! That is,
![]()
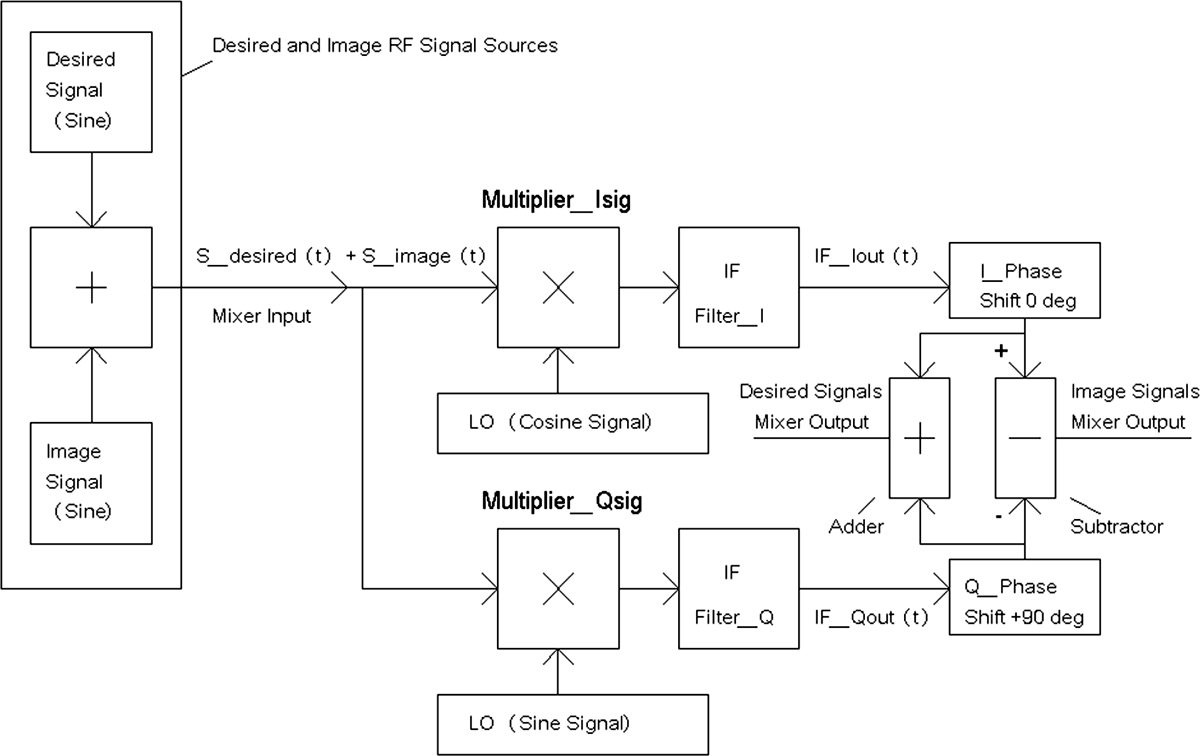
With a summing and subtracting circuit, the image-reject mixer can separately retrieve or extract RF signals above and below the local oscillator’s frequency (see Figure 20-17).
FIGURE 21-17 An image reject mixer that extracts desired and image signals separately.
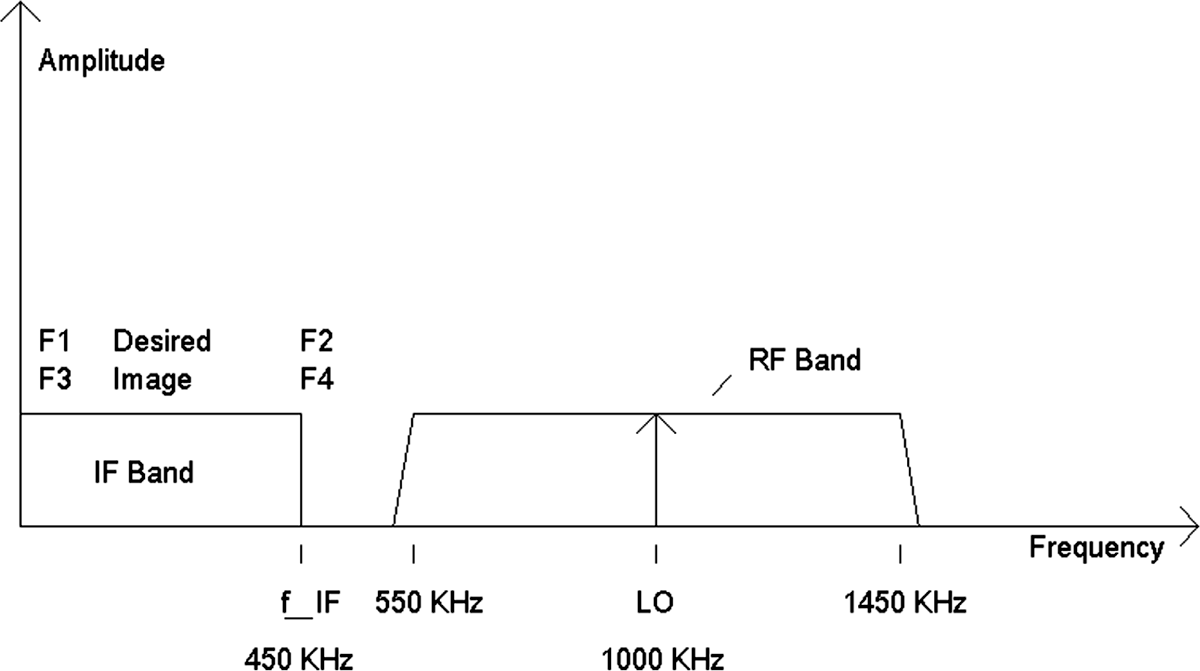
What is more serendipitous about retrieving signals from both sides of the local oscillator signals is that if the IF filter is a low-pass filter instead of a typical band-pass filter, the image-reject mixer can output two signals, each with a spectrum as wide as an IF low-pass filter. For example, suppose that both IF filters in Figure 20-17 are 470-kHz low-pass filters and the local oscillator is set at 1,000 kHz. Out of the summing combiner will come an IF signal covering a bandwidth of 470 kHz, which contains signals of frequency-translated versions of the “desired” RF signals from 1,000 kHz to 530 kHz. Then, out of the subtracting circuit will come an IF signal also covering a bandwidth of 470 kHz, which contains signals of frequency-translated versions of the “image” RF signal from 1,000 kHz to 1,470 kHz (see Figure 20-18).
FIGURE 21-18 Spectrum of separately retrieved IF signals related to desired and image signals.
In Figure 21-18, the desired signals below the local oscillator’s frequency of 1,000 kHz, 550 kHz to 1,000 kHz, are mapped to the IF band from frequencies F1 to F2. Frequency F1 represents the down-converted desired RF signal frequency near (or just below) 1,000 kHz, whereas frequency F2 represents the down-converted desired RF signal at the bottom end of the RF band at 550 kHz. Similarly, the image signals are retrieved separately, and frequency F3 represents the down-converted image RF signals near (or just above) 1,000 kHz, whereas frequency F4 represents the down-converted image RF signal at the top of the RF band at 1,450 kHz.
Even though in this example the IF bandwidth is 450 kHz, the actual bandwidth of the recovered signals is twice 450 kHz because the information from 550 kHz to 1,000 kHz is extracted in one IF channel and the information from 1,000 to 1,450 kHz is retrieved in the second IF channel. Therefore, by using I and Q signals IF_Iout(t) and IF_Qout(t) in the image-reject mixer, twice the bandwidth of RF information can be recovered.
This feature of recovering twice the IF bandwidth of information is useful in software-defined radios (SDRs). For example, suppose that the IF filters are low-pass filters at 96 kHz each, and the I and Q signals, IF_Iout(t) and IF_Qout(t), are instead connected to the two audio channels of a computer’s 192-kHz sampling-rate sound card. A 192-kHz sampling rates results in maximum bandwidth of 96 kHz for each of the two sound channels. The software in the computer can emulate the phase shifter and combining functions to extract two separate 96-kHz IF signals to demodulate, which allows demodulating down-converted RF signals over a 192-kHz range. This 192-kHz range then includes related RF signals above and below the local oscillator’s frequency.
Consequences of an Imperfect 90-Degree Phase Shifter on Reducing the Image Signal
In practice, the 90-degree phase shifter is not always 90 degrees. The phase shifter may be 89 degrees or 91 degrees. So let’s examine what happens when there is a small phase error Δφ from the 90-degree phase shifter.
In the perfect case,
![]()
But suppose the cosine function is phase-shifted by (π/2) + Δφ instead? Then
![]()
How did Equation (21-10) come about? Let x~ = x + Δφ, and we know that
![]()
![]()
and by substitution of x~ = x + Δφ, we get
![]()
or
![]()
In Figure 21-15, suppose that the +90-degree phase shifter (Q_Phase) has a slight phase error of Δφ. The output of the phase shifter then will change from
![]()
to

The output of the 0-degree phase shifter in Figure 21-11 is
![]()
When Equation (21-6) is added to Equation (21-11) to yield a signal with a reduction in the IF signal related to the image signal, the result is

However, the trigonometric identity
![]()
says that

Substituting Equation (21-13) into Equation (21-12) yields
![]()
The amplitude to the IF signal related to the image signal is then
![]()
But for small angles in radians, Δφ<< 1,
![]()
Thus the amplitude related to the image signal is
![]()
and the magnitude related to the image signal is Kimg|–Δφ/2|. Thus, the attenuation factor of the image signal is |–Δφ/2|.
Given 57.3 degrees = 1 radian, then 1-degree-error Δφ is 0.0174 radian, which would mean that the IF signal-related image signal is multiplied by |–Δφ/2| = 0.0174/2 = 0.0087 = 0.87 percent, a reduction of the (image) signal by a factor 114.
For small errors in the phase-shifting network, the errors amount to an attenuation factor of approximately 1 percent per 1 degree of error. This means that if the error Δφ = 2 degrees (e.g., a 92-degree or 88-degree phase shifter instead of 90 degrees), the attenuation factor is 2 percent, or a reduction of 50 for the IF signal related to the image signal.
References
1. U.S. Patent 1,855,576, Clyde R. Keith, “Frequency Translating System,” filed on April 9, 1929.
2. U.S. Patent 2,086,601, Robert S. Caruthers, “Modulating System,” filed on May 3, 1934.
3. U.S. Patent 2,025,158, Frank Augustus Cowan, “Modulating System,” filed on June 7, 1934.
4. U.S. Patent 5,058,159, Ronald Quan, “Method and System for Scrambling and Descrambling Audio Information Signals,” filed on June 15, 1989.
5. U.S. Patent 5,159,531, Ronald Quan and Ali R. Hakimi, “Audio Scrambling System Using In-Band Carrier,” filed on April 26, 1990.
6. U.S. Patent 5,471,531, Ronald Quan, “Method and Apparatus for Low-Cost Audio Scrambling and Descrambling,” filed on December 14, 1993.
7. U.S. Patent 6,091,822, Andrew B. Mellows, John O. Ryan, William J. Wrobleski, Ronald Quan, and Gerow D. Brill, “Method and Apparatus for Recording Scrambled Video Audio Signals and Playing Back Said Video Signal, Descrambled, Within a Secure Environment,” filed on January 8, 1998.
8. Kenneth K. Clarke and Donald T. Hess, Communication Circuits: Analysis and Design. Reading: Addison-Wesley, 1971.
9. Thomas H. Lee, The Design of CMOS Radio-Frequency Integrated Circuits, 2nd ed. Cambridge: Cambridge University Press, 2003.
10. Allan R. Hambley, Electrical Engineering Principles and Applications, 2nd ed. Upper Saddle River: Prentice Hall, 2002.
11. Robert L. Shrader, Electronic Communication, 6th ed. New York: Glencoe/McGraw-Hill, 1991.
12. Mischa Schwartz, Information, Transmission, and Noise. New York: McGraw-Hill, 1959.
13. Harold S. Black, Modulation Theory. Princeton: D. Van Nostrand Company 1953.
14. B. P. Lathi, Linear Systems and Signals. Carmichael: Berkeley Cambridge Press, 2002.
15. Alan V. Oppenheim and Alan S. Wilsky, with S. Hamid Nawab, Signals and Systems, 2nd ed. Upper Saddle River: Prentice Hall, 1997.
16. Howard W. Coleman, Color Television. New York: Hastings House Publishers, 1968.
17. Geoffrey Hutson, Peter Shepherd, and James Brice, Colour Television System Principles. 2nd ed. London: McGraw-Hill, 1990.
18. Mary P. Dolciani, Simon L. Bergman, and William Wooton, Modern Algebra and Trigonometry. New York: Houghton Mifflin, 1963.
19. Taiwa Tomiyama and Hiroshi Arimoto, “Advanced Low-Voltage Single Chip Radio IC,” IEEE Transactions on Consumer Electronics 38(3), August 1992.
20. John F. Rider, Servicing Superheterodynes. New York: John F. Rider, 1934.
