
3. Everyone Should Own a Home
The roots of the subprime financial shock begin in the American psyche and run through the typical household’s balance sheet. Most of us define financial success by the size and quality of our home. The pecuniary and psychological benefits we attach to home ownership are unique; no other country values hearth and home more highly. Most of us spend far more on housing than we do on anything else, and American wealth is critically linked to the home—a house is the typical family’s largest asset, and the mortgage is the largest liability.
Most economic policies since the Great Depression have been designed to help people acquire homes. Nothing receives more tax breaks than a house, from the ability to deduct mortgage interest and property taxes, to the low tax rate on the profits from a home sale. A host of government agencies and related institutions, such as the Federal Housing Administration (FHA), Fannie Mae, and Freddie Mac, exist to ensure that almost anyone who wants a home can own one.
The national obsession with home ownership reached a crescendo in this decade’s housing boom. Home sales, housing construction, and house prices surged nearly everywhere. Most of us understood that home prices wouldn’t go straight up forever, but many accepted the notion that they would never fall. At the height of the frenzy, we were all investing aggressively in our homes. We expected this to pay off big—certainly bigger than any other investment opportunities. We were all speculating.
Renters in places such as Los Angeles and Boston, who thought they’d never be able to own a home, were finally able to get in the door. Soaring house prices were no longer an impediment; a first-time home buyer could obtain a mortgage with little money down and a (just barely) low enough monthly payment. The loan might have been complicated and hard to understand, but lenders seemed sure it was affordable.
The market also brought trade-up buyers, people who had purchased their first home a few years earlier and now wanted something bigger. Others wanted to upgrade their current house, adding a bigger deck, a swimming pool, or a built-out basement. And why not? With real estate prices rising quickly and cheap credit readily available, didn’t it make financial sense to aggressively invest in your home? And with 9/11 just a recent memory, spending more time at home—in a bigger, better home—seemed the prudent thing to do.
Older people, especially higher-income baby boomers, were thinking ahead to their retirements. If they didn’t move quickly, that second home on the golf course or near the beach might soar out of reach. And with stocks gyrating in the wake of the tech bust, and CDs and money markets paying rock-bottom rates, where better to put your savings than in real estate?
On the far end of the market were so-called “flippers,” who bought and sold houses quickly for profit. They were pure speculators who cared nothing about home values beyond a few months into the future. No investment had offered better returns since the collapse of the Internet bubble, and all that easy credit meant you were putting someone else’s money at risk.
By summer 2005, the housing boom was at its apex. Nearly everyone believed there was no place like home. The housing market had come unhinged from the underlying forces that determine sales, construction, and house prices. The subprime financial shock, or something similar to it, was inevitable.
Hearth and Home
Outside of employment, nothing determines the economic well-being of most American households more than a house. Most of us spend as much on our home as our incomes and wealth allow. Substantial financial incentives—the most obvious being the tax code—enable this, although our preoccupation with houses is more deep-seated. Owning a home is a basic theme of nearly everyone’s American dream.
Perhaps the best measure of the nation’s economic success is the home ownership rate—the percentage of households who own their homes. From a historical perspective, we’ve done well. From just before World War II to 2005, the home ownership rate rose a stunning 25 percentage points.1 It rose even faster for groups with historically lower rates of home ownership, such as younger, African-American and Hispanic households.
After World War II, returning GIs took advantage of the period’s low borrowing costs and new, no-down-payment mortgages backed by the Veterans Administration (VA).2 Home ownership surged, rising from 44% of households in 1940 to 55% by 1950 (see Figure 3.1). The rate rose more slowly after that but still increased another 10 percentage points during the next quarter-century. A key factor was the expansion of the interstate highway system in the 1960s and 1970s, which helped turn millions of urban renters into suburban homeowners.
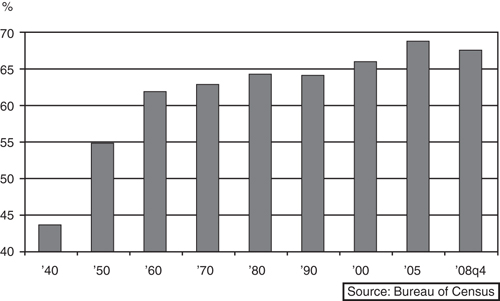
Figure 3.1 Steadily rising homeownership: the % of households that own their own homes.
Housing struggled during the 1980s and early 1990s. Double-digit borrowing costs and unemployment weighed heavily on home ownership early in the period. Then the savings and loan crisis and resulting credit crunch in California and the Northeast caused housing prices to fall sharply in these areas. The home ownership rate in 1995 was not much higher than in 1965.
In the late 1990s, however, falling mortgage rates, low housing prices, and rapidly increasing access to mortgage credit brought housing back to life. As the market grew increasingly frenzied after 2000, the home ownership rate rocketed higher. From 1995 to 2005, the home ownership rate jumped 5 percentage points to an all-time high of 69%.
No Place Like Home
A home is the largest budget item for most American households. From the mortgage payment and property taxes, to heating oil and furniture, the average family devotes a third of its spending to the house.3 Nothing else comes close, even cars. Most households own at least two vehicles, and purchase, operations, maintenance, and all other transportation-related costs account for only one-seventh of the average household budget. Food, including restaurant dining, accounts for one-tenth.
Spending on homes makes Americans unique. By comparison, households in New Zealand devote about a fourth of their budgets to housing. For French households, it’s a fifth, and only a seventh for the Japanese and Koreans.
Housing is equally important to rich and poor Americans. Spending on houses increases lockstep with incomes; the highest-earning homeowners devote as large a slice of their budgets to housing as do middle- and lower-income households. We spend as much on our homes as our incomes, wealth, and mortgage lenders will allow.
A home is most households’ largest asset. Collectively, homeowners owned $22 trillion in residential real estate at the peak of the housing boom in 2006.4 This was two and a half times the amount a decade earlier. Most of us finance our homes with mortgage loans, although a surprising one-fourth of homeowners owe nothing on their homes. Collectively, homeowners are on the hook for more than $10 trillion in mortgage debt. Homeowners’ equity—the value of all homes minus the mortgage debt owed on them—totaled about $12 trillion.
The average homeowner’s equity was $110,000 at the peak.5 Housing wealth is distributed relatively evenly; it’s not that a few wealthy homeowners own most of the equity. More than three-fourths of homeowners had equity worth more than $30,000. Housing wealth does vary substantially across the country. On the Monterey Peninsula in California, the average homeowner had more than $400,000 in equity, although homeowners in Indianapolis had only $25,000.
Although we seem to spend more time thinking about stocks, most of us shouldn’t. No more than half of all households own any stock, and the value of all U.S. stock holdings, held directly or through pension funds, now amounts to less than $12 trillion. Stock ownership is distributed very unevenly; only about half of all investors’ portfolios exceed $25,000. Except during the height of the Internet bubble at the turn of this century, housing has always been the most important asset owned by households (see Figure 3.2).
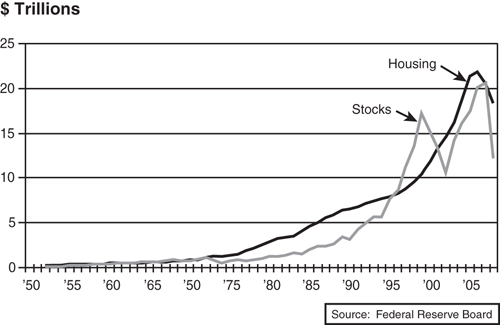
Figure 3.2 Households’ most prized asset: households’ holdings.
Incentives to Own
Buying a home is a goal for most Americans, and government policies provide big incentives to do so. Ever since the Great Depression cost millions of people their homes, promoting home ownership has been a central objective of public policy. Home ownership is believed to be good for communities because homeowners are expected to care more about their neighborhoods. Policymakers have also long believed that it was good macroeconomic policy, as housing plays such a fundamental role in the economy’s growth prospects.
The government most clearly promotes housing through the tax code. The U.S. Treasury gives up $150 billion each year in revenue, thanks to the tax breaks housing enjoys. The biggest tax break is the mortgage interest deduction. Part of the income tax code since its inception in 1913, the mortgage deduction wasn’t initially designed to promote home ownership. Only 1% of the population earned enough money to pay income tax a century ago, and very few homeowners even had a mortgage. The interest deduction was instead aimed at businesses paying taxes on their profits. For tax purposes, profits were defined as revenues minus expenses, and interest payments were defined as an expense. The same formula was extended to individuals; taxable income was defined to exclude interest. Later amendments took the privilege away from nonmortgage debt, so taxpayers cannot deduct credit card or auto loan interest. But mortgage interest is still deductible. And today nearly 40 million taxpayers take advantage of this unintended consequence of the original tax code.
Other key tax breaks include deductions for state and local property tax payments and the treatment of capital gains on home sales.6 Capital gains taxes on sales of a primary residence were significantly reduced a decade ago; profits of less than $250,000 ($500,000 for a married couple) are not taxed. Even before this addition, homeowners could take a once-in-a-lifetime exclusion on all the profit earned from selling a home. Sellers also received a big break early in the decade when President George W. Bush lowered the tax rate on capital gains.
Taken together, tax benefits on housing lower the effective mortgage rate to borrowers by nearly a full percentage point. If you buy a home today, putting down 10% and taking out a prime, fixed-rate mortgage of $225,000, the tax code saves you $150 per month, lowering your monthly payment from $1,425 to $1,275.7 Importantly, the full benefits of these tax breaks go to only those who itemize deductions on a tax return; therefore, higher-income households tend to be the biggest winners.
The government also boosts housing by providing a reliable source of cheap mortgage credit. This isn’t particularly important in good times, but in tough times it’s vital. During the Great Depression, commercial banks and savings institutions, the traditional sources of mortgage loans, found themselves losing depositors; without deposits, they couldn’t make loans. The Federal Home Loan Bank (FHLB) system was established to fill this breach. As a government-backed entity, it could raise funds cheaply from investors and loan money at low interest rates to member banks, which then made loans to households and businesses. The FHA and Fannie Mae were also set up during this period to provide funds to the distressed housing market.8
We have recently learned about the importance of these institutions. When the private mortgage lending industry fell into disarray and funding sources dried up, lenders turned in near desperation to the FHLB system. FHLB lending then ballooned. FHA lending, which mortgage lenders had all but forgotten about during the housing boom, has soared and has been a critical part of the policy response to solving the housing crisis. Policymakers have also turned to Fannie Mae and Freddie Mac. Now that they are part of the government, they are getting more financial resources to insure bigger mortgage loans, to purchase more mortgage securities, and to refinance loans that they own or insure, but without the historically requisite 20% down payment.
Even the Federal Reserve Board (the Fed) has been drafted to support the flow of mortgage credit. The U.S. central bank started a lending program in late 2007 to aid cash-strapped financial institutions, taking mortgage security holdings as collateral for loans. The Fed hoped to stabilize the value of those assets, shore up the mortgage securities market, and keep the credit crunch from getting worse. More recently, it has even begun to purchase the debt-issued by Fannie and Freddie and the mortgage securities that they insure, in an effort to bring down mortgage rates, with some success.
First-Timers
Of course, obtaining credit was not a problem during the housing boom, and no one seemed to benefit more from free-flowing mortgage loans than the first-time home buyer. First-timers enjoyed a once-in-a-lifetime opportunity: All the traditional hurdles to home ownership—including credit scores, down payments, and high monthly mortgage bills—crumbled in the home-lending frenzy.
In many places across the country, first-timers had found it nearly impossible to afford the American dream. This was true even early in the decade, when mortgage rates were as low as they had been in a generation and before housing prices had taken off. Before subprime lending became widespread, a first-timer with good credit who was earning the median household income and able to put down 10% still didn’t have enough income to purchase the median-priced starter home. Things had been even tougher in the early 1980s, when mortgage rates were at their highest and affordability at its lowest; a median household income was only about half of the amount needed to afford a median-priced home. (“Median” means that half of all houses would be priced higher and half would be priced lower.)
This all changed with the subprime lending explosion. As if by magic, the average first-timer now had just enough income to afford to purchase a median-priced starter home. How could that be? Incomes weren’t higher; the median household had barely seen any real gains in earnings. And housing prices weren’t lower; indeed, prices had soared in many areas of the country. The difference was that no-down-payment, subprime, teaser-rate adjustable-rate mortgage (ARM) loans were ubiquitous. And despite higher mortgage rates and much higher housing prices, the initial rate on a subprime loan was low enough to enable first-time buyers to squeeze into a typical home.
This affordability math was even more compelling for potential first-timers in the nation’s priciest housing markets. In Los Angeles and Miami early in this decade, when mortgage rates were low but subprime loans were still uncommon, a first-timer with a median income had only about 60% of what was needed to buy the median-priced starter home. By early 2006, when the most aggressive subprime loans were readily available, the same Los Angeles and Miami home buyers had 85% of the income needed to buy a median-priced home, even though that house had nearly doubled in price from a few years earlier. And with a bit of financial sleight of hand, such as a no-documentation loan, a first-timer could close the deal and move into that home.
All this was too much for many first-timers to pass up. Many saw it as a rare opportunity. With mortgage rates on the rise and housing prices appreciating rapidly, if they didn’t walk through the proverbial door now, wouldn’t they be locked out for good?
It’s clear now that many first-timers who walked through the door with a teaser-rate, subprime ARM did not understand that their mortgage payments would rise sharply a couple years later. The Fed conducted borrower surveys and found a substantial amount of misunderstanding regarding all ARM loans.9 Some borrowers did not know their mortgage payments would ever rise, and others were confused about how much and when. Lower-income people, less educated people, and members of minority groups were much less likely to understand the terms of their ARM loans (see Table 3.1).
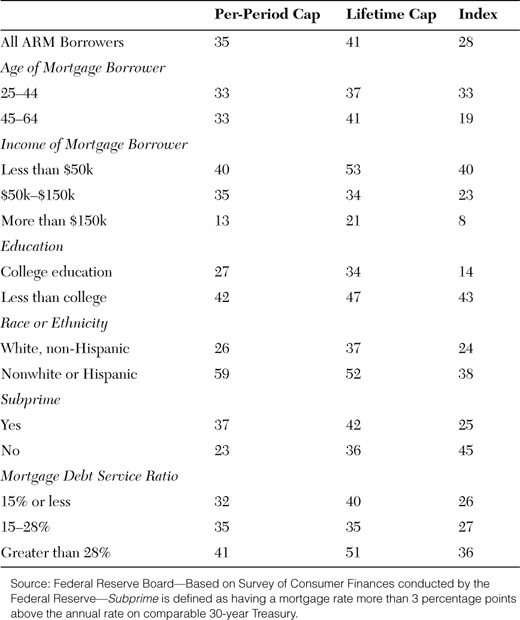
Table 3.1 Percent of Homeowners Who Don’t Understand Various Features of Their ARM Loan
However, many other first-timers understood the financial implications of their mortgage, particularly in the high-priced markets. Yes, lenders likely told them they could refinance into a new loan before their mortgage payment rose. And, yes, they might not have known that refinancing would be exorbitant, given the prepayment penalties on their loans, but they also knew they were taking a gamble. It seemed like a good one at the time.
Trade-Up Buyers
With a flood of first-time home buyers coming into the market, it seemed to be an opportune time for others to trade up. First-timers are generally in their 30s, and trade-up buyers are dominated by 40-somethings. In 2005, the population count was more than 45 million American 40-somethings—people born at the peak of the post–World War II baby boom (see Figure 3.3). More 45-year-olds lived in the United States that year than any other single age group. Many had children in school and housing needs that had grown beyond the size of their starter homes.
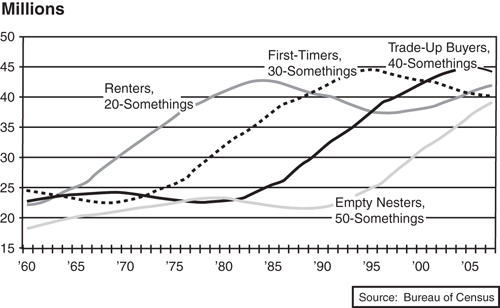
Figure 3.3 How many home buyers?
Interestingly, the number of American 30-year-olds—the prime demographic base of first-time home buyers—was much smaller during the housing boom. Most of the baby boomers celebrated their thirtieth birthdays in the mid-1990s, and the number of 30-year-old Americans has been steadily shrinking since. Yet despite this substantial demographic drag, first-time home buyers fueled the housing boom—proof that the subprime loan was the catalyst for the explosion.
Terrorism also provided a substantial lift to home buying. As with nearly everything else, fallout from the World Trade Center attack on September 11, 2001, significantly shaped the housing market. This is clearest among trade-up buyers, who had the financial means to travel but largely stopped doing so out of fear that more attacks would come. Air travel was particularly nerve-wracking, and going overseas seemed downright foolhardy. Instead of traveling, households stayed home. As this nesting took hold, household spending on bigger and better homes surged.
Home builders became particularly reliant on trade-up buyers. They were building homes for first-timers, but the real money was in putting up larger homes for the more affluent trade-up market. The average size of a new home ballooned to nearly 2,500 square feet, 25% bigger than a decade before and twice the size of homes built in the 1950s.10 Nesting 40-somethings were trading up to big, brand-new homes.
But by 2008, the trade-up buyer was fading fast as a source of housing demand. Terrorism fears had abated, and although travel still included numerous hassles—a falling U.S. dollar, rising gasoline prices, airport delays, and security screening—the nesting impulse had cooled. Demographics were changing as well. More boomers were reaching their 50s and beginning to consider life without children at home. These empty nesters would soon be trading down.
Investors
Most home buyers are normally motivated simply by the need for shelter. This changed during the housing boom. For many, the house was not just to live in; it was also a great investment. At the peak of the boom, Americans invested aggressively in their homes, effectively shifting money out of other financial investments such as stocks and bonds.
It’s easy to see why investment in housing took off early in the decade. Housing brought much bigger returns than stocks, bonds, or cash. The stock market was especially unattractive after the dotcom bust in 2000. Stock prices peaked soon after Y2K; three years later, the major stock indices had been sliced nearly in half. Some $7 trillion in household wealth evaporated in the collapse, and the market has yet to fully recover. Needless to say, most households were not interested in making a major commitment to stocks during this period.
Holding cash also made little sense. The Fed had slashed short-term interest rates following the stock market crash, 9/11, and the invasion of Iraq. Soon after U.S. troops occupied Baghdad, the federal funds rate was at 1%, a rate not seen since just after World War II. Most money market accounts and CDs didn’t pay enough to even match the period’s low rate of inflation.
Long-term bonds offered better returns, but not significantly better; yields were historically very low. A ten-year Treasury bond in summer 2003 offered less than 3.5%, historically a rock-bottom rate. High-grade corporate and mortgage-backed bonds carried slightly higher yields, but most households had few easy ways to directly invest in them.
A house looked like a no-lose proposition by comparison. National housing prices were rising each year, posting high single-digit gains, and many parts of the country saw prices rising far faster. Even without rising housing prices, investors early in the decade found they could earn double-digit returns simply by buying a home and renting it out. This compares with 7% on an investment in an office building, 5% on a long-term Treasury bond, and 3% on an investment in the S&P 500 (see Figure 3.4).
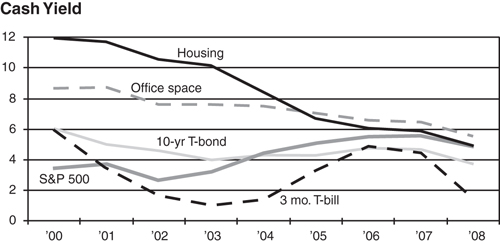
Figure 3.4 Housing loses its investment luster.
Investment returns on housing were even more attractive because the typical home was highly leveraged—most of the investment consisted of borrowed money. Leverage multiplies investment gains: For example, if you buy a house with 10% down and the value increases a mere 5% the following year, you’ve made a whopping 50% return on your investment. Even for someone carrying a mortgage balance equal to 50% of the home’s value, a 5% increase in the house price generates a 10% return on investment. That’s not bad, either.
You didn’t even need to buy a new house to take advantage of this investment math. Many people invested in the homes they already lived in, simply by borrowing against them and using the cash to finance an improvement project or addition. Home equity borrowing surged, as did cash-out refinancing. This occurred when a homeowner took out a larger mortgage, paid off the previous one, and pocketed the difference. With mortgage rates low and falling, homeowners could increase the size of a loan without increasing the monthly payment. Millions of homeowners jumped on this bandwagon, withdrawing nearly $1 trillion a year in equity from their houses collectively at the peak of the boom. Approximately one-third of this went back into homes as additional investment.11
Older, wealthier households also invested in housing by purchasing second and vacation homes. The number of second-home purchases rose from a couple hundred thousand a year to nearly half a million at the height of the boom. The typical second-home buyer did not expect a quick profit; a second house could be used occasionally, rented out, or both. Meanwhile, the value would rise, producing a healthy investment gain for the future.
Flippers
It didn’t take long for such long-term housing investors to be overwhelmed by flippers, speculators who aim to buy and sell properties quickly for a profit. Such speculation is rarely based on investment fundamentals such as long-term supply and demand. Instead, it is “forecasting with a ruler”—leaping to the assumption that because prices have been rising quickly, they will continue to do so.
Speculation is not uncommon in financial markets, but it had been rare in housing. It might have happened in South Florida and Texas in the late 1970s, and in California and New England in the late 1980s, but this is difficult to document. Buying and selling houses involves transaction costs—fees, interest, and so on—which normally make it hard to turn a quick profit this way. But not during the recent housing boom. At the height of the frenzy, flippers flooded large parts of the housing market, and their own speculation helped drive the price boom they were betting on. As flippers bid up prices, it raised the appraised values on neighboring properties, which induced still more flipping and even higher prices.
The worst flipping occurred in California, coastal areas of the East, Florida, and much of the Mountain West. Not surprisingly, flippers were aggressive users of loans with low or no down payments; the high leverage of those loans juiced their returns. Here’s how it worked: A flipper might purchase a new condominium for $200,000 and put down $10,000, only to sell it three months later for $225,000. Even after expenses of $5,000, the flipper would end up $10,000 richer. The annualized return on such a transaction is an incredible 400%—that is a $20,000 profit on a $10,000 investment in only three months.
The lure of such windfalls made flipping surge. The share of mortgages issued to investors, as opposed to people buying homes to live in, doubled between 2001 and 2005, going from 8% to 16%.12 And this statistic certainly understates the increase because many flippers fudged their intentions when they applied for loans, to obtain the better credit terms given for owner-occupied houses.
Flippers were most active in the hottest markets. In Miami, Florida; Myrtle Beach, South Carolina; Phoenix, Arizona; and Las Vegas, Nevada, the reported investor share of mortgage originations and house sales topped out at more than one-third (see Figure 3.5). But flipping occurred even in relatively staid places such as the condo market in downtown Philadelphia, and even in homes by a lake in Lansing, Michigan.
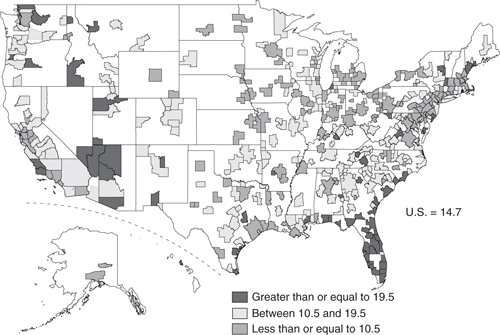
Figure 3.5 Where was the flipper? Investor share of home purchase originations, % of $, 2006.
Flippers operated in a gray area of the housing market. Many home builders, particularly the large national firms, publicly disapproved of flipping and instituted policies to stop it. But this had little effect. In some cases, the policies weren’t strictly enforced; in others, the builders knowingly looked the other way; and in still others, flippers devised clever ways to avoid detection. In hindsight, it became clear that entire tracts of new homes were built and bought by speculators who never intended to live there. Those developments stood vacant long after the boom subsided.
At the Peak
It’s fair to say that, by the middle of the decade, a vast number of Americans had become housing speculators of some kind. Flippers were the most overt, but millions of others also believed that home prices would stay high permanently. Not that annual double-digit gains would go on forever, but prices would surely not fall—at least, not for very long, and certainly not very far.
This belief persuaded first-time home buyers that it was okay to stretch their finances to achieve home ownership. Trade-up buyers used the power of positive thinking to dream big, particularly because they planned to spend more of their leisure time at home. Even homeowners who didn’t plan to move accepted the idea of housing as a good investment, especially compared with stocks and bonds. Others thought it was a perfect time to buy a second home. The flipper took this faith to the extreme. Lenders might have empowered us to act on our impulses, and regulators might have failed to adequately warn us of the dangers. But at the peak of the boom, we were all believers.