
13. Economic Fallout
The subprime financial shock hit in summer 2007, and by early 2008, the U.S. economy had come unhinged. Economists and policymakers debated whether the nation was in recession, but for most Americans, there was no debate. They were worth measurably less and their incomes didn’t stretch nearly as far.1 For them, this was a recession.
By summer 2008, little was going right: Job losses were intensifying, and part-time work was replacing full-time. The stock market was down and, for the first time since the collapse of the tech-stock bubble early in the decade, was having trouble getting back up. Gasoline prices were rocketing past $4 per gallon. The cost of bread, milk, and other staples was rising quickly as well. Millions were losing their homes to foreclosure, and house prices were in free-fall. American consumers, whose collective spending had powered the global economy since World War II, had no choice but to tighten their belts.
Americans’ anxiety steadily mounted. As 2008 came to a close, it was as if everyone were running to take shelter in the proverbial bunker. Home Depot reported that its biggest-selling item in November was home safes, presumably to store the cash people were pulling out of the stock market. Surveys of consumer sentiment concurred that the collective psyche had never been so frayed, at least not since such surveys began in the 1960s. Households were even more upbeat in the early 1980s, when inflation and unemployment were both in double digits.2 Though both inflation and employment were still relatively low at this point, it was telling that people felt things were worse than they had been in that earlier dark period.
For the economy to be pushed into recession by scared consumers was unprecedented. Historically, recessions had been caused by businesses that had overextended in the good times and had to pull back when things didn’t go as planned. An event such as 9/11 or the Gulf War could trigger a recession, as they had in 2001 and 1990. Disruptions in oil supplies did the trick in 1973 and 1980. Those downturns began when firms had been forced to lay off workers and cut investment. But that wasn’t the cause in 2007 and 2008. First, homeowners stopped paying their mortgage bills and other debts; then they stopped spending altogether. Economists had long counted on the American consumer to power the economy’s growth—as they put it, to never underestimate the hedonism of the American consumer. That old adage no longer appeared to hold true.
Yet the subprime financial shock’s significance goes beyond the severe economic downturn it started. The shock was, in fact, an inflection point in the nation’s economic history. Before it hit, most households saved little, and many borrowed aggressively and spent beyond their incomes. Between 1980 and 2005, the personal saving rate—the percent of after-tax income that is not spent—fell steadily from 10% to essentially nothing (see Figure 13.1). The decline was due partly to wealthier households saving less. Affluent Americans had built up their nest eggs during years of strong stock and real-estate gains. The 1987 stock market crash, the tech-stock bust, and the housing crash had been only temporary setbacks.3 Millions of families didn’t have to worry about paying for the children’s college education or their retirement, so they were set. Why save?

Figure 13.1 Personal saving fades away: personal saving rate.
Saving also declined as the borrowing power of poorer households increased. Steadily falling interest rates since the early 1980s and financial innovation had made credit available to households that had not previously had access to credit cards, car loans, or mortgages. By going from a three-year to a five-year car loan or taking on a 2/28 subprime mortgage, these households could add debt without seeing their monthly payments rise, at least for awhile. Borrowing allowed them to maintain a level of spending despite having tenuous jobs and volatile incomes.
The subprime shock signaled an end to all this. No longer would wealthier families be able to count on outsized gains in the stock or real-estate markets to do their saving for them. No longer could poorer households easily get another loan when the cash from the previous one ran out. The subprime shock marked the denouement of a half-century of global economic history driven by the American consumer.
Housing’s Tentacles
The bursting of the housing bubble and the waves of mortgage defaults that followed brought on the subprime shock. Conversely, the shock and subsequent credit crunch accelerated the housing crash. With mortgage lending at a standstill, home sales collapsed and foreclosures soared, forcing builders to cease construction and home sellers to slash prices. Because housing is such an essential part of the economy—no other industry is arguably as important to the business cycle—the housing crash choked the economic expansion. Recession followed.
The severity of the housing crash was without parallel, except perhaps for the Great Depression. By early 2009, housing starts had fallen nearly 80% from their peak three years earlier; home sales were off 35% (and closer to 60% if foreclosure and other distress sales were excluded), and house prices had dropped by 25% on average nationwide. For historical context, during the housing downturn of the early 1980s, the industry’s previous low-water mark, although housing starts fell 60% peak to trough and home sales fell by about 50%, the sales price of American home prices never declined.4
The most obvious link between housing and the economy is construction. During the housing boom, residential investment, which includes the value of home building, renovation, and remodeling, steadily rose. When home building peaked in early 2006, its value as a percentage of GDP was at an all-time high; residential construction had never been more important to the economy.5 Three years later, building as a share of GDP was plumbing a record low.
The wild swing in home building had a dramatic impact on the nation’s overall growth. Residential construction had added nearly half a percentage point to real GDP steadily during the boom; it subtracted a full percentage point from yearly growth during the crash. In 2007, real GDP growth came in at 2.2%, but it would have been 3.2% if home building had simply remained unchanged that year. But this is just a partial measure; it doesn’t count all the ripple effects that occur when home building falls off: Demand, and thus production, falls for steel, cement, gypsum, lumber, tools, plumbing fixtures, and electrical apparatus; for surveyors, truckers, and retailers have less work; fewer roads, bridges, and schools are built; and on and on.
A less obvious link between housing and the economy runs through state and local government finances. Property taxes account for more than two-thirds of local governments’ tax receipts, while states depend on various transfer fees and capital gains taxes on home sales for their revenue. Government coffers overflowed during the housing boom as rapidly rising house prices fueled gains in revenue. Those coffers didn’t dry up right away, thanks to the time lag between house prices, property assessments, and tax payments. But it was clear the housing crash would be a drag on government finances for a long time.
Budgets for the fiscal year 2009 already showed the first effects. More than half the nation’s states reported sizable shortfalls for fiscal year 2009, and nearly all will have budget problems in fiscal year 2010. States had been relatively prudent during the boom and had fattened up their rainy-day funds. But states have largely spent those monies now, and with most states having constitutional balanced budget requirements, they are being forced to cut back spending and even raise taxes to balance their books. All government services, from schools and universities to hospitals and roads, are being pinched. In addition to the institutional pain this causes, the economy as a whole feels the ill effects. Government isn’t generally a huge contributor to the economy’s growth, but it is a consistent one, and when other sources of growth fall off, it can be important.
Perhaps the least understood link between housing and the economy is house prices and their impact on homeowners’ wealth. As we saw in Chapter 4, “Chairman Greenspan Counts on Housing,” the wealth effect of rising house prices lifted consumer spending during the housing boom. During the crash, this wealth effect went into reverse. Because a home is most households’ most important asset, a drop in real estate prices affects consumers’ sense of their own net worth and strongly influences decisions on spending. When house prices were high, for example, the equity in a home might have been enough to pay for a year or two of a child’s college—but with prices down, there was enough for room and board, at best. With the echo-boom generation reaching late teens and the credit crunch suddenly making student loans more difficult to get, there was no other option but to spend less and save more—and quickly.
Amplifying the financial angst was the extra debt many homeowners had taken on during the boom via home equity lines and cash-out refinancing deals. When prices were soaring, this had seemed essentially like free money. Even if some thought their rising real-estate wealth was a bit too good to be true, they were confident that, at worst, house prices would only plateau rather than fall. It was inconceivable that home values would drop and keep dropping, past 10%, 20%, or even 30%. The average homeowner’s equity was roughly $75,000 when house prices peaked in spring 2006.6 By early 2009, this figure had fallen to almost $45,000. And house prices were still declining. If nationwide average home prices bottomed out 35% below their peak—the widespread consensus among economists at the time—then an average homeowner would have only $40,000 left in equity.7 But these numbers mask a wide distribution in homeowners’ economic fortunes. Millions of wealthier and generally older homeowners had built up hundreds of thousands of dollars in equity through the years. Millions more owned no equity at all—they owed more than their homes were worth. As of early 2009, an estimated 8 million households had more than $200,000 in homeowners’ equity. Another 14 million were completely underwater on their homes.
To fully appreciate the implications of the negative wealth effect on consumer spending and the economy, consider the behavior of three types of households: renters; lower- and middle-income households who dipped into their home equity for cash during the boom; and wealthier homeowners who did not. The saving rate for those who rent has long been close to zero (see Figure 13.2).8 Rising and falling house prices mean little to them directly, so ups and downs in the housing market do not directly affect their spending and saving. Renters account for about one-third of the population, but only 10% of consumer spending.

Figure 13.2 Cashing out homeowners dis-save: personal saving rate.
This is not the case for lower- and middle-income homeowners who cashed out. For them, movements of house prices are crucial; nothing affects their financial decisions more. As prices took off in the early 2000s, they borrowed so aggressively that their saving rate reached an astounding –10%—in other words they were collectively spending 10% more than their income. Rising home equity was fueling this binge. As the fuel ran out in the housing crash, they were forced to become more prudent spenders, at the very least, matching their spending with their income. This was a tough adjustment for an economy whose growth had become dependent on these consumers’ earlier profligate habits.9 These homeowners account for one-third of the population and a roughly equal share of consumer spending.
Wealthier homeowners who did not cash out their homeowners’ equity are much less influenced by shifting housing values than on the stock market. This group had a zero saving rate during the housing boom, but this had more to do with the period’s record stock prices. They also had a zero saving rate when the tech-stock bubble was its most inflated at the turn of the millennium. As the stock market began to crumble under the weight of the financial shock in late 2007, panic began to set in. Their nest eggs weren’t big enough for retirement after all—not even close. They significantly cut back on their spending, and their saving rate soared to a positive 10% in early 2009. Although this group accounts for the remaining one-third of the population, it accounts for a disproportionately large nearly 60% of consumer spending. How much they decide to spend or save has a big impact on everyone.
Economists have long wanted U.S. consumers to save more, but not to begin saving more all at once. The dramatic increase in saving in such a short-period of time was too much for the broader economy to adjust to. A big hole formed in the economy. Retailers, manufacturers, wholesalers, shippers, and a range of other firms had built their businesses on certain amount of consumer spending. With consumers not buying, they had no choice but to slash their payrolls and investment, further weighing on consumer spending. A vicious cycle developed, with households pulling back on their spending, which forced businesses to cut jobs, which scared consumers to rein in their spending even more. What seemed to be a garden-variety recession unraveled into the worst economic downturn since the Great Depression.
Falling $, Record Oil
It is important to note that the economy might have been able to avoid such a severe downturn if not for the dramatic fall in value of the U.S. dollar early in the financial crisis. The subprime shock and the weakening dollar were related: The housing bust had occurred in the United States at a time when financial and economic conditions elsewhere around the world were measurably better. Global investors who had been eager to put their cash into U.S. markets before the shock were now just as eager to get out. As a result, the dollar tumbled in value against other major world currencies. The euro moved up from $1.35 to almost $1.60; the Canadian loonie rose from 85¢ to $1-for-$1 parity (the first time since the early 1970s); and instead of needing 125 Japanese yen to make $1, traders needed only 100. Together, the dollar’s value (measured against the currencies of America’s major trading partners) fell more than 10% in just a few months in late 2007 and early 2008. This was on top of a 15% decline during the Iraq invasion and deflation scare earlier in the decade. The dollar was worth about one-fourth less than at its peak.
This wasn’t an entirely bad thing. The weaker dollar had clear economic benefits. When combined with still-strong growth overseas, the U.S. trade deficit narrowed. The imbalance between U.S. imports and exports had, in fact, peaked with the housing market in late 2005; by early 2008, it had been cut by a fourth.10 The nation’s agriculture, aerospace, machine tools, and technology industries gained new market power overseas and shipped record amounts of goods to Asia, South America, and Europe. After years of weighing down the economy, trade had become a vital source of growth.
The dollar’s sharp drop at the start of the financial turmoil did more damage than good, however. It helped ignite another surge in oil, food, and other commodity prices. Since most commodities trade globally in dollars, a fall in the dollar’s exchange value means the dollar price of these commodities must rise to maintain a balance between global demand and supply. Given the increasing values of the euro, yuan, and rubble vis-à-vis the dollar, without a higher dollar price for oil, wheat, and copper, the Europeans, Chinese, and Russians will consume more, throwing demand and supply off-kilter. As a result, a barrel of oil that sold for $65 in the weeks leading up to subprime shock had doubled in price by spring 2008.11 The dollar price of other commodities, ranging from gold and wheat to copper and coca beans, didn’t rise quite as much, but most were still hitting record highs.
Commodities weren’t being powered by a weaker dollar alone. The financial bedlam created by the subprime shock also contributed. Global investors were truly confused about where to put their money. Real estate was certainly out, bonds seemed like land-mines, and stocks appeared shaky, at best. Each new explosion in the financial markets drove investors to seek safer investments—mainly U.S. Treasury securities and commodities. Some investors reasoned that commodity prices tended to move in the opposite direction of other asset prices and would thus help diversify their portfolios. Other short-term investors, so-called momentum players, simply bet that because commodities had been consistently rising in price, they would rise even further. The commodity markets were like any other asset market in an age of easy trading and excess liquidity; here too, prices could be subject to speculation and bubbles.
For the economy, surging oil and other commodity prices were too much to bear. The price of a gallon of regular unleaded gasoline, which had averaged $2.75 nationwide on Labor Day 2007, reached $4 by Memorial Day 2008 and kept rising. Each penny increase pushed up Americans’ driving costs by more than $1 billion. Washington’s $100 billion tax rebate—part of the fiscal stimulus passed a few months earlier to try to stave off recession—began arriving in Americans’ mailboxes just as gasoline crossed $4, and was effectively gobbled up by the higher cost of fuel. Observers noted a bitter irony: The U.S. Treasury had sold bonds to raise the cash to pay the tax rebates, which were spent to buy oil from the same nations that had purchased the bonds. It’s not much of an exaggeration to say that countries such as Saudi Arabia had essentially financed the purchase of their own oil.
Energy wasn’t the only thing that was rising quickly in price. Food prices were also up sharply. This was driven partly by the higher cost of moving farm products to store shelves as diesel prices soared, but it also reflected the weak dollar and strong global demand for all U.S. agricultural products. Imported goods of all kinds cost more. Even prices for goods coming from China, which had fallen for years, were now on the rise. It was the reverse of the late 1990s, when the Asian financial crisis had sent investors scurrying to the safety of the United States. This lifted the dollar and slashed the price of imports to U.S. consumers. The subprime financial shock induced global investors to flee American markets, undermining the dollar and raising prices for anything not made in the United States. Consumers were rightly panicked, realizing that there was no way out and that recession was unavoidable.
Cracked Nest Egg
A temporary period of slack in U.S. growth was hardly the net impact of the subprime shock, however. Henceforth, American consumers would have to find ways to live within their means. Their unlimited freedom to spend, as well as their dominant role in the global economy, had reached an end.
The era of U.S. consumer dominance can be tracked through the rise of household spending as a share of the total economy. In 1980, consumer spending stood at 62% of GDP, about where it had been since the end of World War II (see Figure 13.3). By 1990, that share had risen to 66%; by the turn of the millennium, it was 70%.12 This is the flip side of the falling personal saving rate. Consumer spending rose as a share of GDP throughout this period because households were willing and able to spend above their incomes.
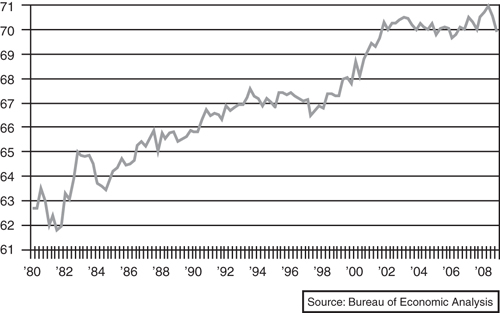
Figure 13.3 Consumers power the economy: consumer spending share of GDP.
Underpinning this quarter-century of aggressive consumer spending was the steady deceleration in inflation and the resulting decline in interest rates. The early 1980s was a period of stagflation, characterized by double-digit inflation, unemployment, and interest rates. The oil-price shocks of that time—the Iranian revolution had occurred in 1979—had ignited a spiral in which rising prices begat increased wages, which begat yet higher prices. Consumer price growth and the ten-year Treasury bond yield both peaked about this time at close to 15%. Almost 25 years later, inflation had been wrung out of the economy by years of stringent monetary policy, stable and low oil prices, and China’s rapid ascent. Inflation and interest rates fell into the low single-digits.
These conditions helped ignite an increase in asset prices: Stocks, bonds, and real estate all increased smartly in value. Interest rates play a crucial role in determining any asset’s value because they affect the present value (what it’s worth today) of the asset’s future income. For a share of stock, for instance, that income is the future profits of the company that issued it. For real estate, it’s rents for landlords and the benefits of living in the home for homeowners. When interest rates fall, the present value of this future income rises and, thus, so does its price. Lower rates mean asset prices will rise relative to the future income they are expected to generate—the price-to-earnings ratio (PE) increases. As the ten-year Treasury yield fell from 15% in 1980 to less than 5% in 2005, asset prices rose strongly, and the economy’s collective PE ratio—measured by the ratio of the value of all household assets to GDP—went from 3.5 to more than 5 (see Figure 13.4).13
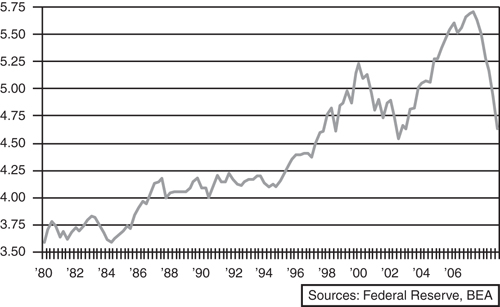
Figure 13.4 The economy’s PE has peaked: ratio of value of household assets to GDP.
The increase in asset prices and PE ratios is evident in the stock market. The S&P 500 PE rose from less than 10 in 1980 to closer to 20 by 2008. Stock prices rose about 10% annually during this period, despite some major setbacks such as the 1987 crash and the bursting of the Internet stock bubble. House prices also enjoyed a solid run, rising more than 5% annually. As with stocks, the housing PE rose from a low of 10 to near 20, even after including the post-2005 housing market crash.
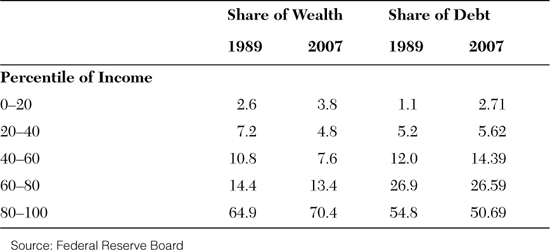
The financial benefits of these outsized asset price gains have gone almost entirely to higher-income households. The data is a bit sketchy, but households that are among the highest 20% of income earners saw their share of overall wealth rise from 65% to 70% in the nearly 20 years between 1989 and 2007.14 The median net worth of these households was above $750,000 in 2007, up from less than $425,000 20 years earlier. The share of wealth going to the lowest 80% of income earners fell commensurately, from 35% to only 30% (see Table 13.1). Their median net worth of $50,000 in 2007 had not changed very much during the 1990s and so far this decade.
Table 13.1 The Wealthy Get Wealthier, the Poor More Indebted
About the time the housing market peaked in 2005, many wealthy Americans thought they were financially set. If their nest eggs were not quite large enough to sustain a comfortable retirement and meet other obligations, they would be assuming that asset prices continued their recent pace. This seemed a reasonable assumption: Assets had risen on average in the high single-digits for as long as this generation could remember.
The subprime financial shock put an end to this kind of thinking. The super-wealthy had no concerns. They were indeed set, but the simply well-to-do realized now that their nest eggs were insufficient. The subprime shock dashed beliefs and hopes that asset prices would consistently appreciate faster than the income those assets were likely to generate. This was clear in the post-shock collapse in house prices. The tech-stock bust had similarly made it clear in the stock market. With interest rates unlikely to go lower for long, the most reasonable assumption was that asset prices would grow about as fast as the income those same assets generated. That is, PEs would not continue to rise. Across all asset classes—stocks, bonds, and real estate—the best forecast was that asset prices would increase at a mid-single-digit pace, about the same as the expected growth in GDP. Even higher-income households had some saving to do.
Debt Millstone
Lower-income households faced a far more difficult adjustment. For a quarter-century, these households benefited from steadily increasing access to credit. By borrowing more, they could supplement their constrained incomes to maintain their spending at a relatively high level. The subprime financial shock signified the end of such free-flowing credit. Lower-income households had little choice but to match their spending with their incomes; their living standards would inevitably suffer.
It was tough to get a loan in the early 1980s. For most households, that period’s double-digit interest rates made borrowing prohibitively expensive. Credit cards were still new (they were not mass-marketed until the late 1960s) and still only a minority of households used them. Vehicle loans lasted, at most, three years and were exclusively intended for car buyers with pristine credit. Mortgages were almost entirely plain-vanilla 30-year, fixed-rate loans.
Over the subsequent 25 years, the availability of credit ballooned, powered by steadily declining interest rates, rapid financial innovation, and government policy. The lower rates were vital to increased borrowing because households could take on more debt and not have to make larger payments. Lenders also extended the length of loans to keep payments down; minimum payments on credit cards fell, most car loans evolved into 5-year loans, and 40-year mortgages became increasingly common. Credit scoring, direct marketing, and securitization came into their own, and lenders grew emboldened to provide credit to new groups of consumers. Risk-management techniques improved dramatically, enticing lenders to provide more credit to less creditworthy borrowers. Mounting regulatory pressure also emerged to provide more credit to minority and disadvantaged borrowers. Ongoing changes to the bankruptcy laws, making them steadily more lender-friendly, might have also empowered lenders to extend more credit.15
Although all income groups took on more debt, lower-income groups were particularly burdened. In the 20 years between 1989 and 2007, households in the bottom 20% of income earners increased their indebtedness by a whopping 8-fold.16 Those in the next-lowest 20% bracket boosted their debt levels 6 times. Households in the top 20% of income earners also borrowed more, but their debt increased by less than 2 times.
Some of this reflects a judicious use of credit by households getting their first taste of it. Higher-income households have long had the luxury of financing purchases of big-ticket items—a car, a dishwasher, or even a big-screen TV—that they will consume over a long period. They use debt to more efficiently pay as they consume, laying out cash (via debt repayment) as they go. Of course, this plan includes interest charges, but for many, it is well worth it. Lower-income household should enjoy the same privileges, and that’s how many have used their access to credit.
Over time, lower-income households have increasingly used debt to supplement their constrained and volatile incomes. It’s not hard to understand why: After inflation, incomes for those on the bottom rungs of the income and wealth ladders barely grew after the early 1980s and didn’t grow at all through the late 1990s to the mid-2000s. Although globalization—including immigration and trade—had been a boon to the overall economy, it was hard on those with lesser skills and education. In the competition with cheaper labor from all corners of the world, lower-skilled U.S. workers were losing. Borrowing more took the financial sting out, and although debt burdens were getting weightier, these households could manage it as long as lenders continued to extend them credit.
By the time the subprime financial shock hit, debt loads were at record highs. The average American household was paying almost one-fifth of its after-tax income on financial obligations—everything from the mortgage payment to the auto lease—to avoid going delinquent on those obligations. For subprime homeowners, who were forking over more than 35% of their after-tax income to meet their obligations, this was an overwhelming burden (see Figure 13.5). It all came undone in the housing crash and the subprime financial shock. Many poorer households were now completely cut off from credit. Although lending to this group would eventually be reborn, these households would no longer be able use credit as a ticket to a better lifestyle.
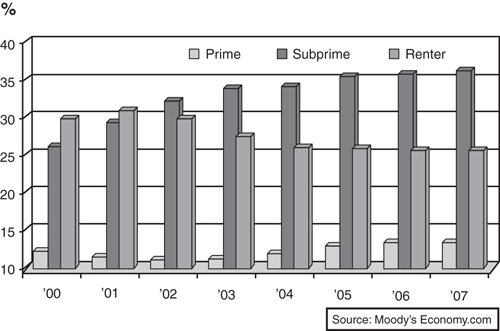
Figure 13.5 Weighty household debt loads: financial obligation ratio, % of disposable income.