3. BCG Growth/Share Portfolio Matrix
Description and Purpose
Portfolio planning models like the BCG matrix are designed to help the analyst better understand the attractiveness or potential of a portfolio of distinct business units in a multiunit business. They developed from two places: the planning department at General Electric (GE) and the Boston Consulting Group (BCG). GE generally is credited with being the first to present a comprehensive portfolio matrix in the early 1960s.
Shortly after the initial developments at GE, BCG’s founder Bruce D. Henderson took the business world by storm with the introduction of his growth/share portfolio planning matrix (BCG matrix). Its intuitive appeal and vivid imagery combined with the appearance of good quantitative analysis caught the interest of many strategic, marketing, and product planners searching for a legitimate analytical tool to manage a diversified multiunit corporate strategy.
Crafting a fit between the organization’s goals, capabilities, and the environment in which it operates is at the core of strategic planning. The tactical delivery of strategic planning is the allocation of resources to competing internal opportunities. This is a challenging task for focused companies, and it can quickly spiral into unmanageable complexity for a diversified company.
The BCG matrix was designed to help managers of multi-product, multimarket, multinational businesses assess and screen their corporate strategy by doing the following:
• Providing them with an analytical framework to determine the optimal product or business portfolio
• Prescribing a set of strategies to guide resource allocation across the portfolio
• Providing them with a framework for analyzing competing business portfolios
The BCG matrix allows a multibusiness company to evaluate the merits of its individual business units or business lines to determine appropriate market strategies for each business. The business portfolios are evaluated using a common measuring stick based on the attractiveness of the industry in which they compete and their relative competitive position. Generic strategies are then recommended depending on the position of the individual business unit or line in the portfolio matrix.
The BCG matrix integrates two previously established management theories: the experience curve and the product life cycle.
Link to the Experience Curve
BCG found that per-unit costs often decrease as output levels increase due to the impact of experience. Experience is composed of three functions—learning, specialization, and scale:
• The learning function shows that anyone doing a job learns to do it better over time.
• The specialization function shows that by dividing jobs into individual tasks, each employee’s experience with the task increases, and costs decline because of the increased learning.
• The scale function suggests that the capital costs required to finance additional capacity diminish as that capacity grows.
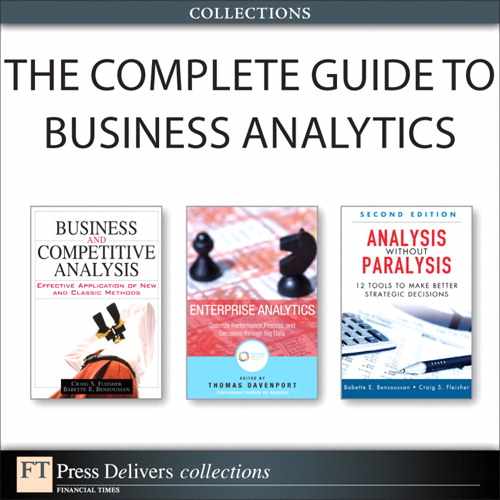
Figure 3.1 shows the sequential impact of these three functions on profitability.
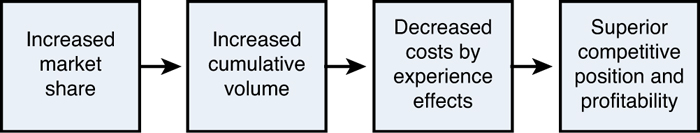
Figure 3.1. Experience curve sequence.
Based on this logical sequence, a major strategic implication is drawn from experience curve theory: The company capturing the largest market share achieves the highest accumulated volume. Because it has been in the market long enough to achieve top share, it gains a superior competitive position due to cost reductions and scale economies. This achievement of cost advantage over time is known as the experience curve effect.
Link to the Product Life Cycle
The other building block of the BCG growth matrix is the well-established concept of the product life cycle (PLC). The PLC was selected as the natural complement to the experience curve based on the following chain of logic.
If market share is the surest road to higher accumulated volumes, subsequent lower costs, and higher profitability, the company’s resources are best spent pursuing high-growth markets.
The surest route to maximize total company profitability is to maximize market share across the strategic business unit (SBU) or strategic business line (SBL) portfolio. The best way to accomplish this is to transfer profits or resources away from mature and declining products to the introductory and growth products along the PLC. The relevant assumptions of the PLC are twofold:
• Market share is easier to secure in high-growth markets because competitive retaliation is less severe when it is secured through new growth instead of being taken from threatened competitors. It is also easier to secure because new consumers or users have lower established branding preferences relative to experienced ones.
• Products in the mature stage of the PLC generate excess cash, whereas products in the growth stage require or absorb more cash.
Combining the Experience Curve and Product Life Cycle
The BCG growth matrix, shown in Figure 3.2, is the result of integrating the experience curve and PLC theory.
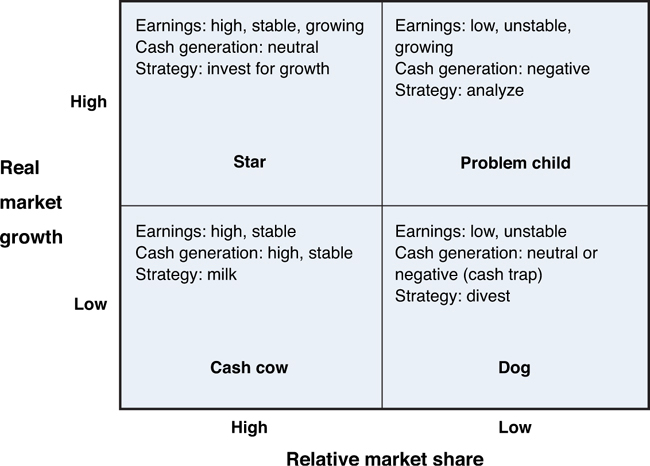
Figure 3.2. The BCG growth matrix.
The BCG matrix plots market attractiveness (measured by market growth as derived from PLC theory) and competitive position (measured by market share as derived from experience curve theory) to compare the situation of different products or SBUs. Essentially, positioning along the two axes of the matrix demonstrates the ability of a targeted unit to either a) generate cash or b) its requirement for cash.
Market attractiveness is measured by the industry’s growth rate. Competitive position is measured by the business unit’s market share relative to that of its largest competitor in the industry (as opposed to the market as a whole). For example, if a business unit has a market share of 20% and its largest competitor has a market share of 40%, the business unit’s relative market share is 0.5. The purpose of this comparison is to define an appropriate market strategy for each business unit.
The overall strategy of the multi-business company, as suggested by the BCG matrix, is to maximize market share in as many high-growth markets for as many SBUs/SBLs as possible. The upper limit of this possibility is limited by cash flow because the model assumes an internal cash balance between cash use and cash generation. Hence, the strategic goal for senior executives is to allocate limited cash resources across the business units or lines to maximize company profitability.
Each quadrant in the BCG matrix offers generic strategies to achieve maximum profitability under this constraint.
Stars: High Growth Rate, High Market Share
The high growth rate of stars requires a heavy cash investment. Their strong market share position implies that stars move the furthest along the experience curve relative to competitor’s offerings. Therefore, stars should soon develop high margins, resulting in potentially strong cash flows in the near future and, hence, a sustainable cash position. Applying the BCG matrix assumes that stars will eventually become cash cows. It recommends that if stars are cash deficient, they should be supported with the investment necessary to maintain their market share. If they are cash providers, the surplus should be reinvested.
Cash Cows: Low Growth Rate, High Market Share
Products or SBUs in mature markets require lower cash investments and therefore provide essential cash flows from which to finance businesses in other, more promising quadrants. The BCG matrix suggests that cash cows be “milked” by a strategy that only invests in maintaining their current positions. Excess cash flow should be reinvested in either stars or selected problem children. It can also be used for valuable corporate purposes like paying dividends, investing in promising research and development, covering administrative expenses, or servicing debt.
Dogs: Low Growth Rate, Low Market Share
The low growth rate of dogs implies that increasing their market share will be a costly proposition. Additionally, their low market share implies an uncompetitive cost structure by virtue of their inferior position on the experience curve. Hence, dogs are unprofitable and usually require heavy cash investments just to maintain their low market share. Applying the BCG matrix recommends three options for dogs:
• They can become profitable with a focused strategy on a specific desired niche or segment.
• Any further investment can be withheld while they are “milked” for any cash that they can still generate.
• They can be divested, slowly be put to sleep, or allowed to die naturally of old age.
Problem Children: High Growth Rate, Low Market Share
The high growth rate of problem children (also known as “question marks”) requires a heavy cash investment. An intensifying factor is their low market share, which implies an uncompetitive cost structure by virtue of their inferior position on the experience curve. As the maturity stage sets in, the problem child follows one of two paths on the matrix:
• If market share cannot be grown, the problem child becomes a dog.
• Alternatively, if market share can be increased by a high enough amount, the problem child is transformed into star status and eventually becomes a cash cow.
The BCG matrix recommends that the most promising problem children should receive cash investments to increase their market share, but problem children with dismal prospects should not receive further cash investment.
Although these recommendations appear straightforward, they still require careful discernment. It should be noted that experience has shown us that one corporation’s dog may be another’s star, or vice-versa. This is another reason why you should not apply an application like the BCG portfolio approach in isolation and must always consider the larger strategic context within which the analysis is conducted and decisions are made.
Figure 3.3 shows the integration of these classifications and their requisite strategies. The numbers indicate strategic priority.
Figure 3.3. Overall strategic sequence.
Strengths
The simplicity of the BCG matrix may be its greatest strength. It presents a great deal of information visually in one diagram; the complexities of a multibusiness strategy are captured in an accessible format. Many other management tools cannot match the depth and breadth of information that this growth/share matrix offers in one concise view. Its straightforwardness allows it to be used easily and quickly to identify areas for further in-depth analysis.
The BCG matrix challenges the common thinking that internal investment should be directed on the basis of past performance or should reward managers for past performance. In some respects, the portfolio approach fosters a mindset focused on future demand.
It additionally assists with areas such as the following:
• Trend analysis. Changes in the relative SBU markets can be detected easily through the use of multiperiod matrices.
• Competitive analysis. The strategic progress and intentions of competitor companies can be determined by plotting a time series of competitor matrices.
• Ease of communication. The matrix and the resulting recommendations are easy for decision makers to understand.
• Challenges to existing management philosophy. One of the main strengths of portfolio analysis is the change in perspective that it induces in the minds of its users. It recognizes that corporate-level strategy must integrate individual business unit strategies. This is an improvement on the earlier mindset, which tended to apply blanket strategies across the entire multiunit company and neglected the frequently important competitive differences across various product markets in which it operated. The BCG portfolio approach heightens management’s sensitivity by combining corporate-level and business-level strategy considerations.
Weaknesses
The BCG matrix has several limitations. These were most frequently caused by changes in the nature of competitive dynamics that occurred over the decades since its inception. For example, the experience curve link to the BCG matrix may be irrelevant to the competitive parameters of a particular product market. Relative market share is not necessarily a good proxy for competitive position. Only some industries demonstrate a clear or singular relationship between market share and profitability.
High market share is not necessarily more profitable than low market share. Many profitable companies have demonstrated that competition in low-growth mature markets should not be categorically ruled out as a strategic option. Similarly, the emphasis on market dominance is constantly being challenged by successful niche players who specialize in product or service differentiation.
Market share is assumed to be a dependent variable, whereas market growth is assumed to be an independent variable. This is not necessarily correct. The assumption that market growth rate is a variable beyond the control of management confuses the cause-and-effect sequence of effective strategy. Strategy should lead to growth rather than growth leading to strategy.
The BCG matrix assumes that investment opportunities inside a company are superior to investment opportunities outside the company. The emergence of advanced capital markets, coupled with the difficulty of managing diversity in the absence of specific market knowledge, suggests that portfolio management has become less useful. It is quite possible that increasing dividends or investing surplus cash cow funds in capital or other external markets offers a higher rate of return than investing internally in stars and problem children.
Strategic business units sometimes cannot be unambiguously defined. The nature of SBUs with regard to their interrelatedness (such as joint costs, synergy, demand, and interdependencies) makes the positioning on the matrix a convoluted exercise in classification.
Often, it is valuable for a company to retain dogs to maintain a portfolio of strategic options, such as supply security, a source of competitive intelligence, and escape from the onset of entry barriers in certain industries. The benefits of strategic flexibility may supersede profitability, at least for a designated period of time. For example, a strict application of portfolio theory would suggest that most car dealerships would be wise to divest their new-car business. However, new-car sales are often an important driver over time for the highly lucrative service segment.
Given that the BCG growth matrix incorporates the competitive threat to market share from only the most dominant competitor, there is a risk of being misled. A rapidly rising competitor may not show up on the BCG radar until it has gained enough market share to become a dominant player in the market.
A further source of bias may be the selection of data and definition by managers seeking to achieve a star label for their particular management domains. The unintended consequences of the BCG matrix may be politics and game-playing around these subjective analytical parameters.
Although the BCG matrix remains an impressive conceptual framework, it should be used primarily as a starting point for subsequent analysis. When done in conjunction with other complimentary analytical tools and techniques, it can help provide a holistic approach to corporate strategy development.
How to Do It
True to its systematic nature, the process of using the BCG portfolio planning matrix is sequential and can be generalized into nine steps.
Step 1: Divide the Company into Its SBUs or Business Product Lines/Segments
Divide the company into its economically distinct product market segments or according to specific business units (SBU). Take care with this first step, because the business line’s position on the matrix—and hence the model’s strategic recommendations—depends in large part on this initial product definition. You are trying to find units that have an established and separate profit and loss (P&L) or budgeting profile.
Common segmentation criteria include similar situational or behavioral characteristics, a discontinuity in growth rates, share patterns, distribution patterns, cross-elasticity of substitute products, geography, interdependent prices, comparable competition, similar customers served, or a potential for shared experience. A common rule of thumb is that a management team can only realistically manage strategies for approximately 30 different business lines. Anything beyond this number becomes unmanageable and counterproductive. As you might imagine, many management teams have struggled with far fewer than this number!
A great deal of judgment thus is required to determine the extent of segmentation within the product market definition. A wide-enough scope must be maintained to correctly incorporate competitive opportunities and threats from areas outside the traditional or intuitive boundaries. Conversely, the definition of an SBU or strategic product or business line must be narrow enough to allow for distinctions fine enough to make the analysis operational.
Despite the difficulty of properly defining the individual business lines or units, this process of analysis often offers important strategic insights of its own.
Step 2: Measure the Growth Rate of Each SBU or SBL Market
Here’s a useful percentage growth formula for the market growth rate (MGR):

Step 3: Measure the Relative Market Share of Each SBU or SBL
Contrary to the formula in Step 2, relative market share (RMS) is not measured in percentage terms, but as a ratio of the business unit’s or business line’s market share versus that of its largest competitor. The RMS is calculated on a scale where 1.0 is considered a keystone point. An RMS of more than 1.0 indicates that a business unit or product has a higher market share than the leading competitor.
An RMS of 2 shows that the SBU has a twice the market share that of its next-closest competitor. Alternatively, a ratio of 0.5 shows that the SBU has a relative market share half that of its leading competitor.
Note that normally an SBU has more than one product, making the use of a weighted average of the individual product growth rates a suitable technique. Either nominal or real sales data may be used. You want an accurate estimate of relative market share; however, you do not need two decimal levels of precision in generating the ratio!
Step 4: Position Each SBU or SBL Along the Matrix Dimensions
Plotting on the Vertical Axis: Market Growth Rate
Simply draw a threshold point to distinguish SBUs that are experiencing fast growth from those that are gaining market share slowly. The BCG matrix uses the market’s average growth rate as this horizontal line of demarcation. Alternatively, a corporate target may be used to define this threshold. Consistent with the product life cycle, products that lie above this line are considered to be in the growth stage. Products or business lines below this line are considered to be in either the maturity or decline stage of the product life cycle.
Plotting on the Horizontal Axis: Relative Market Share
Experience curve theory asserts that market share is related to total accumulated volume, which is the major factor driving down costs through the experience curve effect. As such, you must now plot relative market share on a semi-log scale. A semi-log graph or plot is a way of visualizing data that is changing exponentially. One axis is plotted on a logarithmic scale.
A cutoff point also needs to be established on the horizontal axis for both high and low market share. The BCG matrix recommends that this vertical line of demarcation be an RMS of 1.0. Any RMS to the right of 1.0 indicates the threshold of competitive strength in that market.
Plot Contribution Bubbles
The two cutoff points (high versus low growth and high versus low market share) allow the graph to be divided into the characteristic four quadrants of the BCG matrix. Plotting the growth rate versus relative market share gives only pinpoint locations on the matrix. A helpful technique is to plot bubbles around these points to indicate the relative size of each SBU in terms of its contribution to total corporate sales or profitability:
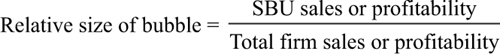
Sales volume generally is the preferred method of determining the size of the bubbles for several reasons. It is easier to make a comparison to competition (see Step 5), competitor profit figures by SBU are difficult to obtain, and internal profit figures are often distorted by arbitrary allocations. Each bubble should also be labeled using a common convention, such as numeric or alphabetical order, for further reference.
Upon determining each unit’s placement within the matrix, you can predict the size, stability, and growth potential of the future earnings of each business unit or line and the cash flow that each business should provide.
The intermediate analytical product of Steps 1 through 4 should look similar to the graph shown in Figure 3.4.
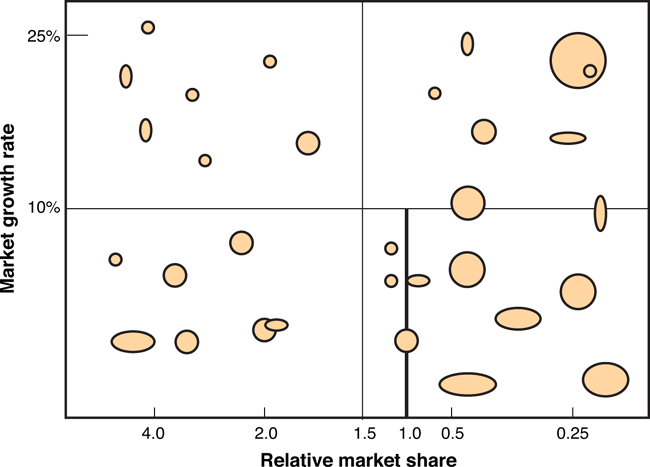
Figure 3.4. Matrix graph.
Step 5: Construct a Matrix for All Competitors
Repeat Steps 1 through 4 to construct matrices for your competitors’ business units or product lines. This will help give the analysis an external focus on the competitive environment. It also allows you to better understand the strategic options your competitors may be considering in terms of investing, divesting, or repositioning particular businesses within their portfolios.
Step 6: Assign Optimal Generic Strategies to Each Business Unit or Product Line
Table 3.1 summarizes the strategies recommended by an application of the BCG matrix after the SBUs/SBLs have been positioned in the matrix. Basically, the strategies can be summarized as the following modes of action: divest the dogs, milk the cash cows, invest in the stars, and analyze the problem children to determine whether they can be grown into stars or will degenerate into dogs.
Table 3.1. Strategies for the BCG Matrix
Source: Adapted from Hax, A. and Majluf, N.S., “The use of the growth share matrix in strategic planning,” Interfaces, February 1983, 46–60.
Step 7: Further Disaggregate the Analysis
The matrix approach can be further defined to map the relative positions of the composite products within each business. This might help with the tactical implementation of Step 6.
Step 8: Introduce Analytical Dynamics
Steps 1 through 7 generate a static analysis. Two analytical tools can be introduced at this stage to incorporate historical market evolution and sustainable growth rate, as described next.
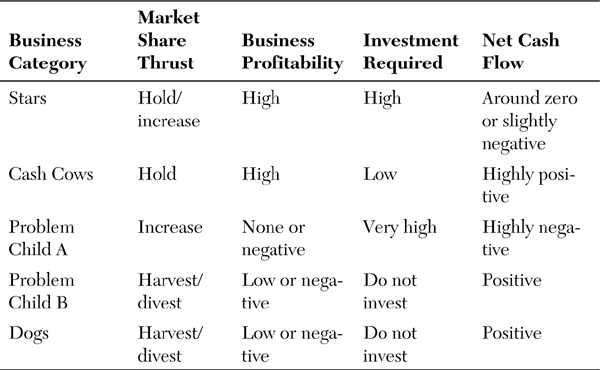
Construct a Share Momentum Graph
The purpose of a share momentum graph, shown in Figure 3.5, is to plot long-term market growth versus long-term sales to detect which SBUs/SBLs are losing market share despite growing sales. This tool is easy to apply because it uses the same data as the matrix. It highlights important distinctions that may be overlooked by using only the BCG matrix.
Figure 3.5. Share momentum graph.
Source: Adapted from Hax, A. and Majluf, N.S., “The use of the growth share matrix in strategic planning,” Interfaces, February 1983, 52.
Sustainable Growth Rate Analysis
Introduced during the high inflation era of the 1970s, the BCG matrix assumed that the company’s growth would be internally financed. In a lower inflation environment, the sustainable growth rate formula can be used to determine the maximum rate of growth without increasing equity. It is a helpful way to integrate financial strategy with the BCG matrix.
g = p × [ROA = D/E (ROA – i)]
g = upper limit on sustainable growth
p = percentage of earnings retained
ROA = tax-adjusted return on assets
D = total debt
E = total equity
i = tax-adjusted cost of debt
Step 9: Iteration
Repeating Steps 1 through 8 serves two purposes: strategic evaluation and competitive analysis.
Strategic Evaluation
The success of the chosen strategies over time can be represented graphically by overlaying a time series matrix chart. This helps you determine if a business unit or business product lines are moving into their desired positions on the matrix. An optimal result would show that problem children increase in both market share and market growth rate to become stars, stars decrease in market growth rate but sustain market share to become cash cows, dogs are either divested or moved into the problem child or star quadrants, and cash cows exhibit stable positions.
Competitive Analysis
You can monitor the progress of rival companies by repeating this process with a time series of matrix graphs compiled from competitors and by constructing an updated share momentum graph for competitors. Competitive threats and opportunities may reveal themselves with these tools. It has been suggested that the best competitive analysis within a matrix format is the share momentum graph (see Figure 3.5), because temporary aberrations will not distort the analysis, and cutoff points may change over time.
Case Study: Google as Viewed in a BCG Portfolio Planning Matrix
Google offers a variety of services, including specialized searches (that is, images, scholarly articles, patents, and so on), desktop search tools, maps, news, and shopping. They also provide free email, blogging, and video hosting. Google earns the bulk of its money by selling ad space on the web pages it delivers when users employ these free features. Google calls this advertising service AdWords, and it is a most successful example of pay-per-click advertising. Through its AdSense, the company also displays text ads on other sites’ web pages, sharing ad revenues with content publishers.
Since its inception, Google has sought to develop its product portfolio by moving into mobile, software, social networking, broadband, and other areas. It aims to help people interact with the exploding amount of information generated globally. Today, in addition to its venerable search services, YouTube, and Gmail products, Google’s services are primarily in the following four categories:
1. Advertising. This includes businesses such as AdWords, AdWords Express, Google Local, Google Mobile, Learn with Google Engage, and Google Offers, among others.
2. Publishing. Its businesses here include AdSense, DoubleClick, +1 Button, and Website Optimizer, among others.
3. Managing. Consists of the operating systems and platforms comprised of Android, Google Chrome OS and Google Chrome, Google TV, Google Books, Enterprise Search, Google Shopping, and Earth and Maps Enterprise, among others, exist in this space.
4. Business Essentials. This includes Google Ads, Google Analytics, Google+ for Business, and Google Apps for Business, among others.
In the process, it has revealed a number of internal blind spots, including overlooking predictable consumer concerns such as privacy worries, the need for prompt customer service, and the importance of intuitive products.
Analytically taking a BCG approach to Google’s product strategy, you can see what Google is trying to do (see Figure 3.6):
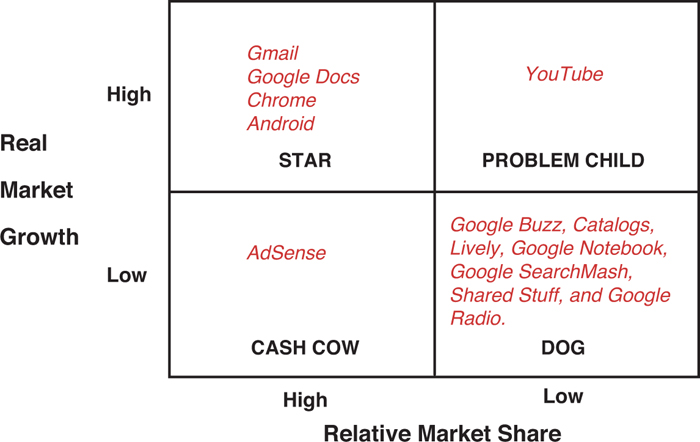
Figure 3.6. Google BCG product portfolio.
Source: Adapted from www.broadstuff.com/archives/2108-Google-from-a-digital-strategists-point-of-view.html (accessed June 18, 2012), and www.marketwatch.com/investing/stock/GOOG (accessed July, 6, 2012).
• Cash cows. The venerable search and ad business (AdSense), where the company first made its name, is Google’s cash cow. As recently as 2012, it accounts for over 95% of the revenue as well as lion’s share of the profit Google earns.
Google has a dominant market share, but over time it is a slowing market relative to the rapid growth of technology sectors. It is also under increasing competitive pressure from social media rivals like Facebook, online retailers like Amazon, niche search companies like Baidu in China, and from other large companies like Microsoft and its multiple businesses that directly and indirectly compete with Google’s businesses. Thus, Google is doing what every company is advised to do in this position—investing its surplus in faster-growing industries and therefore keeping up the pace.
• Problem Children (question marks). Most of Google’s acquisitions and some of its internal developments tend to be in the question mark camp—small market shares in rapidly growing markets. Google likely has more of its offerings currently in this category than the other three. Whether it is cloud offerings or Google+, no doubt the strategic thinking is that the Google infrastructure will be able to rapidly ramp up the growth of these small companies. In the past, Google has been quite good at this, refining the offerings before finally launching.
The problem is that this strategy has not always worked, and many of the acquisitions have withered, finding themselves becoming dogs. For example, Chrome could have been a dog. The browser market is mature and it had low (that is, single digit levels) market share as recently as the start of 2010. Chrome struggles with Internet Explorer, Mozilla FireFox, Opera, and Safari, among others, for traction. The company made major investments in consumer ad campaigns for Chrome over the last two years. These have significantly increased market share, so much so that the browser passed Mozilla’s Firefox in 2012 to become the leader in market share, thus keeping Chrome from being another failure. Nevertheless, its market success came at a significant cost to the company and diverted resources from being invested in other areas of its portfolio.
• Dogs. These are offerings that lose market share, and/or the sector declines. Google placed some bets early with examples like Google Buzz, Catalogs, Lively, Google Notebook, Google SearchMash, Shared Stuff, and Google Radio. The graveyard of Google offerings is littered with canine carcasses from failed bets.
This situation is a market reality for many successful technology-focused businesses. Remember, low-cost option plays are typically an astute market tactic for a company with resources available for investing in growth and innovation. The strategic problem this creates for Google executives is when too many acquisitions fail or force Google into far more high-cost/high-risk plays after the initial investments fizzle.
• Stars. The aim of all the acquisitions is clearly to become stars—businesses that surpass the old ones and launch Google into new areas. Gmail, Google Docs, and YouTube are the current successes, but none of them makes money. In fact, YouTube would be bankrupt if it weren’t for massive subsidies.
The company’s Android Market, which was renamed Google Play in 2012, is a clear star, growing rapidly in a market currently dominated by its rival Apple’s App Store. Stars have to make money eventually. Very large services that lose money are a millstone for any company and may well attract regulatory attention for being anticompetitive.
Like many technology-focused businesses, Google has mostly struggled to create stars. This is most noticeable in the realm of social media services, the cloud, and mobile devices. Google doesn’t actually have a lot of clear-cut stars. Many of its offerings remain unprofitable.
So Google needs to engineer a strategy that produces more sustainable successes for its offerings positioned in this quadrant. With an engineering-centric culture and key blind spots in the areas of privacy and complexity, Google may have the wrong sort of company culture to effectively launch and sustain these new services.
Looking at Google through the lens of the BCG portfolio planning matrix not only provides some helpful insights but also highlights some of the limitations of this tool. For example, Google participates in emerging, global industries that undergo rapid innovation, not the kind of traditional innovation that the BCG approach was originally conceptualized to address. Google’s offerings are often disruptive by nature and, as such, make difficult or questionable the use of market-based figures like relative market share and growth rate. Many of its offerings are also free and are not designed to make a profit themselves, but instead create and enlarge an increasingly integrating Google ecosystem that drives its adopters toward the profit-making parts of the company’s portfolio (that is, its search and advertising offerings). Last but not least, because of the innovative nature of its business model, making simple prescriptive suggestions based on which of the four quadrants one of Google’s offerings falls into would be dubious in the absence of other analytical insights.
So, what’s next for Google?
Google’s decision makers can use the analytical outputs of the BCG portfolio planning matrix to ensure the organization has enough stars to secure high-growth, that it has enough cash cows to provide the funding for this future growth, and that it has enough question marks targeted with the potential to be turned into future stars. As such, the disciplined thinking that can be generated by applying the BCG and similar portfolio planning approaches can be valuable to its executives moving forward, even if the actual application of the models are fraught with practical challenges.
The BCG portfolio planning matrix also provides strategic context by which the executives at Google’s rivals can use to help plan their strategies. Should they choose to attack some of Google’s question marks, acquire complimentary companies to thwart some of its stars, make moves in areas where Google has no stars or question marks, or try and drain its cash cow search/advertising business? By looking at Google’s matrix, as well as their own and their more important rivals, they can generate greater understanding about how competitive rivalries may evolve over time.