6. Financial Ratios and Statement Analysis
Description and Purpose
A company’s published annual report and accounts usually contain a bewildering array of figures, which are often difficult to analyze. Financial statement analysis helps managers understand a company’s financial performance, competitive situation, and future prospects. It also gives insight into the company’s financial decision-making and operating performance. Ratio analysis provides insights into the relationships between two or more amounts in a company’s financial statements.
Basic Concepts Underlying Financial Ratio and Statement Analysis (FRSA)
The basic equation that expresses the relationship of assets and claims on assets is called the accounting equation:
assets = liabilities + owners’ equity
Assets generally are classified into three categories:
• Current assets are cash and other assets expected to be converted into cash within one year, such as marketable securities, accounts receivable, notes receivable, inventories, and prepaid expenses.
• Fixed assets are business assets that have relatively long lives and are used to produce or sell goods and services, such as equipment, machinery, furniture and fixtures, and land and plants.
• Noncurrent assets are investments in securities and intangible assets such as patents, franchise costs, and copyrights.
Liabilities generally are classified into two categories:
• Current liabilities are the amounts owed to creditors that are due in one year.
• Long-term liabilities are claims of creditors that do not come due within one year, such as bonded indebtedness, long-term bank loans, and mortgages.
Owners’ equity is the claims of owners against the business. This is the residual amount computed by subtracting liabilities from assets. Its balance is increased by any profit and reduced by any losses incurred by the business.
Components of Financial Statements
Statements commonly used by analysts include the income statement, balance sheet, statement of changes in financial position, and statement of changes in owners’ equity.
• The income statement (or profit-and-loss statement) summarizes the results of a company’s operations in terms of revenue and expenses for a period of time called the accounting period. Net income is derived from the accrual measurement of revenue and expenses. The income statement generally is perceived as the most important financial statement because it reveals whether the shareholders’ interests in the organization have increased or decreased for the period after adjusting for dividends or other transactions with owners. The income statement also helps users to assess the amount, timing, and uncertainty of future cash flows.
• The balance sheet shows what a company owns (its assets) and any claims against the company (liabilities and owners’ equity) on a particular date. It provides a snapshot of a company’s financial health at a particular point in time.
• The position statement (also known as the statement of changes in financial position or cash flow statement) helps explain how a company acquired and spent its money.
• The statement of changes in owners’ equity shows the gap between the amount of owners’ equity at the beginning and end of a period.
Applying ratio analysis to financial statements enables you to make judgments about the competitive success, failure, and evolution of a company over time. You also can evaluate how it is performing compared with similar companies in the same industry. Ratio analysis can help a company figure out competitors’ strengths and weaknesses. For example, if you find weaknesses in a competitor’s performance, your company may be able to take measures to exploit them.
Assessing the Appropriateness of Ratios
Three principal benchmarks are used to assess the appropriateness of ratios.
The first benchmark is the company’s performance history. It is useful to review the ratios in the current year relative to what they were over several previous years. This enables you to discover any favorable or unfavorable trends that are developing over time, as well as to identify any numbers that have changed dramatically in a defined period of time.
The second benchmark is to compare a company to specific competitors. If the competitors are publicly listed companies, obtain copies of their annual reports, and compare each of the focal company’s ratios with each of the competitor’s. This is particularly helpful in identifying why the focal company is doing better or worse than specific competitors.
The third benchmark is an industry-wide comparison. You need to obtain data about industry averages, much of which you can find from Internet and government sources. Dun & Bradstreet and Risk Management Association are two examples of commercial sources that collect financial data, compute ratios by industry, and publish the results. The information is often broken down by size of company and in a way that allows you to determine how far from the norm any company is.
Strengths
FRSA is a helpful information overload tool. It can find patterns in large amounts of disconnected data by
• Transforming financial data into manageable and meaningful outputs
• Connecting the dynamic income statement with the static balance sheet into one integrated analysis
FRSA is versatile and easily amenable to internal company analysis and competitive analysis of rivals and industry structure. It allows you to determine a company’s ability to succeed through its application of a generic strategy, such as low-cost producer, niche pursuer, or differentiator. By combining the FRSA with numerous other techniques, such as those described in other chapters, you can gain a good picture of a company’s likelihood of strategic and competitive success.
Weaknesses
Financial ratios are based on historical accrual accounting information. As such, they do not offer the analyst any direct insights into future cash flow, an important component of value-based management. This can be even more important with embryonic, entrepreneurial companies that have larger burn rates and cash needs during their earlier years.
Additionally, a single ratio does not give you enough information to make a judgment about a company. You need more data to do so.
Accountants do not include as assets on balance sheets certain items that are critical to a company’s growth and well-being, such as the quality of its employees. Financial statements virtually ignore these increasingly important intangible assets—a key source of competitive advantage in an information or knowledge-driven economy. FRSA is inherently limited as an analytical tool for companies with valuable brand names or corporate reputations, intellectually skilled workforces, or other intellectual capital.
Not all financial statements are of equal quality. Reporting authorities and accounting overseers in separate countries may require different conventions, which can make comparisons difficult. Audited statements provide you with a higher probability of accurate financial information. However, published ratios generally are not subject to public audits, with the exception of the earnings per share (EPS) ratio.
Overreliance on industry norms is akin to benchmarking for mediocrity instead of best practice. Even though it is important to use industry norms to evaluate financial performance against industry peers, you should be careful when interpreting the results. Analysts who rely too much on industry comparisons risk leading their companies to the netherworld of what Michael Porter aptly calls being stuck in the middle of the industry’s parabolic profit curve. To see how this can occur, consider an industry in which half of the rivals are pursuing a low-cost strategy while the other half are pursuing a differentiated strategy. Comparing a company’s ratios to the industry norms, by definition, targets average performance. Success in meeting these average targets necessarily relegates the company to the lowest point on the industry profit curve. At one end, the average company’s cost structure is higher than that of the low-cost specialists; at the other end, premium companies surpass the average company’s level of differentiation.
When using industry norms, you must also be sure not to compare dissimilar industry groups. Direct financial comparisons to rivals outside an industry group may provide only low, short-term utility. Even comparisons within industry groups are fraught with difficulty when rival companies operate on a different portion of the industry profit curve by virtue of their chosen low-cost, differentiation, or focus strategies. Additionally, because most industry norms are calculated from aggregated financial statements, comparing a company’s financial performance to a diversified company will cause a critical comparability problem if the lines of business are radically different.
Making internal comparisons to past company performance is also risky. One of several manifestations of this risk is complacency from seemingly adequate improvements, while in reality the company is slipping relative to the performance of rivals. This problem is especially prevalent in fast-growing markets, where differences in relative competitive performance may not be painful in the short term but will have serious repercussions for long-term competitive positioning.
You should also carefully consider the effects of management choices on the results of operations as reported in the financial statements. In closely held businesses, it is not uncommon for the financial statements to reflect the discretionary choices of the business owner or senior management. Sometimes significant adjustments can be required to reword the financial statements to accurately portray the business’s operations.
The choice of accounting method may have a significant impact on the income reported on the income statement and the value of the asset reported on the balance sheet. This is especially pertinent when you do international competitor comparisons and when competitors have multinational operations that potentially use different accounting schemes. Other technical considerations that could distort the validity of the comparison include differences in accounting policies (different depreciation schedules, inventory valuation, and capitalization), account classification, or year-ends across companies.
Even when a company’s financial ratios appear to conform to industry averages, this does not mean that the company has no financial or other strategic management problems. For example, the company may be neglecting to exploit a clear differentiation advantage through which it could outstrip average industry performance. Alternatively, perhaps the company’s finances look good at the moment, but a serious competitive threat could reverse them in the near future.
In short, financial ratio analysis is a useful tool for analyzing management’s decisions as they are manifest in the marketplace, but it cannot replace the insights afforded by the application of a variety of analysis tools.
How to Do It
Performing an FSRA can be divided into several steps:
1. Choose the appropriate ratios to analyze.
2. Locate the appropriate sources to provide the raw data with which to calculate the ratios. This topic is better covered by books on the larger competitive intelligence data collection process.
3. Calculate the ratios, and compare them.
4. Check for opportunities and problems.
Following are some common ratios for analyzing financial statements.
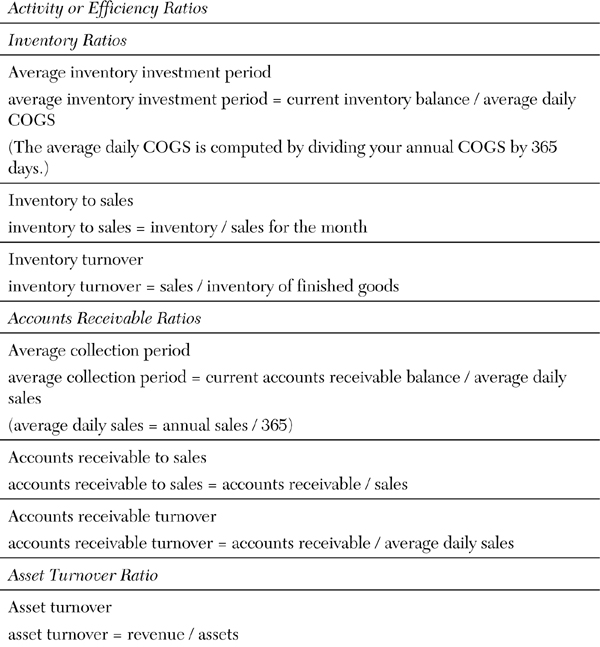
Activity or Efficiency Ratios
These include inventory, accounts receivable, and fixed and total asset turnover ratios.
Inventory
Depending on the nature of the business (retail, wholesale, service, or manufacturing), the efficiency of inventory management may have a significant impact on cash flow and, ultimately, its success or failure.
Average Inventory Investment Period

This measures the amount of time it takes to convert $1 of cash outflow used to purchase inventory to $1 of sales or accounts receivable from the sale of the inventory.
The average investment period for inventory is similar to the average collection period for accounts receivable. A longer average inventory investment period requires a higher investment in inventory. A higher investment in inventory means that less cash is available for other cash outflows, such as paying bills.
Inventory to Sales
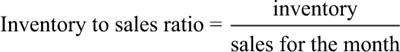
This looks at the company’s investment in inventory in relation to its monthly sales. It helps identify recent increases in inventory and is a quick and easy way to look at recent changes in inventory levels, because it uses monthly sales and inventory information.
This ratio helps predict early cash flow problems related to a business’s inventory.
However, when the only information available is based on inventory information from the previous year, it can be used to provide a rough guide.
Inventory Turnover
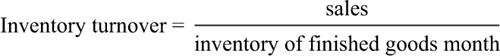
This is the most basic tool for assessing the organization’s investment in inventory. It helps you decide if the company’s investment in an inventory item or group of items is excessive, too low, or just right. From a cash flow perspective, performing turnover analysis is particularly useful for finding inventory items that are overstocked.
Accounts Receivable
Accounts receivable represent sales for which payment has not yet been collected. If the business normally extends credit to its customers, the payment of accounts receivable is likely to be its single most important source of cash inflows.
The analysis tools described in the following sections can be used to help determine the effect that the company’s accounts receivable have on its cash flow.
Average Collection Period
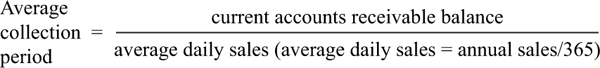
This measures how long it takes to convert average sales into cash. This measurement defines the relationship between accounts receivable and cash flow. A longer average collection period requires a higher investment in accounts receivable. A higher investment in accounts receivable means that less cash is available to cover cash outflow.
Accounts Receivable to Sales

This looks at the company’s investment in accounts receivable in relation to sales. It helps you identify recent increases in accounts receivable and can be a quick and easy way to examine any recent changes. The more recent information of the accounts receivable to sales ratio quickly points out cash flow problems related to the business’s accounts receivable.
Accounts Receivable Turnover
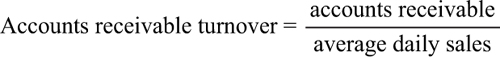
This is a measure of the average length of time it takes a company to collect the sales made on credit.
Asset Turnover
This is the ratio of sales (on the income statement) to the value of the company’s assets (on its balance sheet).

Asset Turnover indicates how well a business is using all its business assets to generate revenue, rather than just its inventories or fixed assets. Generally, the higher the ratio, the better, because a high ratio indicates that the business has less money tied up in assets for each dollar of sales revenue. A declining ratio may indicate that the business has overinvested in plant, equipment, or other fixed assets. Companies with low profit margins tend to have high asset turnover; those with high profit margins have lower asset turnover. This indicates their pricing strategy. In computing this ratio, it may be helpful to compute total assets by averaging the total assets at the beginning and end of the accounting period.
This ratio indicates how well a company is using all its business assets to generate revenue, rather than just its inventories or fixed assets. A high asset turnover ratio means a higher return on assets, which can compensate for a low profit margin.
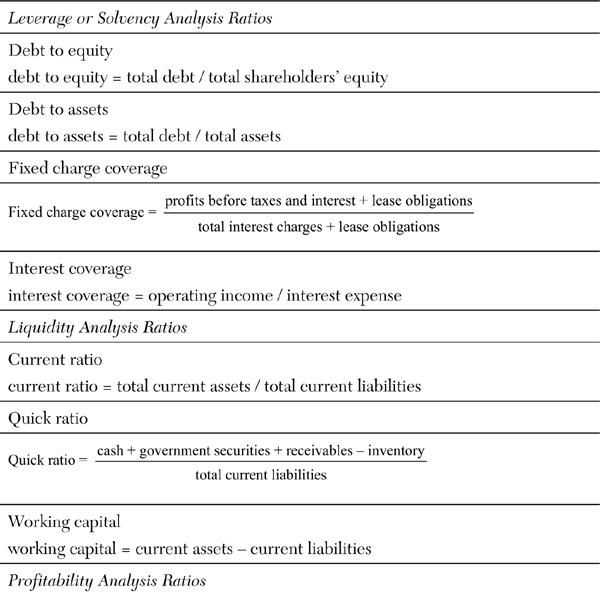
Leverage or Solvency Analysis Ratios
Commonly used solvency ratios are debt to equity, debt to assets, coverage of fixed costs, and interest coverage.
This group of ratios is designed to help you assess the degree of financial risk a business faces. Financial risk in this context means the extent to which the company has debt obligations that must be met, regardless of its cash flow. By looking at these ratios, the analyst can decide whether the company’s level of debt is appropriate.
Debt to Equity
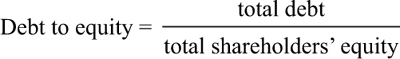
This indicates the degree of financial leverage that the company is using to enhance its return. It is a measure of the funds provided by creditors versus the funds provided by owners.
A rising debt-to-equity ratio may signal that further increases in debt caused by purchases of inventory or fixed assets should be curtailed.
Improving this ratio involves either paying off debt or increasing the amount of earnings retained in the business until after the balance sheet date.
Debt to Assets
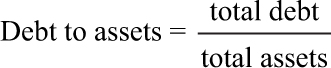
This compares the percentage of assets financed by creditors to the percentage financed by the business owners. Historically, a debt-to-asset ratio of no more than 50% has been considered prudent. A higher ratio indicates a possible overuse of leverage, and it may indicate potential problems in meeting the debt payments.
Improving this ratio means taking steps to either increase the value of the company’s assets or pay off debt. If the company decides to pay off debt, it will also improve its current ratio and debt-to-equity ratio.
Fixed Charge Coverage

This shows the company’s ability to meet its fixed obligations of all types. The higher the number, the better.
Obviously, a company’s inability to meet any fixed obligation is a threat to its well-being. Many working capital loan agreements specify that a company must maintain this ratio at a specified level so that the lender has some assurance that the company will continue to be able to make its payments.
Interest Coverage
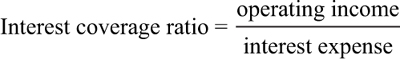
This is also known as the times interest earned ratio. It is similar to the times fixed charges earned ratio but focuses more narrowly on the interest portion of the company’s debt payments.
By comparing the ratio of operating income to interest expense, you can measure how many times the company’s interest obligations are covered by earnings from its operations. The higher the ratio, the bigger the company’s cushion, and the more easily it can meet interest payments. If this ratio declines over time, the company’s financial risk is increasing.
Liquidity Analysis Ratios
These ratios indicate the ease with which assets can be turned into cash. They include the current ratio and quick ratio. Liquidity ratios are sometimes called working capital ratios (the difference between current assets and current liabilities). Generally, the higher they are, the better, especially if the company is relying to any significant extent on creditor money to finance its assets.
Current Ratio

This is one of the most popular measures of financial strength. It is a good indicator of a company’s ability to pay its short-term obligations.
The main question this ratio addresses is: Does the company have enough current assets to meet the payment schedule of its current debts with a margin of safety for possible losses in current assets, such as inventory shrinkage or collectable accounts? The higher the ratio, the more liquidity the company has. A generally acceptable rule of thumb for a current ratio is 2:1. But whether a specific ratio is satisfactory depends on the nature of the business and the characteristics of its current assets and liabilities. The minimum acceptable current ratio is 1:1, but that relationship usually suggests potential risks or problems.
Quick Ratio

Also known as the acid test ratio, this ratio is one of the best measures of liquidity. It describes how quickly a company can turn its current assets into cash.
The quick ratio is a more exacting measure than the current ratio. By excluding inventories, it concentrates on highly liquid assets with values that are fairly certain. It helps answer this question: If all sales revenues stop, could the business meet its current obligations with the readily convertible “quick” funds on hand?
An acid test of 1:1 is considered satisfactory unless the majority of a company’s “quick assets” are in accounts receivable and the pattern of accounts receivable collection lags behind the schedule for paying current liabilities.
Working Capital
working capital = current assets – current liabilities
This is the amount of liquid assets a company has to build its business, fund its growth, and produce shareholder value.
The best way to look at current assets and current liabilities is to combine them into working capital. Working capital can be positive or negative. If a company has ample positive working capital, it has the cash on hand to pay for the items it needs. If it has negative working capital, its current liabilities are greater than its current assets, and it has less ability to pay for the items it needs. A competitor with positive working capital will always outperform a company with negative working capital.
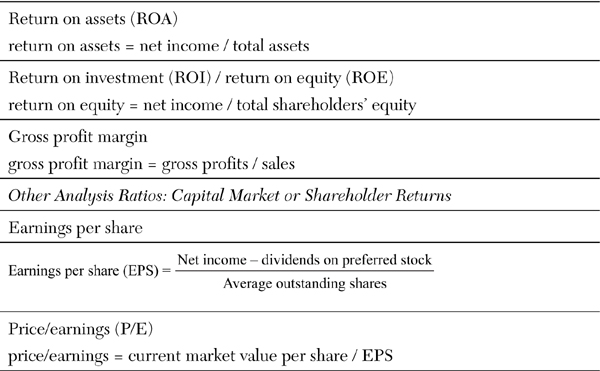
Profitability Analysis Ratios
These ratios are probably the most important indicators of a business’s financial success, because they demonstrate its performance and growth potential. The most common of these include return on assets, return on equity, profit margin (which can be in either gross or net form), and asset turnover.
Return on Assets (ROA)
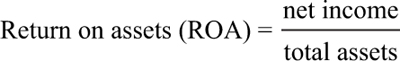
This is the ratio of net income to total assets. It is a measure of how well a business is using its assets to produce more income. It can be viewed as a combination of two other ratios: net profit margin (ratio of net income to sales) and asset turnover (ratio of sales to total assets). A high return on assets can be attributed to a high profit margin, a rapid turnover of assets, or a combination of both.
Return on Investment (ROI) / Return on Equity (ROE)
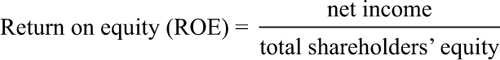
This is the ratio of net income (from the income statement) to net worth or shareholders’ equity (from the balance sheet). It shows what the company earned on its investment in the business during the accounting period. This ratio compares a business’s return on equity to what it might have earned in the stock market during the same accounting period. Over time, a business should be generating at least the same return that it could earn in more passive investments, such as government bonds. A high return on equity may be a result of a high return on assets, extensive use of debt financing, or a combination of the two.
In analyzing both ROA and ROE, don’t forget to consider the effects of inflation on the assets’ book value. Although financial statements show all assets at their book value (original cost minus depreciation), the replacement value of many older assets may be substantially higher. A business with older assets generally would show higher return percentages than a business with newer assets.
Gross Profit Margin
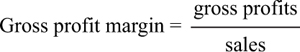
This is the amount of sales dollars remaining after the cost of goods sold (COGS) has been deducted. If a company’s gross profit margin declines over time, this may mean that its inventory management needs to be improved, or that its selling prices are not rising as fast as the costs of the goods it sells. If the company is a manufacturer, this could mean that its costs of production are rising faster than its prices, and adjustments on either side (or both sides) may be necessary.
The net profit margin shows the company’s bottom line: how much of each sales dollar is ultimately available for the owners to draw out of the business or to receive as dividends. This ratio takes into account all the company’s expenses, including income taxes and interest.
You should have some idea of the prospective range of the company’s profit margin, which is in large part determined from historical data. If a company fails to meet its targets, this could mean that it has set unrealistic goals or is not managing as efficiently and effectively as it could. However, the ratio itself does not point to what a company might be doing wrong. Looking at the gross margin or operating margin is a better way to address that problem.
The absolute level of profit may indicate the size of the business, but on its own it says very little about company performance. To evaluate the level of profit, profit must be compared and related to other aspects of the business. Profit must also be compared to the amount of capital invested in the business and to sales revenue.
Profitability ratios inevitably reflect the current business environment, so you must also consider the business, political, and economic climate when looking at the trend of profitability for one company over time. Comparisons with other businesses in the same industry can indicate how well management is performing compared to other companies in the same business environment.
Other Analysis Ratios: Capital Market or Shareholder Returns
The use of capital market or shareholder returns analysis ratios is probably more important for investors than it is for strategic or competitive analysis. These are more commonly thought of as investment measures as opposed to performance measures.
Earnings Per Share
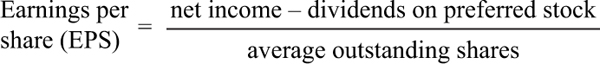
This is the single most popular variable in dictating a share’s price. Company earnings are income from sales or investment after expenses are paid. The way in which a business conducts its operations is important when you evaluate a company’s earnings. Companies that devote significant resources to creating a new product may have relatively low earnings, but that can change when sales of the new product grow and profits rise. Meanwhile, companies that have strong earnings but are investing inadequate funds into the business may have significant problems in the future.
Price/Earnings

This is often called “the Multiple.” The earnings-per-share figure is usually from the last four quarters (the trailing P/E ratio). But sometimes it is from the estimates of the earnings expected over the next four quarters (the projected P/E ratio) or from the sum of the last two quarters and the estimates of the next two quarters.
For the most part, a high P/E means high projected earnings in the future. A P/E ratio on its own doesn’t give much information. However, it is useful to compare the P/E ratios of other companies in the same industry to the market in general or to the company’s own historical P/E ratios.
Table 6.1 summarizes the formulas discussed in the previous sections.
Methods of Ratio or Measure Comparison
No single ratio has meaning by itself, but comparing ratios is critical for effective financial ratio analysis. A helpful solution to combat analytical myopia is to strike a balance between the industry norm, historical analysis/internal benchmarking, and competitive external benchmarking approaches.
There are two basic ways to use financial ratios. The first is to compare the company’s ratios with those of other companies in the industry. The second is to compare the company’s present ratios with its own past performance ratios.
Industrial Comparison
Industrial comparison looks at the company’s performance in relation to its competitors to show any differences in their operating efficiency. Once the problem is found, the company can take action to correct it. These industry averages can be found in publications such as Dun & Bradstreet’s Key Business Ratios.
There are several ways to obtain financial ratios or comparisons for industries and companies. Some are free, and others are available for a fee. They are described in Table 6.2.
Table 6.2. Information Sources for Financial Statement Analysis
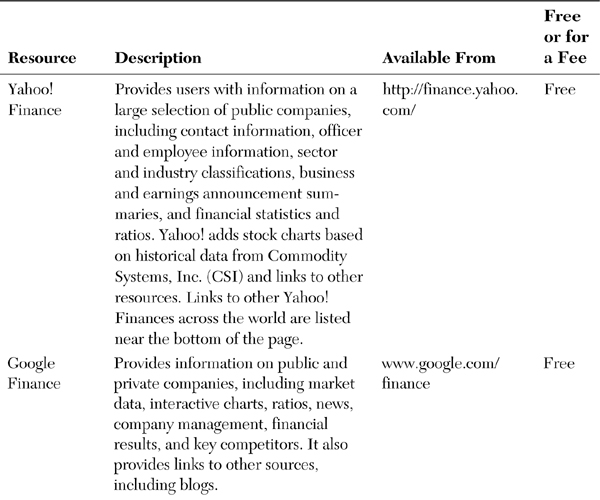
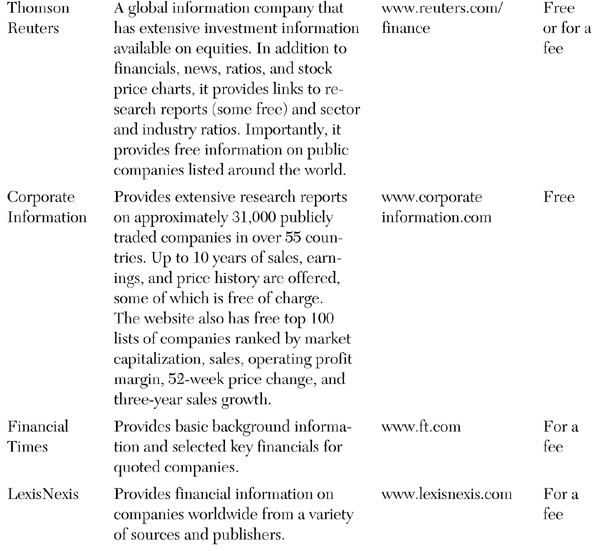
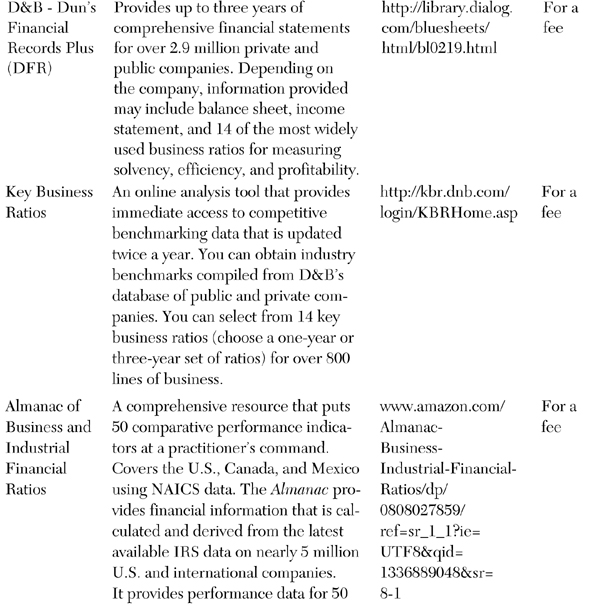
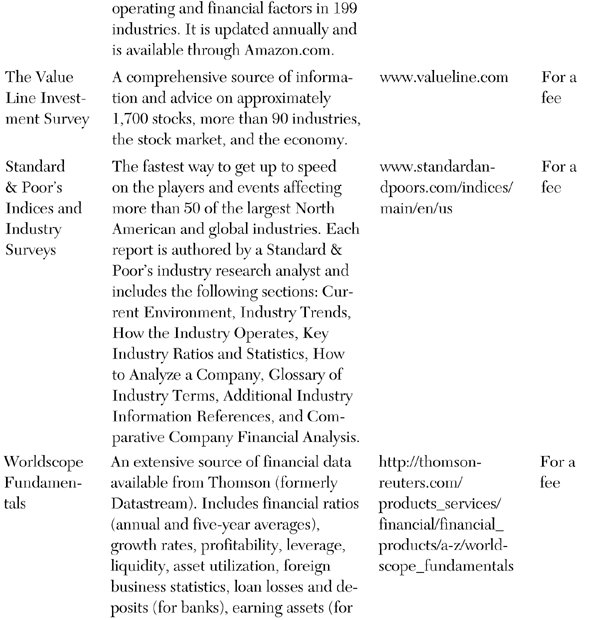
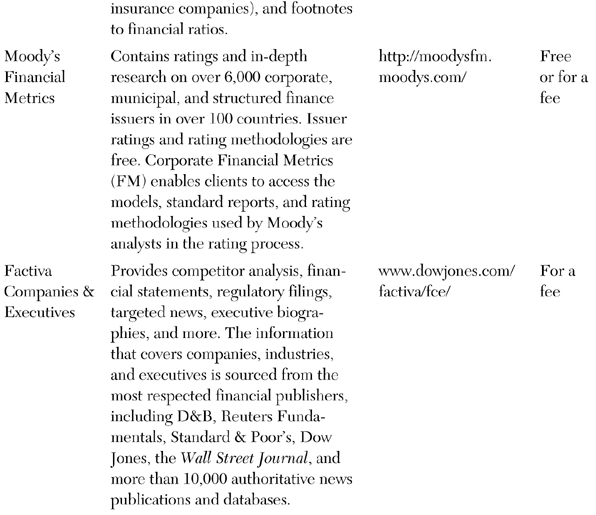
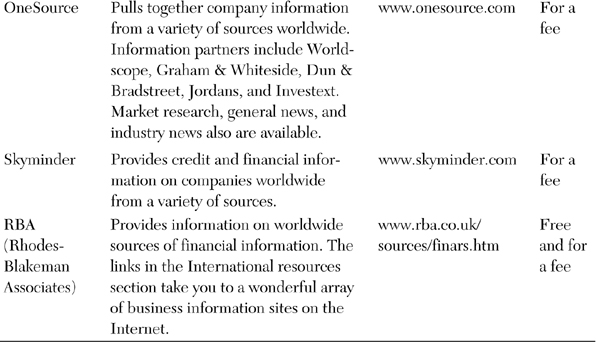
Trade associations and individual companies often compute ratios for their industries and make them available to analysts. Published financial statements on the Internet also offer a source of raw material for companies not covered by these sources.
To deal with corporations of significantly different sizes in a particular industry, it can be helpful to create common-size financial statements. The common size is usually 100. This procedure can help you determine when a competitor departs from industry norms. It also allows you to ask a more refined set of questions to understand the causes driving this phenomenon.
Across Time Performance
You also can spot problems by comparing a company’s present performance to how well it did over the past few years. This shows you how well it is progressing in correcting any problems. By looking at past trends, a company can determine how effectively it is accomplishing its goals. You should use the same time frame when making comparisons. If you don’t, effects caused by recessions or seasonal fluctuations could result in erroneous conclusions or judgments.
Consolidation and Segmented Analysis
Financial statements of public companies are legally required to provide segmented reporting in addition to consolidated operations. Most countries require public companies to provide enough information to explain about three quarters of the company’s revenue. However, due to the competitive sensitivity of segmented information, public companies generally follow the letter of the law rather than the spirit of the law. In other words, proprietary concerns outweigh the need for public accessibility to information. Therefore, segmented reporting includes only the bare minimum of information about each segment’s revenue, net income, and total assets. The only supplement to this meager reporting is information about the industry and the geographic dispersion of its facilities and customers.
Although segmented reporting is certainly more valuable than consolidated information when comparing a company to its distinctly diversified rivals, you should not rely on it. The accuracy and comparability will be minimal because segmented revenue will be derived from internal transfer prices, and the basis for allocating costs will be unknown to the external analyst.
Despite the requirement to reconcile or integrate the segment information back into the consolidated statements, segmented data does not provide enough information for you to calculate many ratios. Furthermore, even when ratios can be calculated, you must remain aware of these limitations when performing ratio analysis on segmented data.
Remember that a company’s financial statements are only a starting point for analysis. If a statement shows that accounts receivable have experienced a significant downward trend over the last few years, this could mean that the company is collecting the accounts more aggressively (which is good). Or it could possibly mean that the company is writing off accounts as uncollectable too soon (which is bad). Individual numbers aren’t good or bad in themselves. You may have to dig deeper into certain numbers for the reason. The key is to use FRSA to spot trends and anomalies and then follow these up with further investigation.
To complete the picture, you must acquire more information about the company’s products, people, technology, and other resources that may give it a competitive advantage in the marketplace. One of the best sources of supplemental information is the nonfinancial section of the annual report. This section often outlines top management’s views on the company’s future and ability to compete.
FRSA is a critical part of a larger, integrated financial statement analysis plan. This plan should include the following key steps:
1. Determine the objectives of the financial statement analysis.
2. Review the current and predicted economic conditions in the industry in which the company operates.
3. Consult the annual report and other regulatory filings to glean information about management and the company’s accounting methods.
4. Analyze the financial statements using the means described in this chapter.
5. Draw relevant conclusions based on the initial objectives.
Case Study: FRSA of the Three Large North American Warehouse Clubs
The discount warehouse and wholesale club segment of the North American retailing industry consisted of three major competitors: Costco Wholesale, Sam’s Club (a Walmart subsidiary), and BJ’s Wholesale Club (aka The Big 3 WCs). Warehouse clubs operated no-frills, self-service, big-box facilities where customers could choose from a relatively narrow assortment of discount-priced merchandise across a wide range of product categories. There were more than 1,200 warehouse club locations in North America and nearly every large metropolitan had at least one of them.
The Big 3 WCs offered items like cleaning supplies, bottled waters, and paper products that they sold in case lots, packaged in large containers, shrink-wrapped in a variety of quantities, and bundled in cartons or giant-sized bags. In nearly every case, the product was available in a larger portion or package than would be found in traditional grocery stores or supermarkets. Warehouse clubs generally limited merchandise selections to category leaders and an assortment of private-label items which maximized sales turnover.
The warehouse clubs were able to attract customers from other outlets such as supermarkets, department stores, drugstores, office supply stores, consumer electronics stores, and automotive stores. Interested shoppers paid an annual membership fee to make purchases at a warehouse club. They did this primarily due to customer convenience and low prices. The Big 3 WCs had substantially lower operating and costs than most other retailing alternatives because they behaved differently and had a different strategy. These differences are summarized as follows:
• Purchased full truckloads of merchandise directly from manufacturers
• Had relatively low labor costs due to reduced operating hours and the fewer number of employees needed in the store while still generating impressive sales volumes
• Displayed items on inexpensive shelving or pallets and had low-tech, inexpensive decor
• Avoided warehousing costs and expenses by keeping their extra inventory on high shelving directly on the sales floor
• Spent minimally on most forms of marketing, relying instead on high quality products and word-of-mouth to keep customer numbers high
The low operating costs of warehouse clubs and high sales volumes were complementary goals for each store location. The warehouse clubs received cash for a large portion of their inventory before they had to pay many of their suppliers. Thus, a warehouse club could finance and pay for a big percentage of its merchandise inventory through the vendor’s payment terms instead of having to maintain significant working capital (that is, current assets minus current liabilities).
The focus of the case is on the similarities and dissimilarities in the strategies and operating practices of Costco, Sam’s Club, and BJ’s Wholesale as reflected by financial ratios and statement analysis. Table 6.3 lists ratios for the purpose of comparing the performance of three warehouse clubs. Note that the fiscal year (FY) data for Sam’s and BJ’s relates primarily to the prior calendar year, whereas the numbers for Costco are for its fiscal years. CAGR stands for compound average growth rate. SG&A (alternatively, SGA or SAG) stands for selling, general, and administrative expenses, which is a major nonproduction cost presented in an income statement.
Table 6.3. Comparing the Performance of Costco, Sam’s Club, and BJ’s Wholesale
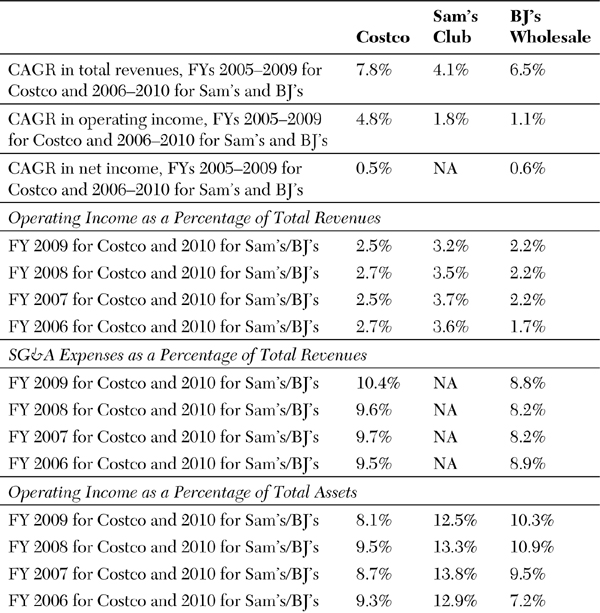
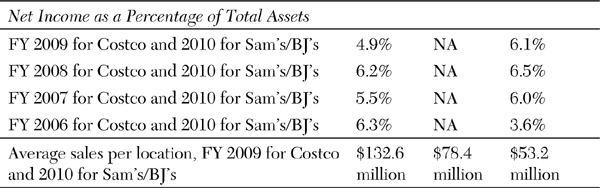
Conclusion: The comparisons are mixed. Costco had the fastest rate of growth in total revenues, the biggest growth rate in operating income, and far and away the highest sales per store location. But Sam’s Club had the best operating profit margin (operating income as a percentage of total revenues) and the best operating income as a percentage of total assets. BJ’s Wholesale had the biggest CAGR in net income, lower SG&A expense percentages, and the overall best net income as a percentage of total assets. You can speculate that Sam’s higher operating profit margins might be in part because some of its distribution expenses are shared with its sister division, Walmart stores and Supercenters. Facilities sharing with other Walmart operations probably also explain why operating income as a percentage of total assets at Sam’s Club far exceed the operating return on assets at both Costco and BJ’s. On the whole, all three competitors have pluses and minuses.
Comparing these further with the ratios demonstrated by substitutes like grocery stores and legacy retailers will also be highly telling why the warehouse clubs have achieved successes well in excess of most of these substitutes. Doing these over time provides the analyst a much richer understanding of whether strategies are producing desired performance and how one rival compares with others. Last but not least, it can help the analyst understand where a competitor or rival might have vulnerabilities that can be exploited through adroit strategic or tactical marketplace actions.