
27
Metrology and Statistical Quality Control
27.1 Introduction
To ensure that quality standards are being met, the actual quality achieved has to be measured. In order to do this, the quality levels must be clearly specified in such a way that measurement is possible. The process of determining whether or not a product, component, material or process conforms to specification is called inspection. In some situations, visual inspection can account for around 10% of the total labour cost of manufactured products, although today, particularly in high volume production, the use of machine vision systems coupled with other automated sensing and handling devices such as industrial robots is widespread. Inspection may be qualitative or quantitative. In qualitative inspection, a product is checked on an accept or reject basis by examining the attributes. For example, a flaw in the glass of a bottle, a crack in a casting or discoloured fruit on a conveyor would be attributes that would cause these items to be rejected. Other aspects of this would be the detection of foreign bodies such as mice or insects on a conveyor in a food processing plant, verification of a completed task in an assembly sequence or checking the degree of swarf build up on a drill bit. Quantitative inspection involves measuring the dimensional features of a product or component and this is the focus of the remainder of this section.
When manufacturing, for example, a shaft and bearing it is not good enough to say that the internal diameter of the bearing is to be exactly 25 mm and the shaft that fits into it has have an external diameter of 25 mm. This is wrong because it is impossible to make anything ‘exactly’ to size except by a very low chance probability and even if something was made exactly to size it would be impossible to measure that it had been achieved. Also, if the shaft was made slightly larger than 25 mm diameter or the bearing internal diameter slightly less, then the two would not be able to fit. In the early days of engineering ‘making to suit’ was the normal method of manufacturing this type of assembly where each component of a product was individually crafted to fit together to form the whole. Another method, called ‘selective assembly’ may very occasionally be used in unusual cases of high volume production. This applies where the clearance between components must be held to such a tight tolerance that the process capability is not able to produce sufficiently precise components. In this case, the components are very accurately measured and graded into various size groupings, subsequently suitable components are matched with each other. This happens with some precision shaft and bearing or piston and cylinder assemblies. However, the mass production systems of today demand interchangeability of components for efficiency in assembly and for parts replacement. For this reason, tolerancing must be used and although we are using a shaft and bearing as an example, the principles of tolerancing apply to all manufactured products.
A tolerance is a permissible deviation from the desired specification. Tolerancing is most frequently associated with dimensional tolerancing and geometric tolerancing (concerned with aspects such as cylindricity and parallelism) of parts, but it can also apply to any specified parameter such as weight, temperature, time, current, voltage, strength, hardness, metallurgical composition, number of blemishes in a paint finish and so on. In our example of the shaft and bearing, the designer could state that the shaft diameter should be 24.98–24.90 mm and that the bearing should be 25.00–25.08 mm internal diameter. Thus the clearance between the shaft and the bearing could vary between 0.02 and 0.18 mm, depending on the machining operation, see Figure 27.1. This is only an illustration, in practice for shafts and bearings tables of limits and fits are used to determine the tolerances to be used. These are given for different types of fits, the two most common being clearance fits and interference fits in which the shaft is a press fit in the hole.

Figure 27.1 Dimensional tolerancing applied to a bearing and shaft to ensure a clearance fit.
In order to verify that tolerances have been achieved it is necessary to carry out some form of measurement and we will therefore now consider some aspects of this essential engineering process.
27.2 Metrology
As the industrial revolution progressed at the end of the eighteenth century, the need for components to be interchangeable became important. Previous to this the low volume of manufactured goods meant that craftsmen could make parts on an individual basis with dimensions hand crafted to fit an assembly. Mass production demanded that parts made in one factory could be brought to another and assembled together with components from other sources. Also, the new high pressure steam technology and mechanism complexity needed components that could fit together with greater precision. This led to the importance of reliable measurement techniques. James Watt in the UK invented a bench type micrometer around 1772 and by 1848 Jean Laurent Palmer in France invented the modern form of micrometer shown later in this chapter.
Today, precision measurement is absolutely essential with products being assembled in one country using components often manufactured in factories from all over the world. For example, a large passenger plane may have its fuselage made in one country and wings in another. When they are assembled they have to fit together without the need of further modification. A modern car, as well as being assembled from parts made in many different countries, also needs to be easily maintained and repaired by removing damaged parts and replacing them with new ones – all of these parts must be interchangeable. The measurement process which, in engineering, covers both the dimensions and geometry of parts is called metrology.
Metrology in general terms is the science of measurement and it is based on the fundamental units of measurement, that is, length, time, mass, temperature, electric current, luminous intensity and amount of substance. Here we are specifically concerned with the branch of ‘engineering metrology’ and we will focus our attention on the measurement of length based on the fundamental SI standard of the metre. Within a factory inspection is carried out during the manufacturing process to ensure that whatever is being produced conforms to the design specifications of the product. But how do we know that our measurement of the produced item is true relative to the fundamental standard metre? The answer lies in the concepts of accuracy, uncertainty, traceability and calibration.
Accuracy as a term is used in an informal manner in the following paragraphs as this is the way it is commonly used by most people and in everyday use by engineers. Formally, in relation to length, accuracy is the closeness of the agreement between the result of a measurement and a true value of the length being measured, we can therefore correctly talk about ‘high’ or ‘low’ accuracy. However, accuracy really should not be used quantitatively since the ‘true’ value cannot be realised perfectly. In metrology, the term uncertainty is preferred since it states quantitatively a range of values within which the true value will be likely to lie. For our purposes we will continue to use the term ‘accuracy’ and we will use it both quantitatively and qualitatively.
Traceability in metrology is the concept of ensuring that the accuracy of any properly calibrated measuring instrument can be traced back through increasingly accurate instruments to the ultimate known primary standard. National Metrology Institutes (NMIs) are responsible for realizing the length standard and they cooperate on ensuring the international standard is maintained. For example, the UK has the National Physical Laboratory (NPL), the USA has the National Institute of Standards and Technology (NIST), Japan has the National Institute of Advanced Industrial Science and Technology (AIST) and Germany the Physikalisch‐Technische Bundesanstalt (PTB). These institutes can check the accuracy of the measuring instruments used by industry and issue a certificate to verify their accuracy. This process is called calibration. These calibrated instruments can then be used by industry to check the accuracy of less accurate instruments and this process continues until the calibration of instruments used by an inspector or machine operator in the factory workshop.
The metre. In order to achieve an absolute value for the metre it has been decided internationally to use the speed of light as the standard. This implies that an absolute value for time is necessary. The fundamental unit of time is the second and of all of the fundamental units this is the one that is stated with the most precision, it is based on the natural resonance frequency of the caesium atom 9 192 631 770 Hz. This is measured to an accuracy of two nanoseconds per day and although there are now clocks much more precise than this it is the caesium clock that provides the standard. Thus a sort of iterative process has taken place with the speed of light stated as 299 792 458 m s−1 and the metre is therefore defined as: the length of the path travelled by light in a vacuum during a time interval of 1/299 792 458 of a second, that is, 3.34 ns. To translate this into a value that can be used as a basis for engineering metrology we can state the metre as a specific number of wavelengths of light. In practice, the source of light is recommended to be that of a helium‐neon laser (HeNe), which has a wavelength of 632.991 398 22 nm. This means that the metre can be delineated as 1 579 800.298 728 wavelengths of HeNe light in a vacuum (from 1/0.000 000 632 991 398 22).
The HeNe laser interferometer utilises the principle of light interference. The monochromatic light from the HeNe laser is in the form of a sinusoidal wave. This will have amplitude ‘a’ and a wavelength λ. A beam splitter divides this light into two rays that follow different path lengths before being recombined with one ray 180°, or half a wavelength, out of phase with the other. This results in the wave patterns shown in Figure 27.2. When this light falls on a surface the eye will see a light band if the amplitude of both rays combine as shown on the left side of the figure and a dark band would be seen if they are combined as shown on the right side of the figure where they interfere, thus cancelling each other out. Thus, as the surface on which the two beams are projected moves towards or away from the light source a sequence of light and dark bands will result. Each change from dark to light and back to dark again will signify a movement of half a wavelength, that is, interference will occur (each dark band) approximately every 316.5 nm. Lengths can then be measured to accuracies of ±1 nm by sub‐dividing the fringes and counting these electronically. Note that a chart of the SI units of scale is included at the end of the book in Appendix A.

Figure 27.2 The principle of light interference of monochromatic light.
27.3 Factory and Workshop Metrology
In practice, within a factory various methods are used to check the sizes of manufactured components.
An important means of obtaining reference lengths is the use of gauge blocks, sometimes called slip gauges or Johansson blocks. These are used as the standard references within companies and are obtainable in various grades. The highest grade will have been calibrated using the HeNe laser interferometer. They are purchased as boxed sets containing a carefully devised range of blocks. The individual blocks can be ‘wrung’ together to create any desired length. The blocks are made from heat treated and stress relieved alloy steels or ceramic material. They are made flat and parallel depending on the grade to within the following accuracy ranges: Reference Gauge ±0.05 μm (0.000 05 mm), Calibration Gauge Blocks ±0.10 μm (0.000 10 mm), Inspection Gauge Blocks ±0.15 μm (0.000 15 mm) and Workshop Gauge Blocks ±0.25 μm (0.000 25 mm). The reference grade blocks will be the most expensive and would only be used for checking the calibration grade blocks, these in turn would be used for checking the inspection and workshop grade blocks.
Gauge blocks are known as end standards as it is the distance between the faces that is important. These are able to provide higher precision than instruments that use line standards, examples of which are hand‐held micrometers, Vernier callipers and engineer's steel rules, all of which are commonly used within the factory or workshop.
Figure 27.3 shows examples of some of these instruments with their associated measurement accuracies.

Figure 27.3 Commercial metrology instruments and typical accuracies. Source: Reproduced with permission of Pratt and Whitney, Mitutoyo, MSCdirect and L. S. Starrett.
Inspection methods that are used to check whether or not a part is within tolerance can be separated into measurement, comparison and gauging.
Measuring instruments can be either direct or indirect. Direct instruments allow a reading of size directly; for example, from a lined scale. Indirect instruments do not contain line scales and are used to transfer dimensions to a direct instrument; this increases the opportunity for error, therefore direct methods should be used wherever possible. Examples of direct measuring instruments used for measuring lengths are the steel rule, the micrometer, the coordinate measuring machine and the laser interferometer. An indirect measurement example would be using internal callipers to acquire the diameter of a bored hole, then using a micrometer to measure the distance between the two calliper points.
Comparators, or deviation type instruments, do not measure an absolute length but instead amplify and measure variations in the distance between two surfaces. For example, a dial indicator gauge as shown in Figure 27.3 translates the vertical linear movement of a spindle into a scale reading on an indicator. The means of translation may be mechanical, mechanical/optical or electrical. To describe the operation assume the height of a machined surface is to be measured. The dial indicator, the item having the reference height – this could be a gauge block assembly and the item whose height is to be measured are all placed on a flat smooth metal or granite table called a ‘surface table’. The indicator spindle is allowed to come into contact with the reference surface and the reading on the indicator dial is noted or set to zero. The spindle is now lowered into contact with the item to be measured and the difference in dial reading noted. The height of the measured item will therefore be the height of the reference ± the dial indicator reading. Accuracies of ±0.0003 mm are obtained using this type of technique.
Gauges used for production purposes are the simplest, quickest and cheapest means of inspecting the size of components. They are usually in the form of GO and NOT GO gauges. For example, when checking a hole a cylindrical gauge will be used such that the GO end should be able to enter the hole while the NOT GO end of the gauge should not enter. ‘Taylor's theory of gauging’ states that the GO gauge checks the maximum metal condition and should check as many dimensions as possible; conversely, the NOT GO gauge checks the minimum metal condition and there should be a separate NOT GO gauge for each dimension. This will ensure that a bad component is not accepted in error. It is apparent that the tolerances to which both ends of the gauge are to be made must be much tighter, normally by a factor of 10, than those of the tolerances of the component being checked.
27.4 Surface Texture and Measurement
Until now we have focused on the measurement of length. However, another important aspect of metrology in manufacturing is the measurement of the surface texture of a component or product. In many cases it is not sufficient to simply state a surface has to be smooth or rough since the texture will strongly influence many aspects of the product. Among these are functionality, cost, aesthetics and corrosion and wear resistance. For example, the outside of a car body is expected to be aesthetically pleasing by being smooth and coloured but also corrosion resistant, the surface texture underlying the surface coating will have a strong influence on the appearance and performance of the finished product. If we consider the outside surface of the engine cylinder block it may be quite rough, this is not a problem since it is not normally seen and there is no functional need for a very specific finish. However, within the cylinder block of the car the cylinder walls will look ‘shiny’ but close examination of the surface texture will show that it is not perfectly smooth. If it was too smooth then lubricant would not adhere to the walls and the pistons could seize, if it was too rough then the piston could break off small particles from the cylinder walls and so reduce the life of the engine by increasing wear. In this case the specification and measurement of surface finish is therefore very important to ensure smooth and efficient operation of the engine.
Generally speaking, the more closely specified the surface finish, the more expensive the product will be. This is because the time the component needs to be worked on will usually increase as the tightness of the specification of the surface finish increases. The surface finish pattern will be influenced by the type of manufacturing process used, for example, turning, milling, grinding, extrusion, forging and casting, will all produce different textures. We are normally concerned with machined surfaces when measuring surface texture.
The short wavelength roughness of the completed component can be given a numerical value. This is usually termed the Ra value and is measured in micrometres. For example, an Ra value of 12.5 μm would be the type of surface finish obtained from rough turning in order to remove metal quickly, whereas a value of 0.4 μm would represent a very smooth surface and by using a lapping process on a flat surface an almost mirror like finish of 0.05 μm could be obtained. The Ra value is a measure of the amplitude of the short wavelength surface irregularities caused by the machining process. This could be due to the feed rate of the cutting tool and any material rupture that occurs during the chip forming process.
Figure 27.4 shows the surface features apparent on a machined component and Figure 27.5 shows the equipment used for their measurement. The roughness pattern is measured by drawing the stylus of a surface texture measuring machine along the surface at right angles to the direction of lay. The lay is the term given to the dominant pattern of the tool marks in a machined component and will be different depending on the process used such as turning, end milling or slab milling.

Figure 27.4 Greatly exaggerated machined surface features. This could be part of the surface of a cylindrical component turned on a lathe.
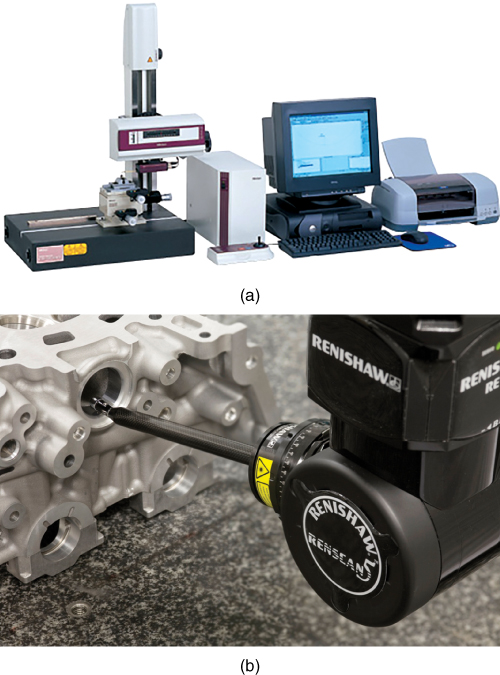
Figure 27.5 (a) A surface texture measuring machine. The stylus can be seen suspended from the column on the left, surface texture information is displayed on the screen. (b) Surface texture stylus being drawn across the machined surface of a bored hole in a casting. Source: (a) Reproduced with permission of Mitutoyo UK Ltd. (b) © Copyright Renishaw plc. All rights reserved. Image reproduced with the permission of Renishaw.
The waviness has a much longer wavelength and the roughness is superimposed on this. Waviness arises due to various factors such as inaccuracies in the machine tool structure or vibration incurred by the cutting process or generated by the machine components. In order to obtain an accurate measure of surface roughness, the waviness height should be excluded otherwise an erroneously high Ra value will be obtained. This is ensured by choosing a short enough cut‐off length over which the stylus is drawn to prevent the effect of waviness being included and this is shown in Figure 27.4 . A flaw or crack is also shown in the figure. In practice, this is likely to be uncommon with good quality materials. However, extremely small flaws can occur and will show up as an irregularity on the trace produced by the stylus.
As well as the specification of product dimensions and surface texture, other parameters such as sphericity, roundness, parallelism and flatness can be specified and measured. The topic is a vast one but this information provides a basic introduction to the essential nature of metrology. The next section considers the application of inspection in high volume production.
27.5 Statistical Quality Control (SQC)
The use of automated processes with integrated automated inspection devices providing 100% ‘in process’ inspection for high volume production are often found. However, whether automated or manual inspection is carried out control of the process is essential. Where high volumes of the same items are to be checked, samples of the items are taken as representative of the whole population. These samples are inspected and the results statistically analysed to determine, (i) if the population is composed of good parts and (ii) if the manufacturing process is in control or likely to begin to produce bad parts in the near future. This activity is called Statistical Quality Control (SQC). It can be used to inspect not only parts being produced by a machine but also to inspect incoming goods to a factory that have been supplied by a vendor. SQC can be implemented using manual or microprocessor‐based methods. Since one of the more important elements in SQC is the construction of control charts, a brief review of the technique is given next.
SQC is based on the principle that there will always be a random variation in the work from which a nominal value is desired. For example, using the shaft described earlier, it is required to be turned to 24.94 mm diameter with a tolerance of ±0.04 mm. Provided the machine has an appropriate ‘process capability’ it will be found that the parts being produced will vary slightly in size but should remain within the range of 24.90–24.98 mm diameter. If the process is in control then the random variation in size will produce a normal distribution about the mean for any population or batch of parts produced. If the machine has been set properly the mean value should lie at 24.94 mm see Figure 27.6a.

Figure 27.6 (a) Distribution of part sizes produced by turning. (b) Properties of the normal distribution curve. (c) Size distribution in relation to tolerance. (d) A control chart for the shaft turning operation.
The properties of the normal distribution curve are well known. It is therefore possible to use these to assist with the ongoing control of our turning operation. The properties of the curve are shown in Figure 27.6 b. This shows that if we set points A and A′ at 1.96 standard deviations above and below the mean, then it will he found that 95% of all items produced will have their sizes between these two points. Also if we set points B and B′ at 3.09 standard deviations above and below the mean, then 99.8% of parts will lie between them. This principle is used to construct control charts.
We can take the normal distribution curve that we would expect to obtain from the item population produced by our process and turn it through 90°, as shown in Figure 27.6 c.
If the tolerance band is now superimposed on the curve it can be seen that, in this case, the process is in control and producing 100% good parts. The actual control charts for the process are constructed by setting ‘Warning Limits’ and ‘Action Limits’ at the 1.96 and 3.09 standard deviation levels, respectively, see Figure 27.6 d. This is based on the principle that there is a 1 in 40 chance of the mean of any sample withdrawn from the process being beyond the warning limit; therefore, if one such is found then subsequent checks should be made. Also if several consecutive sample means were found close to the warning limit then it could indicate the process was drifting out of control. If the process is in control there is only a 1 in 1000 chance of a sample mean being beyond the action limits; therefore if one sample mean is found to be in this region, the process should be stopped for checking.
Control charts are in practice constructed by taking samples from the process when it is known to be working satisfactorily and following a straightforward procedure using tables of figures or computer programs specially devised for the task. The ‘process capability’ is also taken into consideration. This is the relationship of the tolerance band – that is, the upper specification limit minus the lower specification limit – to the standard deviation of the process. This can also be expressed as an RPI or ‘Relative Precision Index’, which is the total tolerance divided by the average sample range produced by the process. By comparing the ratios obtained to the sample size being used it can be determined, from standard tables, whether the process is of low, medium or high relative precision. It can then be decided if adjustments have to be made to the control charts; for example, if the process is low precision, rapid action is essential if any deviation from normal operation is observed, whereas with high precision more process drift may be allowed before action is necessary.
These charts are used for monitoring ‘variables’ that are measurable in some quantitative manner, for example, size, weight or volume. However, they can also be constructed for monitoring ‘attributes’ as noted earlier in this chapter.
One of the aspects of the manufacturing process that this chapter has shown is that the tolerance, determined by the product designer, has an influence on the type of measurement system needed to check individual components. The tighter the tolerance specified the more precise and expensive the measurement method required. Also tighter tolerances imply more time required to create the product and often more time required to inspect it. All of this will increase the cost of the product and care has to be exercised to ensure optimum values are selected in order to achieve a competitively priced end product.
Review Questions
- 1 What fundamental physical constant is used to establish the length of the metre and why has this been used?
- 2 Quantitatively define the ‘International Metre’.
- 3 What is the name given to the technique used to establish the ‘International Metre’ in practical terms?
- 4 Discuss why metrology is an essential ingredient in modern manufacturing industry.
- 5 Three different methods of inspection can be used in a factory for checking whether or not a part is within its specified tolerance. State these and provide a description of each.
- 6 Discuss what you understand by the terms accuracy, uncertainty, traceability and calibration with respect to metrology.
- 7 During inspection a part can be examined by using attributes or variables. Describe what you understand by each of these terms.
- 8 There are two different types of length standards, the type depending on the manner in which the measurement is established. State these and discuss the difference between them.
- 9 Describe why and how gauge blocks are used in industry. Include a description of them and the manner in which they can be utilised in order to determine the size of a component.
- 10 Name five instruments or tools you might find in a metrology laboratory or inspection room in a mass production factory and describe their use.
- 11 State three effects the surface finish can have on a machined component.
- 12 There are three significant features that influence the surface texture of a component. Describe each of these, comment on their significance and how they are created. You should use a sketch to illustrate your answer.
- 13 What is the significance of the ‘sampling length’ when measuring surface texture? You may use a sketch to illustrate your answer.
- 14 Briefly discuss what you understand by the term SQC.
- 15 Describe the operation of a control chart for a machining process.