
In this recipe, you'll learn how to configure Nagios Core to accept passive checks for a service. This allows both users and external applications to directly submit the results of checks to Nagios Core, rather than have the application seek them out itself through polling with active checks, which are performed via plugins such as check_http or check_ping.
We'll show you one simple example of a passive check: flagging a service called BACKUP for an existing host. We'll show you how to do this via a web interface, which is very easy, and via the external commands file, which is slightly more complex but much more flexible and open to automation.
The idea is that when a user or process receives confirmation that the backup process on a host has completed correctly, the user or process is able to supply a check result of OK directly to the service without Nagios Core needing to poll anything by itself.
You should be running a Nagios Core 4.0 or newer server. You should also already have a host configured for which you want to define a service that will accept passive checks. In this example, we'll use the ithaca.example.net host, which can be defined as follows:
define host {
    use        linux-server
    host_name  ithaca.example.net
    alias      ithaca
    address    192.0.2.21
}
You will also need a working Nagios Core web interface to check whether passive checks are enabled and to try out the recipe's method of submitting passive checks.
This recipe will be presented in two parts: in the first part we will enable and configure the service for passive checks only and then we'll actually submit a passive check via the web interface. In the There's more section, we'll show you how to submit a check result via the external commands file, which is a little more complicated but allows advanced automation behavior.
We can define a new BACKUP service that accepts only passive checks as follows:
- Log in to the web interface and ensure that the passive checks are enabled. The Tactical Overview section shows a panel for it near the bottom of the screen. Verify that it's green.

If it's not green, you should be able to enable the checks again by clicking on the cross mark, where the tick should be. In this case, you should also check the
/usr/local/nagios/etc/nagios.cfgfile to make sure that theaccept_passive_service_checksoption is set to1so that Nagios Core allows passive checks on startup. - Change to the Nagios Core object's configuration directory. If you're using a sample configuration, this directory will likely be
/usr/local/nagios/etc/objects:# cd /usr/local/nagios/etc/objects - Edit the
commands.cfgfile and add a definition for thecheck_dummycommand:define command { command_name check_dummy command_line $USER1$/check_dummy $ARG1$ $ARG2$ }If you already followed the Monitoring individual nodes in a cluster recipe in Chapter 8, Managing Network Layout, you may already have defined this command, in which case, you can skip this step, as the definition is the same.
- Edit the file containing the definition for the existing host. In this example, the host is defined in a file called
ithaca.example.net.cfg:# vi ithaca.example.net.cfg - Add the following service definition to the end of the file, substituting the appropriate value for
host_name:define service { use generic-service host_name ithaca.example.net service_description BACKUP active_checks_enabled 0 passive_checks_enabled 1 check_command check_dummy!1!"Unwanted active check!" }This example uses the
generic-servicetemplate. You can use any service template you like; the important directives areactive_checks_enabled,passive_checks_enabled, andcheck_command. - Validate the configuration and restart the Nagios Core server:
# /usr/local/nagios/bin/nagios -v /usr/local/nagios/etc/nagios.cfg
# /etc/init.d/nagios restart
With this done, the Nagios Core web interface should show that the service is accepting passive checks only in the Services listing, as shown in the following screenshot:

The service will remain in the PENDING state until a passive check result is submitted for it.
We can submit a passive check result via the web interface as follows:
- Click on the service's name in the Services listing and click on Submit passive check result for this service menu item:

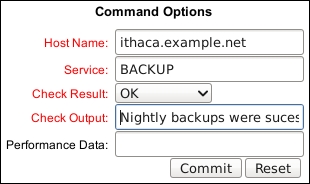
- Complete the resulting form with the following values:
- Host Name: This is the hostname for which the passive check result should be submitted. This should already be filled out for us.
- Service: This refers to the service description for which the passive check result should be submitted. This should also already be filled out with
BACKUP. - Check Result: This refers to the particular result you would like to submit for the check. In this case, we've chosen
OKto signal that the backup has completed successfully. We could just as easily submit aCRITICALresult if we wished. - Check Output: This is a message that is to be attached to the status. In this case, we choose a simple message: Nightly backups were successful.
- Performance Data: This refers to the optional extra details about how the service being checked performs. We can leave this blank.
- Click on Commit to submit the passive check result.
After a short delay, the details for the service should show the result of the passive check as reflecting the result of the passive check. Along with this, it will explicitly show that active checks are disabled.

The preceding configuration adds a new service called BACKUP to the existing ithaca.example.net host and is designed to manage and report the status of backups for this host. In our example, this isn't something Nagios Core can check manually; no network service on ithaca.example.net can be checked to verify that the backups have succeeded.
However, suppose as administrators we do receive a backup report in our inbox every morning. We come to know whether the backups have succeeded or failed and would like to register that status in Nagios Core, perhaps for record-keeping purposes or to alert other administrators to problems.
To that end, we disable active checks for the service and put in place a dummy check command, check_dummy that we never expect to run. If, for whatever reason, an active check is run, it will always flag a WARNING state with the "Unwanted active check!" message. The check_dummy command never actually checks anything; it is configured always to return the state and output defined in its two arguments.
Instead, we enable passive checks for the service and submit the results manually. If the backups fail, we could just as easily record the same with a passive check result of WARNING or CRITICAL.
It's also possible (and often desirable) to submit active checks via the external commands file, which is useful for automation purposes. We write details for the check in a single line into the commands file in the following format:
[<timestamp>] PROCESS_SERVICE_CHECK_RESULT;<host_name>;<service_description>;<service_status>;<plugin_output>
For our example, the line would be something like this:
[1348806599] PROCESS_SERVICE_CHECK_RESULT;ithaca.example.net;BACKUP;0;Nightly backups were successful
We can write this directly to the external commands file as follows:
# check="[$(date +%s)] PROCESS_SERVICE_CHECK_RESULT;ithaca.example.net;BACKUP;0;Nightly backups were successful"
# printf '%s
' "$check" >>/usr/local/nagios/var/rw/nagios.cmd
In this context, the <service_status> field needs to be an integer corresponding to the appropriate state. If you use the text value OK or WARNING, the command will not work as expected. The values to use for this field are:
0forOK1forWARNING2forCRITICAL3forUNKNOWN
If the syntax is correct, then the passive check will be registered in just the same way as if it were submitted via a web interface. Writing to the command file thus allows us to submit passive check results with scripts and automated systems, with a little knowledge of an appropriate scripting language such as Bash or Perl.
We will go into a little more detail about using external commands for passive check results, including a common application with the NSCA add-on in the Submitting passive checks from a remote host with NSCA recipe in this chapter. If you don't want to submit your passive checks manually, then you will most likely find this recipe interesting along with its accompanying explanation of freshness checks.