
In this recipe, we'll build on having configured a simple network hierarchy as described in the Creating a network host hierarchy recipe in this chapter by examining this hierarchy in the network map (or status map) in the Nagios Core web interface. The network map takes the form of a generated graphic showing the hierarchy of hosts and their current states. It allows filtering to show specific hosts and clicking hosts to navigate through larger networks.
You will need to run Nagios Core 4.0 or a newer server and have access to its web interface. You will also need permission to view the states of hosts, preferably all hosts. You can arrange this by adding your username in the authorized_for_all_hosts directive, normally in /usr/local/nagios/etc/cgi.cfg; for example, for the user tom, you can execute the following:
authorized_for_all_hosts=nagiosadmin,tom
By default, the nagiosadmin user should have all the necessary permissions to view the complete map.
The network map is not particularly useful without at least a few hosts configured and arranged in a hierarchy; so, if you have not set any parents directives for your hosts, you may wish to read the Creating a network host hierarchy recipe in this chapter first and arranging your monitored hosts as it explains.
We can inspect the network map for our newly configured host hierarchy like so:
- First, log in to the Nagios Core web interface.
- Click on the Map item in the left-hand side menu.

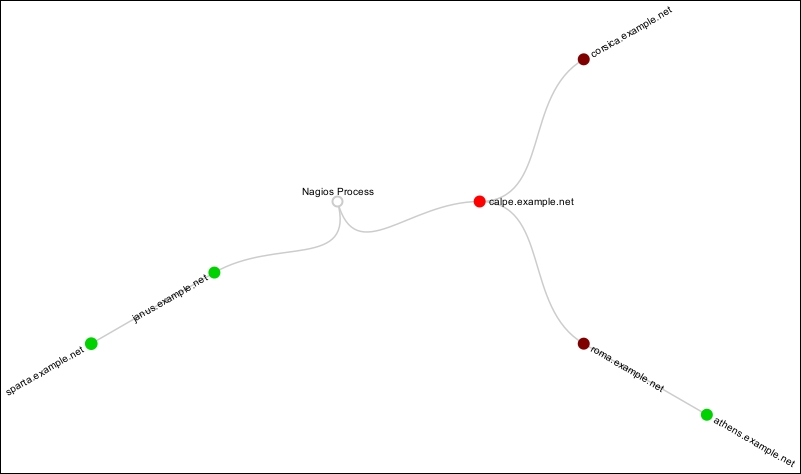
- You should be presented with a generated graphic showing all the hosts in your network that your user has permission to view similar to the following:
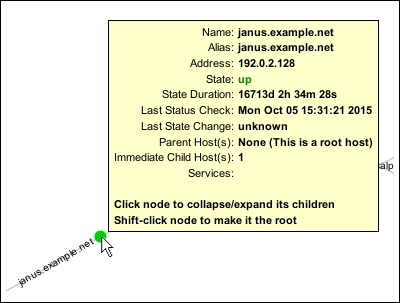
- Let the mouse hover over any host to see a panel breaking down the host's current state, as follows:
- By default, the network map is centered around the Nagios Process icon. Try holding down Shift and clicking on one of your hosts to recenter the map—in this example, on
calpe.example.net, as follows: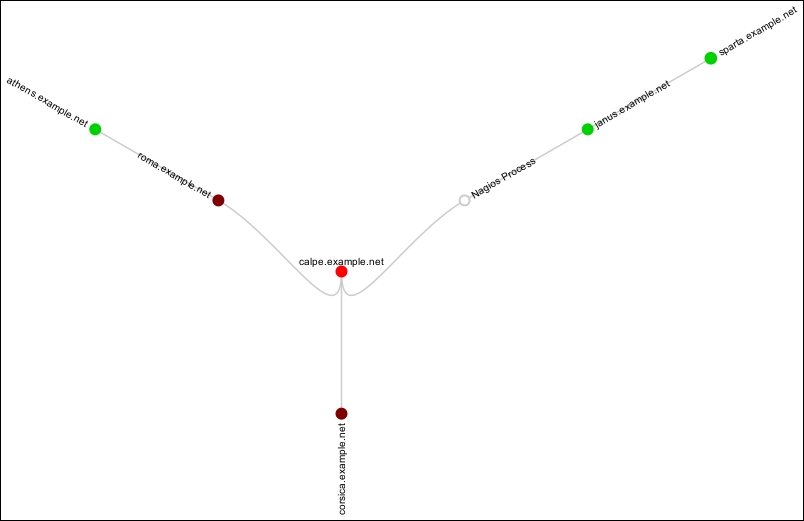
The network map is automatically generated from your host configuration. By default, it arranges the hosts outward from the central Nagios Process icon using lines to show dependencies and adjusting their colors to green for UP states and red for DOWN or UNREACHABLE states.
This map is generated via AngularJS, a JavaScript library. Legacy Map from older versions of Nagios Core, available with the (Legacy) link in the left-hand side menu, is generated with the GD2 library and written by Thomas Boutell.
Note that the form available by clicking on the icon in the upper right-hand side allows you to customize the appearance of the map directly. Take a look at the following screenshot:

Of particular interest in this screen is the Layout drop-down menu, which can be adjusted to try several different methods of displaying the network layout.
After selecting or changing any one of these options, you will need to click on Apply to make the changes appear on the map.
The appearance of the status map can be configured well beyond this by changing directives in the Nagios Core configuration file and adding some directives to your hosts; take a look at the recipes under See also for some examples of how this is done.