
In this recipe, you'll learn how to implement a simple kind of redundancy for Nagios Core by running a second Nagios Core instance with a near-identical configuration on another machine.
This may seem like it would not need a recipe to implement. It should be reasonably straightforward to simply copy over the configuration for a Nagios Core system and run it concurrently. There are two main problems with this:
- Every problem detected on the network will fire notification events twice. The administrator charged with looking after the pager might well find this unbearable!
- Everything will be checked twice. On smaller networks with simple checks, this may not be too much of a concern, but it could be an issue on larger, busier networks.
This recipe will solve the first problem by configuring the slave monitoring server to suppress notifications until it detects an issue with the master server. In the There's More section, we'll discuss extending this solution to solve the second problem as well by preventing the slave server from making checks or sending notifications while the master server is active.
This is the most complex recipe in this book and one of the longest recipes as it uses a lot of concepts from many other recipes and chapters. To follow it, you will likely need to have a good working knowledge of the following:
- The building blocks of Nagios Core—hosts, services, contacts, commands, plugins, and notifications—are explained in all the recipes from chapters 1 through 4.
- The remote execution via
check_nrpeis explained in all the recipes in Chapter 6, Enabling Remote Execution. The recipe at one point will tell you to install NRPE on the master server to run a specific plugin, so you should learn how to do this first. - Event handlers and writing to the command file with them is explained in the Setting up an event handler script recipe in Chapter 11, Automating and Extending Nagios Core.
The event handler scripts, the most complex part of this setup, are fortunately already written for us; we'll show you how to implement them by copying them out of the Nagios Core source package. You'll, therefore, need to have the sources available for your particular version of Nagios Core. If you need to retrieve the sources again, you can download them again from Nagios Core's website, http://www.nagios.org/.
The recipe will start by assuming that we have two monitoring servers: olympus.example.net (192.0.2.11), which will be the master monitoring server, and everest.example.net (192.0.2.12), which will be the slave. The two servers are configured to monitor the same three hosts, with PING service checks:
sparta.example.netathens.example.netithaca.example.net
The Nagios Core configuration of the two servers is completely identical to start with and both send notifications to an appropriate contact group.
We can arrange a simple redundancy setup for our two Nagios Core servers as follows:
- Confirm that the
check_nagiosplugin is available on the master server and try running it:# cd /usr/local/nagios/libexec # ./check_nagios -e 5 -F /usr/local/nagios/var/status.dat -C /usr/local/nagios/bin/nagios NAGIOS OK: 6 processes, status log updated 3 seconds ago
- Install the NRPE daemon on the master server and define the
check_nagioscommand innrpe.cfg(refer to Chapter 6, Enabling Remote Execution):command[check_nagios]=/usr/local/nagios/libexec/check_nagios -e 5 -F /usr/local/nagios/var/status.dat -C /usr/local/nagios/bin/nagios - Include the slave server's address in the
allowed_hostsdirective fornrpein the/usr/local/nagios/etc/nrpe.cfgfile:allowed_hosts=127.0.0.1,192.0.2.12
Don't forget to restart NRPE to include this change to the configuration.
- On the slave server, verify that a call to
check_nrpecan retrieve the results ofcheck_nagioson the master server:# cd /usr/local/nagios/libexec # ./check_nrpe -H olympus.example.net NRPE v2.15 # ./check_nrpe -H olympus.example.net -c check_nagios NAGIOS OK: 1 process, status log updated 2 seconds ago
You will have to install the
check_nrpeplugin on the slave server to do this. This is explained in the Monitoring local services on a remote machine with NRPE recipe in Chapter 6, Enabling Remote Execution. - On the slave server, copy 4 files (2 event handlers and 2 helper scripts) from the source distribution into the
/usr/local/nagios/libexec/eventhandlersdirectory (which you may need to create first):# ehd=/usr/local/nagios/libexec/eventhandlers # mkdir -p "$ehd" # cd /usr/local/src/nagios # cp contrib/eventhandlers/enable_notifications "$ehd" # cp contrib/eventhandlers/disable_notifications "$ehd" # cp contrib/eventhandlers/redundancy-scenario1/handle-master-host-event "$ehd" # cp contrib/eventhandlers/redundancy-scenario1/handle-master-proc-event "$ehd"
The preceding step assumes that you are keeping the sources for your Nagios Core distribution in
/usr/local/src. We define and use the shell variableehdto refer to the event handlers directory for convenience. - In the installed
handle-master-proc-eventscript, find and replaceactive_service_checkswithnotifications. The command-line tooled(1)works well for this:# printf '%s ' ,s/active_service_checks/notifications/g w | ed -s -- "$ehd"/handle-master-proc-eventThis is because the script, as provided, issues a command to toggle active checks, rather than notifications. At the time of writing, in Nagios 4.1.1, there is also a bug in
handle-master-proc-event, which will need to be corrected, on line 49:`eventhandlerdir/disable_active_service_checks`It should have a dollar sign added after the first backtick:
`$eventhandlerdir/disable_active_service_checks` - Ensure that the event handlers are owned and executable by the
nagiosuser:# chown nagios.nagios "$ehd"/* # chmod 0755 "$ehd"/*
- In
/usr/local/nagios/etc/objects/commands.cfg, define two new event handler commands:define command { command_name handle-master-host-event command_line $USER1$/eventhandlers/handle-master-host-event $HOSTSTATE$ $HOSTSTATETYPE$ $HOSTATTEMPT$ } define command { command_name handle-master-proc-event command_line $USER1$/eventhandlers/handle-master-proc-event $SERVICESTATE$ $SERVICESTATETYPE$ $SERVICEATTEMPT$ } - Make a host and service definition on the slave server to monitor the master server. It might look something like this; change your
host_name,alias, andaddressvalues as appropriate. The templates used are only examples; you will probably want to choose templates that are defined to run checks often and during a24x7interval:define host { use critical-host-template host_name olympus.example.net alias olympus address 192.0.2.11 event_handler handle-master-host-event } define service { use critical-service-template host_name olympus.example.net service_description NAGIOS check_command check_nrpe!check_nagios event_handler handle-master-proc-event }You can make the master server monitor the slave server as well if you wish, but it is not necessary for this redundancy setup.
- Note that you will need to have the
check_nrpecommand defined, which is explained in the Monitoring local services on a remote machine with NRPE recipe in Chapter 6, Enabling Remote Execution. If you have followed that recipe, then you have probably already done this. If not, the following definition works:define command { command_name check_nrpe command_line $USER1$/check_nrpe -H $HOSTADDRESS$ -c $ARG1$ } - Finally, in
nagios.cfg,on the slave server, changeenable_notificationsto0:enable_notifications=0
- Validate the configuration and restart the Nagios Core server:
# /usr/local/nagios/bin/nagios -v /usr/local/nagios/etc/nagios.cfg
# /etc/init.d/nagios restart
With this done, the two Nagios Core servers should both be running, but, importantly, notifications on the slave server start out as disabled, as visible in the Tactical Overview.

However, all the systems are still being monitored, as visible in the following Services screen, including the NAGIOS service on the host machine:
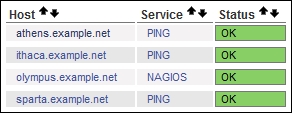
This means that notifications will only be sent by the master server, since it still has its notifications enabled. However, if the master server goes down or its Nagios process stops working, the event handlers should be called and notifications on the slave server will be automatically enabled. When the master server or its NAGIOS service comes back up, the notifications will be disabled again, with checks and state changes having continued uninterrupted throughout. We have therefore established a simple kind of redundancy. If you use this setup, you should test it thoroughly to make sure that the slave Nagios Core server will enable and disable its notifications for each contingency (host goes down, service goes down, service comes back, and so on.)
The event handlers included in the Nagios Core distribution, which we copied into the eventhandlers directory, are designed to handle toggling notifications and active checks based on the status of a given service or host. They are included for the purposes of demonstrating event handlers and redundancy situations like this one.
We start by setting up the slave server to monitor not just the host on which the master Nagios Core server is running, but also the Nagios Core service itself, using the check_nagios plugin. This plugin checks the age of the log file and the system's process tables to ensure that a Nagios Core service is actually running on the system. Because it's a local plugin that doesn't work for remote checks, we check it from the slave server via NRPE.
The slave server checks the status of the master server and its NAGIOS service as part of its normal routine of active checks. When the master server's host or its NAGIOS service change state, both call their respective event handlers, the two shell scripts handle-master-host-event and handle-master-proc-event that are defined in the commands of the same name.
Each time the event handlers are called, they are passed three arguments in a macro form. For handle-master-host-event, these are:
$HOSTSTATE$: This argument is the new state of the master server$HOSTSTATETYPE$: This argument shows whether the state isSOFTorHARD$HOSTATTEMPT$: This argument shows the number of host checks attempted up to the value ofmax_check_attemptsfor the host
The handle-master-proc-event is passed three analogous arguments, the only difference being they refer to service states rather than host states:
$SERVICESTATE$: This argument is the new state of theNAGIOSservice on the master server$SERVICESTATETYPE$: This argument shows whether the service state isSOFTorHARD$SERVICEATTEMPT$: This argument shows the number of host checks attempted, up to the value ofmax_check_attemptsfor the host
The event handlers are written in such a way that they only do anything if the new state is HARD, that is, if the number of max_check_attempts has been reached. It ignores SOFT state changes until enough consecutive checks have failed that it can be reasonably confident in concluding that the monitored host or service is suffering a problem.
If the host or service enters a HARD CRITICAL state, the event handlers call the helper script enable-notifications to write a command to the commands file at /usr/local/nagios/var/rw/nagios.cmd for the server to process. This command takes the following form, including the Unix timestamp for when the command was written:
[1446457199] ENABLE_NOTIFICATIONS;1446457199
When Nagios Core processes this command, the effect is that the previously disabled notifications are enabled and all subsequent notifications generated as a result of checks will be sent.
Similarly, when the host or service recovers from the HARD CRITICAL state, by entering a HARD UP or HARD OK state, the disable-notifications helper script is called, writing a command in the same manner:
[1446457218] DISABLE_NOTIFICATIONS;1446457218
The effect is that when the master server is noted to be down, the slave server notices and assumes its notification behavior and, when it recovers, it stops its own notifications again, allowing the master server to resume its role.
If network bandwidth or other resources are a concern, we can arrange to leave the slave server more or less idle when not in use. We can do this by keeping not only notifications, but also service checks, off by default. Helper scripts for this are also included in the Nagios Core distribution in the disable_active_service_checks and enable_active_service_checks scripts.
The primary issue with this change is the loss of state information, as the slave server makes its initial round of checks; this can also be worked around, as explained in the Nagios Core documentation on redundancy:
https://assets.nagios.com/downloads/nagioscore/docs/nagioscore/4/en/redundancy.html
Once these steps are implemented, the main issue is to keep the two configuration directories in sync. It's undesirable and error prone to have to make changes on two servers each time the configuration needs to change, so you may like to consider using a snapshot tool such as rsync to keep the two directories the same:
http://en.wikipedia.org/wiki/Rsync
Even better is a configuration managed with version control, which can also help here, as recommended in the Keeping configuration under version control recipe in Chapter 9, Managing Configuration. This way you can use git clone or svn checkout to quickly update configuration files on multiple machines.
- Monitoring local services on a remote machine with NRPE, Chapter 6, Enabling Remote Execution
- Keeping configuration under version control, Chapter 9, Managing Configuration
- The Writing debugging information to Nagios log file recipe in this chapter
- Setting up an event handler script, Chapter 11, Automating and Extending Nagios Core