
In this recipe, you'll learn how to manually schedule checks of hosts and services from the web interface, overriding the automatic scheduling normally done by Nagios Core. This can be convenient to hurry along checks for hosts or services that have just been added, or which have just had problems, or to force a check to be made even when active checks are otherwise disabled on a host for whatever reason.
In this example, we'll schedule a check for a service, but checks for hosts can be established in just the same way.
You will need access to the Nagios Core web interface and permission to run commands from the CGIs. The sample configuration installed by following the Quick Start Guide provides the nagiosadmin user all the necessary privileges when authenticated via HTTP.
If you find that you don't have this privilege, check the authorized_for_all_service_commands and authorized_for_all_host_commands directives in /usr/local/nagios/etc/cgi.cfg and include your username in both, for example, tom:
authorized_for_all_service_commands=nagiosadmin,tom
authorized_for_all_host_commands=nagiosadmin,tom
We can schedule a check for an existing service by following these steps:
- Log in to the Nagios Core web interface, and find the link to the host or service for which you want to schedule a check. In this example, we're forcing a check of the
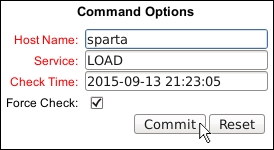
LOADservice on thesparta.example.nethost:
- Click on the Re-schedule the next check of this service (or host) in the right-hand side menu:

- Complete the resulting form. Include the following details:
- Host Name: This is the hostname for the host or service that has the problem. This should be filled in automatically.
- Service: This refers to the service description for the service having problems, if applicable. This will also be filled in automatically.
- Check Time: This is the time at which Nagios Core should reschedule the check.
- Force Check: Whether to force a check, regardless of active checks being disabled for this host or service.
Note that explanatory notes also appear on the right-hand side of the command description. Click on Commit when you're done:
With this done, after Nagios Core processes the new command, the service should now show the new time for its next scheduled check. The check will be run at the nominated time, and its return values will be processed normally.
Scheduling checks in this manner is a means of jumping the queue for a particular host or service, generally an automated process that Nagios Core figures out based on host and service directives such as check_interval and retry_interval.
Like all external commands issued from the web interface, a command is written to the commands file, usually at /usr/local/nagios/var/rw/nagios.cmd, by the system for processing.
We can inspect the enqueued checks by clicking on the Scheduling Queue link under the System section of the sidebar:

This will bring up a list of the pending checks and the time at which they'll take place:

We can also get more detailed information about the queuing process and performance using the -s flag with the nagios command:
# /usr/local/nagios/bin/nagios -s /usr/local/nagios/etc/nagios.cfg
This will print a lot of information to the terminal, too much to reproduce completely here! It is probably helpful to pipe it through a paging tool such as less to read it:
# /usr/local/nagios/bin/nagios -s /usr/local/nagios/etc/nagios.cfg | less
Nagios Core 4.1.1
Copyright (c) 2009-present Nagios Core Development Team and Community Contributors
Copyright (c) 1999-2009 Ethan Galstad
Last Modified: 08-19-2015
License: GPL

Website: https://www.nagios.org
Timing information on object configuration processing is listed
below. You can use this information to see if precaching your
object configuration would be useful.

Object Config Source: Config files (uncached)

OBJECT CONFIG PROCESSING TIMES      (* = Potential for precache savings with -u option)
----------------------------------
Read:                 0.109772 sec
Resolve:              0.001497 sec  *
Recomb Contactgroups: 0.000629 sec  *
Recomb Hostgroups:    0.046730 sec  *
Dup Services:         0.006301 sec  *
...
- The Viewing and interpreting notification history recipe in this chapter
- Checking Nagios performance with Nagiostats, Chapter 11, Automating and Extending Nagios Core
- Allowing passive checks, Chapter 11, Automating and Extending Nagios Core
- Running passive checks from a remote host with NSCA, Chapter 11, Automating and Extending Nagios Core