
In this recipe, we'll see how to get both complete listings and convenient summaries of the alerts and notifications being generated by Nagios Core in response to hosts and services changing state. These options are all available under the Reports section of the sidebar:

It's important to distinguish between alerts and notifications in this section. An alert is generated in response to an event such as a host or service changing state. A notification, in turn, may or may not be generated as a response to that alert and can be sent to the appropriate contacts. The SOFT state changes constitute alerts; only HARD state changes generally generate notifications.
It's likely that a production monitoring server will not send notifications for every alert, particularly if you're making good use of the max_check_attempts, scheduled downtime, and problem acknowledgement features. So, you should make sure you're checking the correct section.
You will need access to the Nagios Core web interface and permission to run commands from the CGIs. The sample configuration installed by following the Quick Start Guide provides the nagiosadmin user all the necessary privileges when authenticated via HTTP.
We can get an overview of the notifications, alerts, and other events being generated on the Nagios Core server as follows:
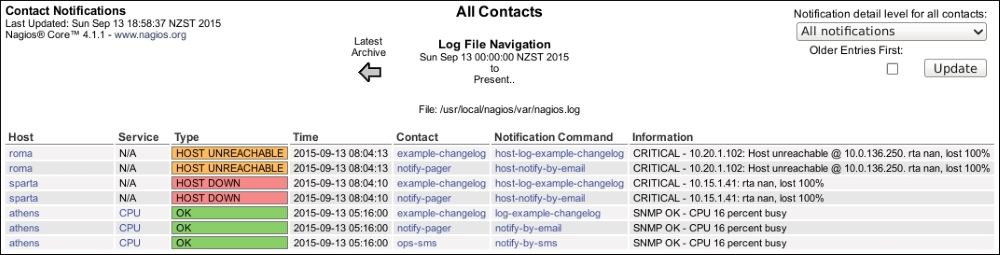
- Start with the Notifications report. The resulting screen should show you the day's notifications as read from the current log file:
- Note that if you're using the log rotation feature of Nagios Core, configured with the
log_rotation_methoddirective, you can use the arrows above the table to navigate to the previous period's monitoring (generally, 24 hours' worth). Additionally, note that the information includes the following:- Links to the hosts and services that generate them
- The contacts to which they were sent
- The notification commands that were run
- The output of the commands that prompted the alert and notification
Also note that you're able to filter for any particular kind of notification and change the sorting order using the form in the top-right corner:
- Next, navigate to the Alerts section or the Alerts | History report. Rather than a tabular format, this shows you all the alerts generated by hosts and services as a list, showing red exclamation icons for
CRITICALorDOWNstates, green icons forOKstates, and others. The list is broken down by hour: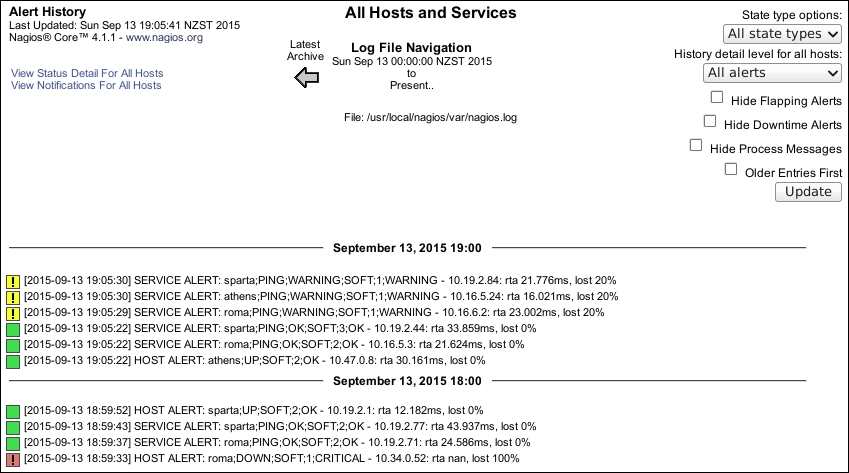
Note that you're again able to filter for specific alert types with the form in the top-right corner.
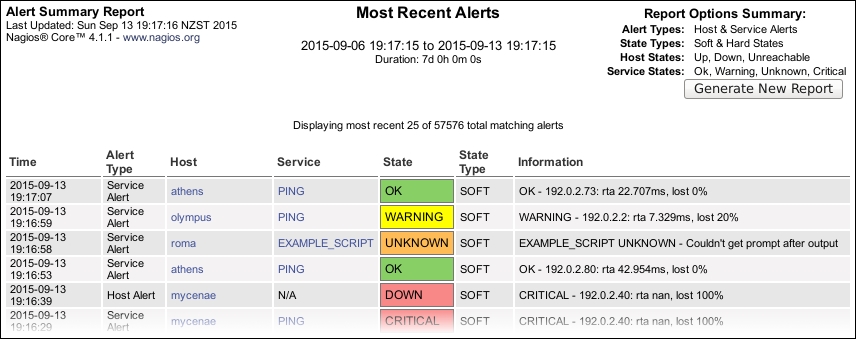
- The other two items in the Alerts menu allow us to generate complex reports with many criteria. The first, Summary, presents its results in a tabular format according to the criteria entered in a form. For now, try clicking on the Create Summary Report at the bottom of the first page, with all the fields on their defaults, to get a feel of the results it generates:
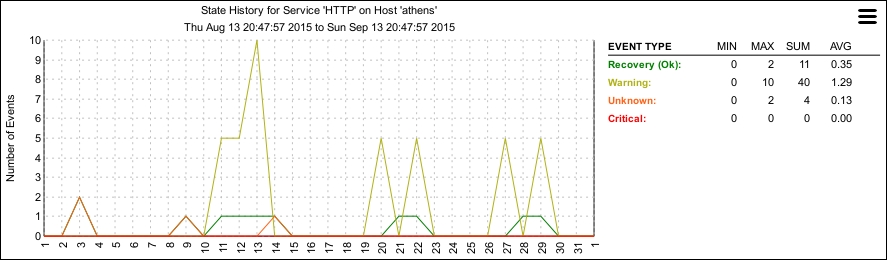
The Histogram report also generates a graph similar to the following one, showing a breakdown of the alerts generated for nominated hosts or services over a fixed period of time:
Nagios Core saves the data for both alerts and notifications on a long-term basis, allowing reports like this to be generated dynamically from its archives. Note that the data presented in these reports is for alerts and notifications, not the actual states of the services over time. To get useful statistics such as the percentage of uptime, you'll want to generate an Availability report, which is discussed in the Viewing and interpreting availability reports recipe in this chapter.
The same notifications data can also be translated into a MySQL database format via the NDOUtils extension so that reading the alerts and notifications data programmatically to generate custom reports is possible. Refer to the Reading status into a MySQL database with NDOUtils recipe in Chapter 11, Automating and Extending Nagios Core for more information on how to do this.
The remaining item in the menu is the Event Log item, which presents a more comprehensive summary of Nagios Core's overall activity without filtering only for alerts or notifications. This screen can include information such as the application of external commands. It tends to be quite verbose, but it's a useful way to read the nagios.log file from the web interface. Your username will need to be included in the authorized_for_system_information directive in /usr/local/nagios/etc/cgi.cfg to use this:
authorized_for_system_information=nagiosadmin,tom
- The Viewing and interpreting availability reports recipe in this chapter
- The Viewing and interpreting trends recipe in this chapter
- Reading status into a MySQL database with NDOUtils, Chapter 11, Automating and Extending Nagios Core