
In this recipe, you'll learn how to use the Availability Report to build a table showing statistics for a host, hostgroup, service, or servicegroup. This is useful as a quick metric of overall availability, perhaps to meet the terms of a service-level agreement.
You will need access to the Nagios Core web interface and permission to run commands from the CGIs. The sample configuration installed by following the Quick Start Guide gives the nagiosadmin user all the necessary privileges when authenticated via HTTP.
If you find that you don't have this privilege, check the authorized_for_all_services and authorized_for_all_hosts directives in /usr/local/nagios/etc/cgi.cfg and include your username in both, for example tom:
authorized_for_all_servicess=nagiosadmin,tom
authorized_for_all_hosts=nagiosadmin,tom
Alternatively, you should also be able to see a host or service's information if you are authenticating with the same username as the nominated contact for the host or service you want to check. This is explained in the Using authenticated contacts recipe in Chapter 10, Security and Performance.
In this example, we'll view a month's history for a CPU load service on roma.example.net, a Linux server.
We can arrange an Availability Report for the last month for our roma.example.net server like so:
- Log in to the Nagios Core web interface.
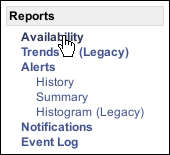
- Click on the Availability link in the left-hand side menu, beneath Reports:
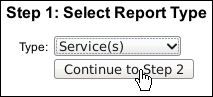
- Select the type of report, either Host, Hostgroup, Service, or Servicegroup:
- Select a specific host or service on which to report or alternatively choose to run it for all hosts, hostgroups, services, or servicegroups:

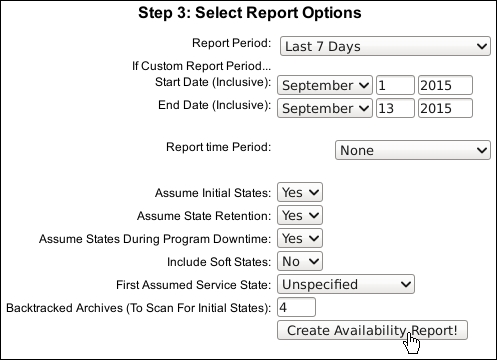
- Define some options for the report. The defaults are sensible, so we'll use them for now; we'll go over the effect of each of the other fields in the next section. Click on Create Availability Report! when you're done:
You should be presented with a table showing the percentage of time the host or service has spent in each state. A healthy service might look like this, with a few blips or none at all:

A more problematic service might have large percentages of time in the WARNING or CRITICAL state:
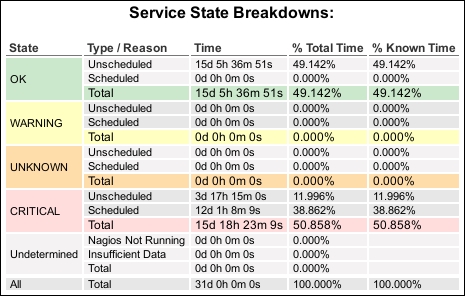
The preceding table appears and gives a quick visual summary of the time spent in each state, which if clicked, will link to a Trends Report with the same criteria. Additionally, below the table there are log entries for the service or host that is changing its state.
Nagios Core assembles state changes from its log files for the specified time period and constructs the table of state changes by percentage. The availability report, therefore, only works for the time covered by your archived log files. The third step of building the report involves a lot of possible options, which are as follows:
- Report period: This is the drop-down menu that allows us to choose a fixed period, for convenience, relative to the current date; alternatively, a custom time period may be used by selecting the final CUSTOM TIME PERIOD option and selecting dates in the two fields that follow:
- Start Date (Inclusive): This is the date on which the report should start if the custom time period option has been set.
- End Date (Inclusive): This is the date on which the report should end if the custom time period option has been set.
- Report time Period: This is the time period for which the availability should be assessed. The default is None, meaning that the service or host's state at any time will be used in the calculations. You could, for example, set this to
workhoursto see the percentage of uptime during a time that the server is expected to be busy. - Assume Initial States: If Nagios Core can't figure out the initial state of the service at the time the report begins until the first check, it will assume that it is based on the value of the First Assumed Host State or First Assumed Service State field.
- Assume State Retention: If Nagios Core was restarted one or more times during the reporting period, checking this option will make the report assume that the state before any restart was retained by Nagios Core until it started again; this is enabled with the
retain_state_informationdirective innagios.cfg. - Assume States During Program Downtime: If Nagios Core finds that it was down for a period in its log files, it will assume the final state it reads from the host or service before it went down endured for that time.
- Include Soft States: Nagios Core will graph
SOFTstates, meaning that it will include state changes that do occur but return to their previous state beforemax_check_attemptsis exhausted. Otherwise, it will only graph states that have endured right through the retry checks, orHARDstates. - First Assumed Host State or First Assumed Service State: This is the value Nagios Core should assume for the host or service state if it can't determine it from the log files.
- Backtracked Archives: This shows how many archived log files back the Nagios Core process should check to try and find initial states for the host or service.
You can choose to run the report for a hostgroup or servicegroup as well, which will yield an indexed table showing both the per-host or per-service percentage state time and also the average uptime for all the hosts or services in the group.
- The Viewing and interpreting trends recipe in this chapter
- The Viewing and interpreting notification history recipe in this chapter
- Using authenticated contacts, Chapter 10, Security and Performance