
In this recipe, you'll learn how to use the nagiostats utility to get some statistics about the performance of a Nagios Core process and the states of the hosts and services that it monitors.
Optionally, we'll also show you how to use the mrtg.cfg file built in the Nagios Core source distribution at the ./configure time to set up graphs built by mrtg (Multi-Router Traffic Grapher) and to link to the graphs in the menu of the web interface. The Nagios Core source distribution includes some ready-made files to assist with this, which we'll use here.
You will need a Nagios Core 4.0 server or newer server installed and running to invoke nagiostats. Older versions do include the utility, but there is not quite as much information that is returned.
If you would like to run the mrtg graphing as well, which is highly recommended, you should have mrtg and its helper program indexmaker installed on your system. If you are already graphing other things with mrtg, don't worry, this recipe should not interfere with that.
The recipe does not assume any familiarity with mrtg, but if you have any problems with it, you can consult its online documentation at http://oss.oetiker.ch/mrtg/doc/index.en.html.
You should also have access to the sources from which your installation of Nagios Core was compiled. If you need to retrieve the sources again, you can download them again from Nagios Core's website, https://www.nagios.org/.
In this case, you will need to run ./configure again to generate the file required, sample-config/mrtg.cfg.
We can invoke nagiostats itself in one step whenever we want to get some statistics about the server's performance, with the following command:
- Run the following command:
# /usr/local/nagios/bin/nagiostats -c /usr/local/nagios/etc/nagios.cfgThis should give you an output beginning with the following:
Nagios Stats 4.1.1
Copyright (c) 2003-2008 Ethan Galstad (www.nagios.org)
Last Modified: 08-19-2015
License: GPL

CURRENT STATUS DATA
------------------------------------------------------
Status File:                            /usr/local/nagios/var/status.dat
Status File Age:                        0d 0h 0m 8s
Status File Version:                    4.1.1

Program Running Time:                   0d 0h 4m 27s
Nagios PID:                             2023
...
- Run the following command:
# /usr/local/nagios/bin/nagiostats -c /usr/local/nagios/etc/nagios.cfg --helpThis should give you a complete list of the names and meaning of all the fields returned by the output of
nagiostats. - If you would like to include
mrtggraphs of this data, a good starting point is using the sample configuration included in the Nagios Core source distribution insample-config/mrtg.cfg. - Copy
sample-config/mrtg.cfginto/usr/local/nagios/etc:# cp nagios-4.1.1/sample-config/mrtg.cfg /usr/local/nagios/etc - Create a directory to store the
mrtgpages and graphs so that they can be viewed in the Nagios Core web interface:# mkdir /usr/local/nagios/share/stats - Edit
/usr/local/nagios/etc/mrtg.cfgto include aWorkDirdeclaration at the top of the file:WorkDir: /usr/local/nagios/share/stats - Run
mrtgto create the graphs:# mrtg /usr/local/nagios/etc/mrtg.cfgFor this first run, we can safely ignore any errors about missing prior data or backup log files:
2015-11-02 22:03:52, Rateup WARNING: /usr/bin/rateup could not read the primary log file for nagios-a
2015-11-02 22:03:52, Rateup WARNING: /usr/bin/rateup The backup log file for nagios-a was invalid as well
2015-11-02 22:03:52, Rateup WARNING: /usr/bin/rateup Can't rename nagios-a.log to nagios-a.old updating log file
2015-11-02 22:03:52, Rateup WARNING: /usr/bin/rateup could not read the primary log file for nagios-b
2015-11-02 22:03:52, Rateup WARNING: /usr/bin/rateup The backup log file for nagios-b was invalid as well
2015-11-02 22:03:52, Rateup WARNING: /usr/bin/rateup Can't rename nagios-b.log to nagios-b.old updating log file
If you are using a UTF-8 locale in your shell,
mrtgmay fail to run. You can run it in a standard C locale with anenvprefix:# env LANG=C mrtg /usr/local/nagios/etc/mrtg.cfg - Run the
indexmakerhelper installed withmrtgto create an index on the graphs:# indexmaker /usr/local/nagios/etc/mrtg.cfg --output=/usr/local/nagios/share/stats/index.htmlYou only need to do this once, unless you add or remove graph definitions from
mrtg.cfglater on. - Visit
http://olympus.example.net/nagios/statsand substitute your own Nagios Core server's hostname forolympus.example.net. After authenticating (if necessary), we should be able to see some emptymrtggraphs.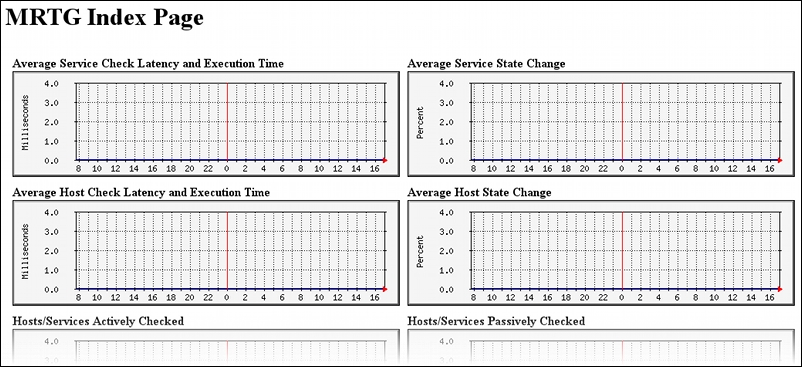
Don't worry that they're empty; we expect that, as we only have one data point for each graph at the moment.
- If everything has worked up to this point, we can probably add a
crontask to run every 5 minutes to add new data points to the graph. Here, we are assuming that themrtgprogram is saved in/usr/bin:*/5 * * * * root /usr/bin/mrtg /usr/local/nagios/etc/mrtg.cfg
The best way to do this will vary between systems. You could put this in
/etc/crontabor in its own file at/etc/cron.d/nagiostatsif you want to be a little tidier.It is probably safe to leave it running as
root, but, if you are concerned about this, you should also be able to run it as thenagiosuser by including a--lock-fileoption:*/5 * * * * nagios /usr/bin/mrtg --lock-file=/usr/local/nagios/var/mrtg.cfg.lock /usr/local/nagios/etc/mrtg.cfg
This might require us to correct permissions on the graphs that are already generated:
# chown -R nagios.nagios /usr/local/nagios/share/stats
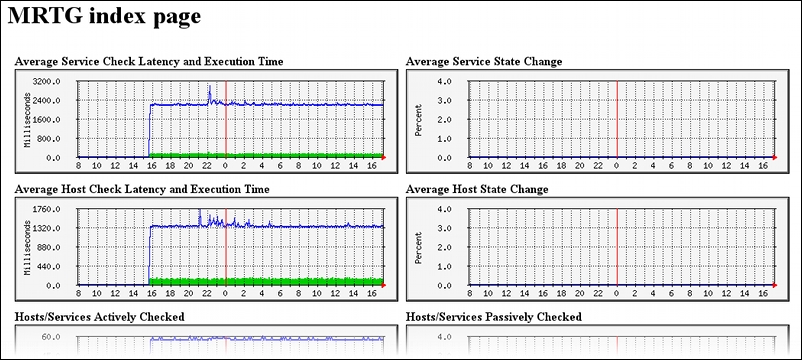
With this done, if the cron task is installed correctly, we should start seeing data being plotted over the next few hours.
The statistics provided by nagiostats provides both performance data about Nagios Core itself, such as how long it takes to complete its round of checks of all objects and the average time it takes per check, as well as data such as the number of hosts in various states. By default, running it will return the data in a terse but human-readable format; you can get a good idea of the meaning of each of the fields by running it with --help, as suggested in the recipe.
The mrtg.cfg file included in the Nagios source distribution, which is tailored to your particular system at the ./configure time, contains example definitions of mrtg graphs that parse the data retrieved from nagiostats. These are not the only possible graphs using the information provided by nagiostats, but they are useful examples.
The data used is the same as the data you read if you've invoked nagiostats from the shell, but the format is slightly different. If you want to see the data being passed to mrtg by nagiostats, you can run it with the --mrtg option and nominate fields to be included in the output with --data, for example:
# /usr/local/nagios/bin/nagiostats -c /usr/local/nagios/etc/nagios.cfg --mrtg --data=AVGACTSVCPSC,AVGPSVSVCPSC,PROGRUNTIME,NAGIOSVERPID
4
0
0d 0h 5m 29s
Nagios 4.1.1 (pid=22548)
The recipe's call to indexmaker is a separate program that builds an index.html file with links to all the graphs, just for convenience. Like the mrtg call, it refers to the /usr/local/nagios/etc/mrtg.cfg configuration file to figure out what it needs to do.
Once you're happy with the way your graph's web pages are being displayed, you might like to consider including them in your Nagios Core sidebar. This can be done by editing /usr/local/nagios/share/side.php and adding a new link to the System section, perhaps named Performance Reports, below the Performance Info link. The new line might look something like this:
<li><a href="/nagios/stats/" target="<?php echo $link_target;?>">Performance Reports</a></li>
This would make a link to the graphs show up in the web interface as follows:

If you like what mrtg does with this data, you might like to look at Cacti, which is a very helpful frontend to rrdtool, which is similar to mrtg. It will allow you a lot of flexibility to define graphs, although it takes a while to learn. You can find more information about it at http://www.cacti.net/.
Another idea if you're interested in more graphing for Nagios Core performance and state data is the NagiosGraph extension, which is discussed in the Tracking host and service states with NagiosGraph recipe in Chapter 11, Automating and Extending Nagios Core.
Tip
Finally, note that Nagios Core includes some built-in graphing of hosts and states in its reports, so be sure to check those out as well before you try to build a graph for a report that already exists! These are all also discussed in Chapter 7, Using the Web Interface; check out the references in the See also section for this recipe.
- Using the tactical overview, Chapter 7, Using the Web Interface
- Viewing and interpreting availability reports, Chapter 7, Using the Web Interface
- Viewing and interpreting trends, Chapter 7, Using the Web Interface
- Viewing and interpreting notification history, Chapter 7, Using the Web Interface
- Tracking host and service states with Nagiosgraph, Chapter 11, Automating and Extending Nagios Core