
On very large networks, or networks with a lot of remote checking required, manually configuring NRPE services for everything that requires checking on each host can be burdensome. It's common to automate installing the plugins that are needed on the monitored host and the configuration required to use them, to make the network administrator's job a little easier when adding a set of new hosts with a standard set of services to monitor. Common tools to automate such setups include configuration management tools like Chef, Puppet, or Bcfg2.
Developing standard procedures like this may not appeal and busy administrators may be looking for an extension to Nagios that automatically discovers relevant services on a host to monitor, so that almost no manual configuration is required, instead generating the relevant stanzas automatically. This is one of the main functions of Check_MK, a Nagios Core extension written by Matthias Ketchner and available at https://mathias-kettner.de/check_mk.html.
Check_MK is a very large Nagios Core extension with a great deal of functionality that makes it a large portion of a monitoring system in its own right, going so far as to have its own web GUI. Covering it in its entirety is beyond the scope of this book, but its particular function in automating and generating checks for remote hosts is relevant here.
In this example, we'll set up the check_mk program on a server running Nagios Core 4.0 or better, olympus.example.net, and install the check_mk_agent on a second server, roma.example.net, so that checks can be made of the latter remotely, with automatically generated configuration.
There shouldn't already be a host named roma in the Nagios Core configuration; this would cause configuration errors. The host should be pingable by its hostname and its firewall, if any, should be configured to allow TCP port 6556 from the monitoring server.
The target server should also have xinetd(8) installed and running; the package is named xinetd in both Debian and Red Hat derived operating systems.
You will need to have root privileges on both the monitoring server and the target server. The check_mk program installs a great deal of software and modifies some system configuration, so it's not trivial to remove it and you may like to test this on a development network first.
The check_mk program is part of a large suite of monitoring tools that are downloaded together; you'll need to be able to download around 100 MB of data to the monitoring server.
We can set up check_mk on the monitoring server as follows:
- Download the most recent version of the
check_mksuite's source; at the time of writing, the link is available at http://mathias-kettner.com/check_mk_download_version.php. It is a large file (100 MB).$ wget https://mathias-kettner.de/support/1.2.6p9/check-mk-raw-1.2.6p9.cre.tar.gz - Unpack the downloaded tarball and move into the
packages/check_mkdirectory within it:$ tar -xzf check-mk-raw-1.2.6p9.cre.tar.gz $ cd check-mk-raw-1.2.6p9/packages/check_mk
- Unpack the
check_mktarball in that directory and change into it:$ tar -xzf check_mk-1.2.6p9 $ cd check_mk
- Run the
setup.shscript within the directory as therootuser:# ./setup.shThe
check_mkinstallation script interface should appear:
- Answer the questions the setup program asks. In most cases, the default it suggests should be appropriate, as it attempts to read the configuration of your system and find running instances of Nagios Core.
- Copy three files from the new directory
/usr/share/check_mk/agentsto the target host, perhaps by usingscp(1):$ cd /usr/share/check_mk_agents $ scp check_mk_agent.linux waitmax xinetd.conf roma:
- On the target server, install the files copied from the monitoring server; note the different names given to
check_mk_agent.linuxandxinetd.conf:# cp check_mk_agent.linux /usr/bin/check_mk_agent # cp waitmax /usr/bin/waitmax # cp xinetd.conf /etc/xinetd.d/check_mk
- Restart the
xinetd(8)server on the target machine:# /etc/init.d/xinetd restart - Back on the monitoring server, edit the file
/etc/check_mk/main.mkto include the hostname of your target host as the only value forall_hosts.all_hosts = [ "roma" ]
- Run
check_mk -Ito update the inventory of checks for all of Check_MK's configured hosts.# check_mk -I - Run
check_mk -Oto write new configuration to Nagios Core's configuration directory and restart it.# check_mk -O Generating configuration for core (type nagios)...OK Validating Nagios configuration...OK Precompiling host checks...OK Reloading monitoring core...OK
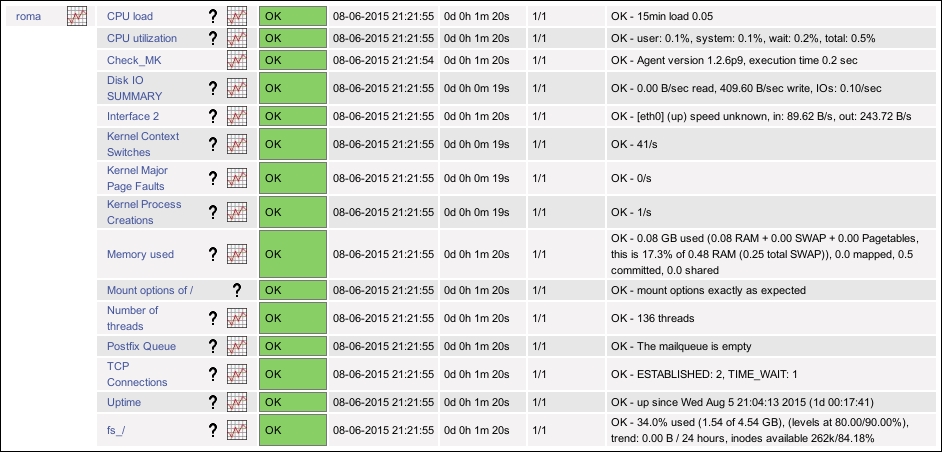
With this done, if you visit the Nagios Core web administration area, you should see a host has been automatically configured for you along with a set of service checks. The checks you see will vary depending on the activity of your host, as shown in the following screenshot:
We installed Check_MK on the Nagios Core monitoring server, allowing its use both as a plugin from Nagios Core and as a tool to detect services to monitor on target systems and to generate configuration for Nagios Core to monitor them. We then edited its main configuration file to specify that we wanted to detect services and generate configuration for the remote roma host specifically.
We then copied some support files from the Check_MK suite to the target host to install the agent, check_mk_agent, and the configuration for the internet superserver xinetd(8) to run it. The agent then starts listening on port 6556. You can test that this is working by connecting to the port with a tool like telnet(1) or netcat(1):
$ telnet roma 6556
Trying 192.0.2.61...
Connected to roma.example.net.
Escape character is '^]'.
<<<check_mk>>>
Version: 1.2.6p9
AgentOS: linux
AgentDirectory: /etc/check_mk
DataDirectory: /var/lib/check_mk_agent
SpoolDirectory: /var/lib/check_mk_agent/spool
...
This agent is the program that check_mk on the monitoring server contacts to get all the details about the target system's services. It requests all the details in a single check and then updates the details for all the monitored services from that data, using passive checks. This means that, unlike check_nrpe, check_mk only needs to run once to get all the data for that host.
Once this was done, we ran check_mk with its -I option, which updates its inventory of all the hosts it monitors and the services on them, and then with its -O option; this generates configuration for all the host and services checks into a new directory, in our case /usr/local/nagios/etc/check_mk.d, saving us the trouble of writing the configuration ourselves. In our example, Check_MK generated monitoring configuration for CPU load, CPU utilization, disk I/O, and many other services, all automatically. It even detected that we were running Postfix to monitor the number of messages in the mail processing queue!
Check_MK's functionality is not limited to being a replacement for check_nrpe or check_ssh; its functionality goes far deeper than that and advanced usage of it could fill a book in itself. If you think the automation that Check_MK offers is the way you'd like to configure Nagios Core, you can get a lot more information about Check_MK and the monitoring distribution in which it's included on its website at https://mathias-kettner.com/check_mk.html.
Similar security considerations apply to Check_MK deployment as do NRPE or SSH deployment. By default, the xinetd.conf file included with the system allows any host to query the data. If the target server is open to the internet without a firewall, this would be a major security hole. You should restrict network access to the service so that only the monitoring server can access the TCP port 6556 on the target server.
- The Monitoring local services on a remote machine with NRPE recipe in this chapter
- The Using check_by_ssh with key authentication instead of NRPE recipe in this chapter
- Submitting passive checks from a remote host with NSCA, Chapter 10, Security and Performance
- Reading status from a UNIX socket with mklivestatus, Chapter 10, Security and Performance