
In this chapter, we will cover the following recipes:
- Using the Tactical Overview
- Viewing and interpreting availability reports
- Viewing and interpreting trends
- Viewing and interpreting notification history
- Adding comments on hosts or services in the web interface
- Viewing configuration in the web interface
- Scheduling checks from the web interface
- Acknowledging a problem via the web interface
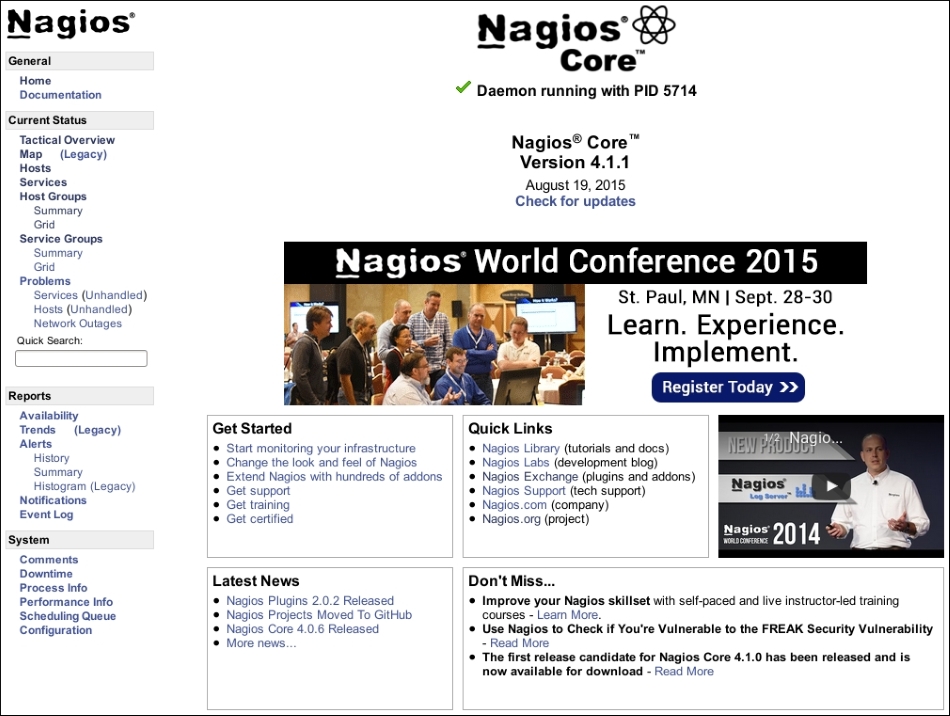
The Nagios Core web interface is an administrator's first port of call to see the current status of the network being monitored. By way of CGI and PHP scripts, it allows both an overview of the general performance of all the hosts and services being monitored and, going into more detail, about their current states and how checks are being performed. This provides considerably more details than are normally contained in e-mailed notifications. The default home page for the Nagios Core web administration area contains process information, news, and quick links, as shown in the following screenshot:
In most respects, the Nagios Core web interface (without any add-ons) is mostly geared for the display of information rather than configuring the server, but there are some things that can be done in it to actually change the way Nagios Core runs. These include the following tasks:
- Disabling or enabling active and passive checks, event handlers, notifications, and flap detection, whether for all hosts and services or specific ones
- Sending custom notifications about a host or service that don't necessarily correspond to an actual state change
- Rescheduling checks, which is commonly done to prioritize a check when there have been problems that the administrator thinks are now resolved and wishes to recheck
- Acknowledging problems, which is done to allow administrators to suppress further notifications from problems that they're working to fix
- Scheduling downtime to suppress notifications for a certain time period; this was discussed in the Scheduling downtime for a host or service recipe, in Chapter 3, Working with Checks and States
- Leaving comments on hosts and services for the benefit of any other administrator who inspects them; many of the actions in this list will do this implicitly
We won't offer a comprehensive survey of the web interface here, as much of its use is broken down in other chapters or is otherwise is reasonably self-explanatory. Instead, we'll explore the few runtime behavior changes we can arrange through the web interface listed before and on using and interpreting the reports available under the Reports heading of the left-hand side navigation menu.
Another important and extremely useful part of the web interface, the Network Status Map, is discussed in several recipes in Chapter 8, Managing Network Layout. We won't discuss it here, as it's so useful that it merits half a chapter in itself.