
In this recipe, you'll learn how to configure Nagios Core to process SNMP traps, which is information sent by monitored network devices to a central monitoring server.
Because SNMP traps often contain useful or urgent information about how a host is working, processing them in at least some way can be very helpful. It can be very helpful particularly for firmware network devices that can't use send_nsca to submit a passive check result in a standard form, as explained in the Submitting passive checks from a remote host with NSCA recipe.
As an example, most SNMP-capable hosts can be configured to send SNMP traps when one of their network interfaces changes state, perhaps due to a pulled network cable. These traps are known as linkUp and linkDown traps. Monitoring this particular kind of trap is especially useful for devices with a large number of interfaces, such as switches or routers.
Keeping track of these events in Nagios Core is valuable in order to keep a unified monitoring interface, as opposed to monitoring SNMP traps with a separate application.
There are quite a few prerequisites to getting this recipe to work. This method is among the most powerful but also most complex methods of Nagios Core monitoring.
First of all, the recipe assumes some knowledge of the Simple Network Management Protocol (SNMP). Unfortunately, SNMP is not very simple, despite its name! You should be familiar with the concepts of SNMP checks and SNMP traps. The documentation for Net-SNMP (the implementation of SNMP used for this example) may help here, which you can find at http://www.net-snmp.org/docs/readmefiles.html.
On the same host as your Nagios Core server with version 4.0 or greater, you should have snmptrapd installed to collect trap information and snmptt, the SNMP Trap Translator, to filter useful information from the traps and submit the information to Nagios Core in a workable format. The documentation for SNMPTT is available at http://snmptt.sourceforge.net/docs/snmptt.shtml.
Both systems are free software and relatively popular, so check whether there are packages available for your particular system to save the hassle of compiling them from source. On Debian-derived systems, such as Ubuntu, for example, they are available in the snmpd and snmptt packages.
We will use an event handler called submit_check_result, which is available in the Nagios Core distribution. You will, therefore, need to have access to the original sources handy. If you have misplaced them, you can download them again from Nagios' website (https://www.nagios.org/downloads/).
It's also necessary to use values of host_name for your hosts that actually correspond to hostnames resolvable by DNS from the monitoring server. This is because when the SNMP trap is received by SNMPTT, the only way it can translate the trap's source IP address to a hostname is with DNS. The host_name value for your host might be crete.example.net, but the trap will arrive from an IP address like 192.0.2.27. The system will, therefore, need to be able to resolve this with a reverse DNS lookup. An easy way to test whether this is working is to use host(1) or dig(1):
$ host 192.0.2.27
27.2.0.192.in-addr.arpa domain name pointer crete.example.net.
$ dig -x 192.0.2.27 +short
crete.example.net.
Finally, you should, of course, actually have a device configured to send SNMP traps to your monitoring server, which in turn is configured to listen for SNMP traps with the snmpd daemon. I don't really want to encourage you to unplug one of your core switches to test this, so we'll generate a trap manually with snmptrap(1) on the monitored server to demonstrate the principle.
We can configure a new service to receive SNMP traps for an existing host using the following steps:
- On the monitoring server running Nagios Core, copy the
contrib/eventhandlers/submit_check_resultevent handler script from the Nagios Core source files into/usr/local/nagios/libexec/eventhandlers. You may need to create the target directory first. Your source files need not be in/usr/local/src/nagios; this is just an example:# mkdir -p /usr/local/nagios/libexec/eventhandlers # cp /usr/local/src/nagios/contrib/eventhandlers/submit_check_result /usr/local/nagios/libexec/eventhandlers # chmod +x /usr/local/nagios/libexec/eventhandlers/submit_check_result
- Change to the Nagios Core objects configuration directory. For the default configuration, this directory is
/usr/local/nagios/etc/objects:# cd /usr/local/nagios/etc/objects - Edit the file containing the definition for the SNMP-enabled monitored host. In this example, the definition of
crete.example.netis in its owncrete.example.net.cfgfile:# vi crete.example.net.cfgThe host definition might look something like this:
define host { use linux-server host_name crete.example.net alias crete address 192.0.2.27 } - Add a service definition for your existing host that accepts only passive checks and is flagged as volatile. Here, we have used the
generic-servicetemplate included in the sample configuration. You may prefer to use a different template, but all the values defined here are important:define service { use generic-service host_name crete.example.net service_description TRAP is_volatile 1 check_command check-host-alive active_checks_enabled 0 passive_checks_enabled 1 max_check_attempts 1 } - Validate the configuration and restart the Nagios Core server:
# /usr/local/nagios/bin/nagios -v /usr/local/nagios/etc/nagios.cfg
# /etc/init.d/nagios restart
In the web interface, this service should now be visible in the Services section.

- Verify that the
submit_check_resultscript actually works by invoking it with a test string on the monitoring server:# /usr/local/nagios/libexec/eventhandlers/submit_check_result crete.example.net TRAP 0 'Everything working'After a short delay, if this has worked correctly, we should see the service change its state in the web interface to reflect the test.

We now need to configure snmptrapd and snmpd to receive traps and call the submit_check_result script for us. Follow the given steps to do so:
- Configure
snmpdto pass the received traps tosnmpttby changing its configuration file/etc/snmp/snmptrapd.conf. The following configuration may work:traphandle default /usr/sbin/snmptt disableAuthorization yes donotlogtraps yes
- Restart
snmpdto apply this change:# /etc/init.d/snmpd restart - Configure
snmpttto convert IP addresses to hostnames by changing the value fordns-enableto1in/etc/snmp/snmptt.ini:dns_enable = 1
- Configure
snmpttto use Net-SNMP at startup in/etc/snmp/snmptt.ini:net_snmp_perl_enable = 1
- Configure
snmpttto respond to an SNMP event by defining it in/etc/snmp/snmptt.conf. Here, we've used the genericlinkDownevent defined by the OID.1.3.6.1.6.3.1.1.5.3by adding a line to the already existing block:EVENT linkDown .1.3.6.1.6.3.1.1.5.3 "Status Events" Normal FORMAT Link down on interface $1. Admin state: $2. Operational state: $3 EXEC /usr/local/nagios/libexec/eventhandlers/submit_check_result $r TRAP 1 "linkDown for interface $1" SDESC
- A
linkDowntrap signifies that the SNMP entity, acting in an agent role, has detected that theifOperStatusobject for one of its communication links is about to enter the down state from some other state (but not from thenotPresentstate). This other state is indicated by the included value ofifOperStatus.EDESCDepending on your distribution, there may already be a definition for a
linkDownevent, in which case you may only need to change theEXECfield. - Restart
snmpttto apply these changes:# /etc/init.d/snmptt restart - From the monitored host, fire a test trap for a
linkDownevent. Substituteolympus.example.netfor the name or IP address of your monitoring host. This will require thesnmptraputility to be installed on that host and may requirerootprivileges:# snmptrap -v 1 -c public olympus.example.net .1.3.6.1.6.3.1.1.5.3 localhost 2 0 '' .1.3.6.1.2.1.2.2.1.1.1 i 1 - Check the Nagios Core log file at
/usr/local/nagios/var/nagios.logto check whether there's a new output from the event handler:[1448422541] EXTERNAL COMMAND: PROCESS_SERVICE_CHECK_RESULT;crete.example.net;TRAP;1;linkDown for interface 1 [1448422541] PASSIVE SERVICE CHECK: crete.example.net;TRAP;1;linkDown for interface 1 [1448422541] SERVICE ALERT: crete.example.net;TRAP;WARNING;HARD;1;linkDown for interface 1 [1448422541] SERVICE NOTIFICATION: nagiosadmin;crete.example.net;TRAP;WARNING;notify-service-by-email;linkDown for interface 1
If there's a new output, the same state should be reflected for the
TRAPservice in the web interface.
With this done, we've confirmed that SNMP traps from the crete.example.net host can be received and processed by the olympus.example.net server. We can apply the same setup for other hosts that generate SNMP traps in our network by configuring them to send their traps to the Nagios Core monitoring server and adding appropriate handlers for the expected traps.
If this doesn't work, the first thing to check should be that your monitoring server is actually listening for checks on the relevant IP address, as snmptrap does not throw errors when it cannot deliver traps. On Debian-derived systems, you should verify that the snmptrapd process is actually running; it may require a change to /etc/default/snmptrapd and a restart of snmptrapd.
When an SNMP trap is generated and delivered to the monitoring server by whatever means, the snmpd daemon passes it to the snmptt program for processing.
The snmptt handler checks whether the event OID matches any of the traps for which it has defined events in snmptt.conf. In our example, the program finds a handler defined for the OID .1.3.6.1.6.3.1.1.5.3, which corresponds to the linkDown event, with the number of relevant interfaces as an additional argument in $1.
Using this information, the program fires the submit_check_result handler that we installed in the first part of the recipe, setting the state of the TRAP service to WARNING and including the information linkDown for interface 1, as specified by the final argument to submit_check_result in the EXEC handler. The service can be set to notify the appropriate contacts or contact groups, just as it would for an actively monitored service.
If a trap arrives on the Nagios Core server for a host that Nagios Core doesn't know about, even if it has an event handler defined for snmptt, Nagios Core will simply ignore it.
In order to clear the state of the service and return it to OK, we can simply schedule an active check for it from the web interface with the Force Check tick.
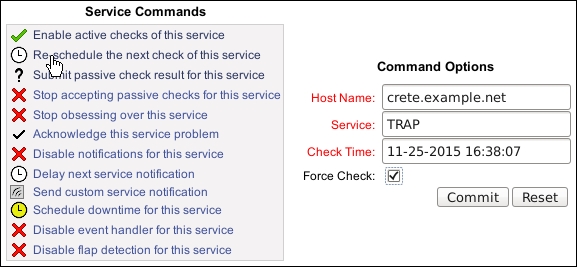
Because check_command is defined as check-host-alive, as long as the monitoring host is actually responding to PING, the service should assume the OK state:

- Monitoring the output of an SNMP query, Chapter 5, Monitoring Methods
- Creating an SNMP OID to monitor, Chapter 5, Monitoring Methods
- The Allowing and submitting passive checks recipe in this chapter
- The Submitting passive checks from a remote host with NSCA recipe in this chapter
- The Setting up an event handler script recipe in this chapter