
In this recipe, we'll take a look at the Tactical Overview screen of the Nagios Core web interface. Like its name implies, the screenshot on the following page provides a one-page summary of the current operating status of both the monitored hosts and services and the Nagios Core server itself.
You will need access to the Nagios Core web interface. In the default installation, the nagiosadmin user has the necessary privileges.
We can take a look at the Tactical Overview as follows:
- Log in to the Nagios Core web interface.
- Click on the Tactical Overview item in the left-hand side menu:

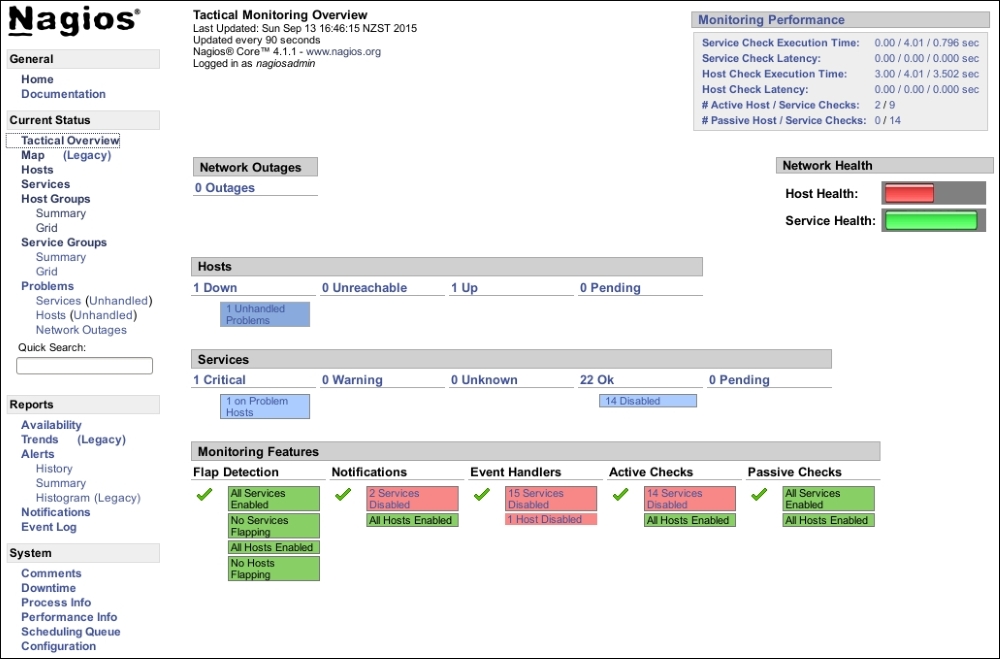
You should see the Tactical Monitoring Overview screen appear in the right-hand side frame:
- Try clicking on some of the items under Hosts and Services, for example, the Up count under Hosts. Note that you're presented with a listing of all the hosts that comprise that section.
- Return to the Tactical Overview, and try clicking on some of the items under the Monitoring Features heading, for example, the Enabled item under Flap Detection. Note that clicking on these brings you to a screen where you can quickly turn the relevant feature on or off (provided you have the appropriate privileges).
The Tactical Overview is a good first port of call whenever you become aware of problems with the monitored network, particularly, if you've a reason to believe that the problems are on more than one host. It's also a good place to visit to adjust monitoring features. For example, if a very large segment of your network is going to be down and it's not practical to schedule downtime for all the affected hosts, you could simply suppress notifications completely for a while in order to fix the problem with no distractions.
Note that the screen includes an overall assessment of the monitoring performance of the server in the top-right corner; this can be a useful first place to look if you suspect that the monitoring server is struggling to keep up with its tasks or want to get some idea of how many checks it's conducting.
Below that is a simple bar graph showing the general state of the network. It will change color depending on the severity of the problems; in the preceding screenshot, there are serious problems with some of the hosts on this network, and as a result, the bar is short and red in color.
If you find the Tactical Overview useful, it may be a good idea to make it the home page for the web interface, rather than the default page, which mostly just shows the Nagios Core branding, version, and some links. We can arrange this by changing the value of $url in /usr/local/nagios/share/index.php from main.php to cgi-bin/tac.cgi:
$url = 'cgi-bin/tac.cgi';
With this done, when we visit the /nagios/ URL on the monitoring host, the Tactical Overview should come up immediately. This can be done with any of the pages in the menu; the Services item is another good choice.