
In this recipe, you'll learn how to install and configure Nagiosgraph, which is a program that is integrated with Nagios Core's performance data tools to produce graphs that show long-term information about how checks for hosts and services are performing.
You will need to run a Nagios Core 4.0 or later server. Nagiosgraph will probably still work with older versions of Nagios Core, but the configuration may be slightly different. The INSTALL document included in the source for Nagiosgraph explains the differences in detail.
You should have a thorough understanding of defining hosts, services, and commands, and you should be able to install new software as the root user on the monitoring server. You should also be, at least, familiar with the layout of your Apache HTTPD server on the monitoring system; this recipe will assume that it is installed in /usr/local/apache.
Because Nagiosgraph has many Perl dependencies, you will need to have Perl installed on your server and you will likely also need to install a few Perl modules as dependencies. The package manager for your system may include them or you may need to download them using the Comprehensive Perl Archive Network (CPAN), which you can find at http://www.cpan.org/modules/INSTALL.html.
The server will need to already be monitoring at least one host with at least one service for the graphs to be of any use. Nagiosgraph includes rule sets that translate known performance data strings into usable statistics. This means that graphing will work well for familiar plugins with a predictable output format, such as check_ping or check_http, but might not graph data for less commonly used plugins without a little custom configuration.
This recipe is not a comprehensive survey of everything you can do with Nagiosgraph; if you like what this does, make sure to check out Nagiosgraph's documentation online at http://nagiosgraph.sourceforge.net/.
We can get some basic Nagiosgraph functionality for our monitoring server by following these steps:
- Download the latest version of Nagiosgraph from its website at http://nagiosgraph.sourceforge.net/ directly onto your monitoring server using a tool such as
wget:$ cd $ wget http://downloads.sourceforge.net/project/nagiosgraph/nagiosgraph/1.5.2/nagiosgraph-1.5.2.tar.gz
- Inflate the
.tar.gzfile and change into the uncompressed directory:$ tar xzf nagiosgraph-1.5.2.tar.gz $ cd nagiosgraph-1.5.2
- As the root user, run the
install.plscript with the--check-prereqoption. This will give you a survey of any dependencies you may need to install via Debian packages or CPAN. When you have installed all the prerequisites, the output should look something like this:# ./install.pl --check-prereq checking required PERL modules Carp...1.3301 CGI...4.09 Data::Dumper...2.151_01 Digest::MD5...2.53 File::Basename...2.85 File::Find...1.27 MIME::Base64...3.14 POSIX...1.38_03 RRDs...1.4008 Time::HiRes...1.9726 checking optional PERL modules GD...2.53 Nagios::Config... ***FAIL*** checking nagios installation found nagios exectuable at /usr/local/nagios/bin/nagios found nagios init script at /etc/init.d/nagios checking web server installation found apache executable at /usr/sbin/apache2 found apache init script at /etc/init.d/apache2
These are all reasonably standard Perl libraries, so don't forget to check whether the packages are available for them before you resort to using CPAN. For example, I was able to install the RRDs and GD modules on my Debian system as follows:
# apt-get install librrds-perl libgd-gd2-perlIf you are having trouble getting
install.plto find your Nagios Core or Apache HTTPD instances, take a look at the output ofinstall.pl --helpto run an installation specific to your kind of system. This is documented in more detail in theINSTALLfile. - As the
rootuser, run theinstall.plscript with the--installargument. You will be prompted many times for directory layout options. The default is shown in square brackets and should be correct for a typical Nagios Core installation, so, to start with, simply press Enter on each option:# ./install.pl --install ...Destination directory (prefix)? [/usr/local/nagiosgraph] Location of configuration files (etc-dir)? [/usr/local/nagiosgraph/etc] Location of executables? [/usr/local/nagiosgraph/bin] Location of CGI scripts? [/usr/local/nagiosgraph/cgi] Location of documentation (doc-dir)? [/usr/local/nagiosgraph/doc] Location of examples? [/usr/local/nagiosgraph/examples] Location of CSS and JavaScript files? [/usr/local/nagiosgraph/share] Location of utilities? [/usr/local/nagiosgraph/util] Location of state files (var-dir)? [/usr/local/nagiosgraph/var] Location of RRD files? [/usr/local/nagiosgraph/var/rrd] Location of log files (log-dir)? [/usr/local/nagiosgraph/var] Path of log file? [/usr/local/nagiosgraph/var/nagiosgraph.log] Path of CGI log file? [/usr/local/nagiosgraph/var/nagiosgraph-cgi.log] URL of CGI scripts? [/nagiosgraph/cgi-bin] URL of CSS file? [/nagiosgraph/nagiosgraph.css] URL of JavaScript file? [/nagiosgraph/nagiosgraph.js] Path of Nagios performance data file? [/tmp/perfdata.log] URL of Nagios CGI scripts? [/nagios/cgi-bin] username or userid of Nagios user? [nagios] username or userid of web server user? [www-data] Modify the Nagios configuration? [n] Modify the Apache configuration? [n] ...
After the preceding selections are all made, the files should be installed with appropriate permissions set. The final part of the output gives instructions to add configuration to Nagios Core and Apache HTTPD, which we'll do next.
- Change to the Nagios Core configuration directory. In the quick start guide installation, this directory is
/usr/local/nagios/etc:# cd /usr/local/nagios/etc - Edit the core configuration file
nagios.cfg, and add the following directives at the end of the file:# process nagios performance data using nagiosgraph process_performance_data=1 service_perfdata_file=/tmp/perfdata.log service_perfdata_file_template=$LASTSERVICECHECK$||$HOSTNAME$||$SERVICEDESC$||$SERVICEOUTPUT$||$SERVICEPERFDATA$ service_perfdata_file_mode=a service_perfdata_file_processing_interval=30 service_perfdata_file_processing_command=process-service-perfdata-for-nagiosgraph
- Change to the Nagios Core objects configuration directory. In the quick start guide installation, this directory is
/usr/local/nagios/etc/objects:# cd /usr/local/nagios/etc/objects - Edit the
commands.cfgfile and add the following command definition:# command to process nagios performance data for nagiosgraph define command { command_name process-service-perfdata-for-nagiosgraph command_line /usr/local/nagiosgraph/bin/insert.pl } - Edit the
httpd.conffile for your Apache HTTPD server to include the following line at the end:Include /usr/local/nagiosgraph/etc/nagiosgraph-apache.conf
In a local install of Apache HTTPD, this file is normally in
/usr/local/apache/conf/httpd.conf, but its location varies as per your system. On Debian-derived systems, it may be/etc/apache2/apache2.conf. - Validate the configuration of both the Apache HTTPD server and the Nagios Core server and restart them both:
# /usr/local/apache/bin/apachectl configtest
# /usr/local/apache/bin/apachectl restart
# /usr/local/nagios/bin/nagios -v /usr/local/nagios/etc/nagios.cfg
# /etc/init.d/nagios restart
- Visit
http://olympus.example.net/nagiosgraph/cgi-bin/showconfig.cgiin your browser, substituting your own Nagios Core server's hostname to check whether everything's working. You should see a long page with configuration information for Nagiosgraph after this: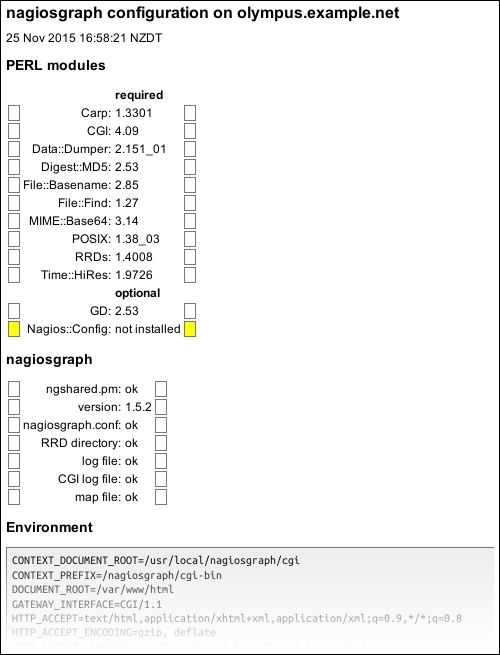
- If everything works well up to this point, the only thing left to do is define an action URL for the services that you want to graph so that you can click to go directly to the graphs for that service from the Nagios Core web interface.
The tidiest and most straightforward way to do this is to define a service template:
define service {
    name        nagiosgraph
    action_url  /nagiosgraph/cgi-bin/show.cgi?host=$HOSTNAME$&service=$SERVICEDESC$
    register    0
}
Then, you can have the services you want graphed inherit from the template, as well as from any other templates they use, by adding a comma and
nagiosgraphto the value for theusedirective:define service { use generic-service,nagiosgraph host_name corinth.example.net service_description PING check_command check_ping!100,10%!200,20% }You should do this for all the services for which you want graphing.
- Validate the configuration and restart the Nagios Core server again:
# /usr/local/nagios/bin/nagios -v /usr/local/nagios/etc/nagios.cfg
# /etc/init.d/nagios restart
With this done, visiting the Services section of the web interface should include action icons after each graphed service:

Clicking on one of these should bring up a graph interface; for example, a service using check_ping might show something like the following:

Note that the graph includes two line bars to show the thresholds for the CRITICAL and WARNING state as well as the actual response time. Also note that the preceding graph is several hours old; it will take a while to build up enough data to see a perceptible line and you may not see any graphs until performance data has actually been received from Nagios by Nagiosgraph.
Don't forget that graphs won't work out of the box for every service. If Nagiosgraph doesn't know how to parse the performance data for a check, it will show red error text instead of graphs. We'll mention an approach to fix this in the There's more section.
The preceding configuration changes prompt Nagios Core to log performance data for every check on every service using the service_perfdata_file_processing_command directive. This command, named process-service-perfdata-for-nagiosgraph, is defined to pass data to the bin/insert.pl script included in the new /usr/local/nagiosgraph directory.
This script, in turn, parses performance output, such as the following output from a typical service using check_ping:
PING OK - Packet loss = 0%, RTA = 174.19 ms
Nagiosgraph extracts numeric information from the performance data, according to the templates defined in /usr/local/nagiosgraph/etc/map, using Perl's regular expressions. This data is recorded using Perl's bindings for the RRD library and is graphed using the GD2 library with an appearance similar to graphs produced by MRTG.
The action_url directive uses macros for each service to define a URL for each service that shows its graphs. In our example, for a service PING on the corinth.example.net host, the action_url command would expand to the following:
action_url /nagiosgraph/cgi-bin/show.cgi?host=corinth.example.net&service=PING
This isn't the only possible use of action_url, of course; it just happens to be a useful one in our case. You can make the action_url command go anywhere you'd like for a given host or service.
You may well be running some kind of check that Nagiosgraph isn't able to graph because it doesn't understand the format of the performance output and can't extract numeric information from it. The default mapping rules cover output from quite a few standard plugins, but if you know a little Perl, you should be able to add more rules to /usr/local/nagiosgraph/etc/map to process other kinds of plugin output.
Besides the examples already in the map file, which includes instructions for writing new output checks, there are more examples of such definitions included in the /usr/local/nagiosgraph/examples/map_examples file.
If you're comparing Nagios graphing solutions, another popular solution to try could be PNP4Nagios, which is available at http://docs.pnp4nagios.org/pnp-0.6/start.
- Monitoring Nagios performance with Nagiostats, Chapter 10, Security and Performance
- The Getting extra visualizations with NagVis recipe in this chapter