
In this recipe, we'll explore some simple applications of the NDOUtils database by trying out some queries and changing one of them into both a simple daily e-mail in Perl and also into a PHP-based RSS feed.
This recipe assumes that you have NDOUtils already installed and that your Nagios Core 4.0 or higher server is monitoring at least a few hosts and services so that the queries we try actually return some data. You should also have some means of executing MySQL queries on the database server. The mysql(1) command-line client will work just fine; a web-based tool such as phpMyAdmin might make the data a little easier to explore.
We can explore some queries against the NDOUtils databases as follows:
- Retrieve the content and date/time of the latest 10 notifications:
mysql> SELECT start_time, long_output FROM nagios_notifications ORDER BY start_time DESC LIMIT 10; - Retrieve the content and date/time of the latest 10 host or service comments:
mysql> SELECT entry_time, comment_data FROM nagios_commenthistory ORDER BY entry_time DESC LIMIT 10; - Count the number of hosts currently in the
OKstate:mysql> SELECT COUNT(1) FROM nagios_hoststatus WHERE current_state = 0; - Retrieve the names of all hosts that are currently in scheduled downtime:
mysql> SELECT display_name FROM nagios_hosts JOIN nagios_hoststatus USING (host_object_id) WHERE scheduled_downtime_depth > 0; - Return a list of all hostnames and the number of services associated with them:
mysql> SELECT nagios_hosts.display_name, COUNT(service_id) FROM nagios_hosts LEFT JOIN nagios_services ON nagios_hosts.host_object_id = nagios_services.host_object_id GROUP BY nagios_hosts.host_object_id;
We could implement a Perl script to print the latest 10 notifications using the DBI module as follows:
#!/usr/bin/env perl
# Enforce Perl best practices
use strict;
use warnings;
# Import database modules
use DBI;
use DBD::mysql;
# Get connection to database
my $nagios = DBI->connect(
    'dbi:mysql:dbname=nagios;host=localhost',
    'ndo',
    'mPYxbAYqa'
) or die "Could not connect to database";
# Define an SQL query to run
my $query = q{
    SELECT
        notification_id, start_time, name1, long_output
    FROM
        nagios_notifications
    JOIN
        nagios_objects USING (object_id)
    ORDER BY
        start_time DESC
    LIMIT
        10
};
# Execute query and retrieve notifications
my $notifications = $nagios->selectall_hashref(
    $query,
    'notification_id'
) or die 'Could not retrieve notifications';
# Print each notification
foreach my $id (keys %{$notifications}) {
    my $notification = $notifications->{$id};
    printf {*STDOUT} "%s - %s: %s
",
        $notification->{start_time},
        $notification->{name1},
        $notification->{long_output};
}
# Exit successfully
exit 0;
After saving the code into a latest-notifications.pl file, we could run it like this:
$ chmod +x latest-notifications.pl
$ ./latest-notifications.pl2015-11-25 10:11:27 - blog: PING OK - Packet loss = 0%, RTA = 160.31 ms2015-11-25 10:48:17 - athens: PING OK - Packet loss = 0%, RTA = 155.82 ms2015-11-25 14:08:17 - athens: PING WARNING - Packet loss = 16%, RTA = 171.79 ms2015-11-25 14:13:17 - athens: PING OK - Packet loss = 0%, RTA = 164.39 ms2015-11-25 10:56:17 - athens: PING CRITICAL - Packet loss = 28%, RTA = 164.65 ms2015-11-25 10:38:17 - athens: PING CRITICAL - Packet loss = 28%, RTA = 166.10 ms2015-11-25 10:06:27 - blog: PING WARNING - Packet loss = 16%, RTA = 163.72 ms2015-11-25 13:39:27 - blog: PING WARNING - Packet loss = 16%, RTA = 163.78 ms2015-11-25 13:44:27 - blog: PING OK - Packet loss = 0%, RTA = 167.10 ms2015-11-25 13:29:27 - blog: PING CRITICAL - Packet loss = 28%, RTA = 159.55 ms
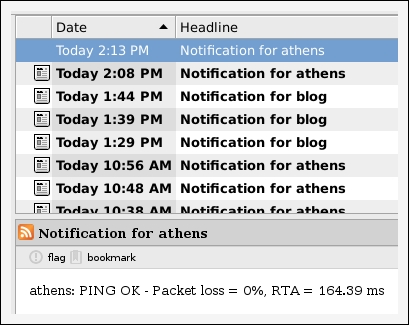
Similarly, we could implement a crude RSS feed for notifications using PHP5 with PDO MySQL as follows:
<?php
// Get connection to database
$nagios = new PDO(
    'mysql:host=localhost;dbname=nagios',
    'ndo',
    'mPYxbAYqa'
);
// Define an SQL query to run
$query = '
    SELECT
        start_time, name1, long_output
    FROM
        nagios_notifications
    JOIN
        nagios_objects
    USING
        (object_id)
    ORDER BY
        start_time DESC
    LIMIT
        10
';
// Retrieve all the notifications as objects
$statement = $nagios->prepare($query);
$statement->setFetchMode(PDO::FETCH_OBJ);
$statement->execute();
// Read the notifications into an array
for ($notifications = array(); $notification = $statement->fetch(); ) {
    $notifications[] = $notification;
}
// Send an RSS header rather than an HTML one
header("Content-Type: application/rss+xml; charset=utf-8");
echo '<?xml version="1.0" encoding="UTF-8"?>';
?>
<rss version="2.0">
    <channel>
        <title>
            Latest Nagios Core Notifications
        </title>
        <link>
            http://olympus.example.net/nagios/
        </link>
        <description>
            The ten most recent notifications from Nagios Core
        </description>
<? foreach ($notifications as $notification): ?>
        <item>
            <description>
                <?= htmlspecialchars($notification->name1); ?>: <?= htmlspecialchars($notification->long_output) ?>
            </description>
            <pubDate>
                <?= htmlspecialchars(date('r', strtotime($notification->start_time))) ?>
            </pubDate>
        </item>
<? endforeach; ?>
    </channel>
</rss>
After saving it in a file named latest-notifications.php, we could subscribe to the feed it produces in our favorite RSS reader, such as Liferea (http://liferea.sourceforge.net/).
The preceding examples are just to get you started with very simple reports; there is a wealth of data available in the NDOUtils database to explore. Here are some other possibilities for reports that could be written: