
Eventually, we will want to view multiple types of system activity simultaneously. While sar has many operating modes, its output is linear. Without a tool to interpret its exhaustive data, we are left with a lot of manual analysis of several sar invocations. While iostat and iotop are wonderful tools, they are rather limited in scope by comparison.
So, let us introduce dstat. While dstat can't access historical data like sar, it can display output from several different operation modes side by side. It also includes color coding to easily distinguish units. It's a very pretty command-line tool and summarizes several different metrics at a glance.
For servers that are of particular importance, we actually keep a terminal window that displays the dstat results open so that we get an early warning when numbers begin to look bad.
The output from dstat is very colorful. Obtain a few samples with these steps:
- Display default information with this command:
dstat - Display only system load and network activity with this command:
dstat -n -l - Display CPU usage, I/O, and disk utilization averaged over 5 second intervals with this command:
dstat -c -r --disk-util 5 - For the next 10 seconds, display the time, memory usage, interrupts and context switches, disk activity from only the
sdadevice, and the process using the most I/O. In addition, capture the results to acsvfile, all with this command:dstat -tmyd -D sda --top-io --output /tmp/stats.csv 1 10
We hope it's obvious by now that the number of combinations available for the dstat output is effectively infinite. By default, the dstat output resembles this:
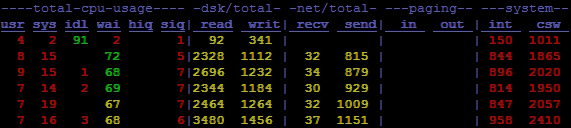
The default output from dstat enables CPU, disk, network, memory paging, and system modules. In this particular example, we can see that the wai column is extremely high, suggesting that the server is currently I/O bound.
Another interesting thing about dstat is that it really only displays the exact modules we request. For the second example, the output becomes this:
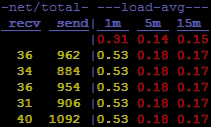
In this second example, we've only enabled the network (-n) and system load (-l) modules, thus extremely reducing the output width. Yet, at the same time, this sparse format makes it very easy to combine several different metrics without absurdly wide terminal windows.
The third sample begins using dstat plugins. By activating the --disk-util argument, dstat will show the utilization percentage for all active storage devices. This is in addition to the CPU stats (-c) and I/O (-r) that we already activated.
By adding the last parameter (5), we again take advantage of a common trend for system view utilities. The last two optional parameters are for sample interval and count. In the case of dstat, any number printed while the interval is greater than one is actually the average of all the metrics collected during that time period. So, for our third example, these numbers are all 5 second cumulative averages. For posterity, the output looks like this:
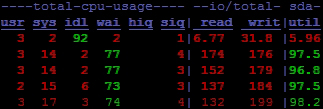
This may be difficult to see, but the last line in this output is not bold like the rest. This means that this particular line had not yet reached the requested interval of 5 seconds. It's not an important detail, but it shows just how much attention the dstat developers paid to convey information visually. We easily see a high percentage of CPU waits, and the sda device is utilized over 90 percent by the read and write activity. It looks like a visual presentation works pretty well.
For our fourth and final example, we try to include as many separate types of data as possible. At the beginning, we enable the -t, -m, -y, and -d switches. This adds timestamp, memory performance, interrupts and context switches, and device activity to the dstat output. We also take advantage of the -D parameter to limit disk statistics to the sda device. Default disk statistics are inclusive, but now, we can actually restrict the output to interesting devices.
Next, we add --top-io to list the process that's using the most I/O while dstat runs. Earlier, we needed iotop to get that data. Of course, iotop provides more depth and lists more than one culprit, but for quick identification, it's hard to beat dstat. Then, we use the --output parameter to send the csv output to /tmp/stats.csv so that we can potentially use a spreadsheet program to analyze or graph the data we gathered.
Finally, we take advantage of both the interval and count parameters so that we capture only 10 seconds of statistics. For all of that work, we're rewarded with this output:
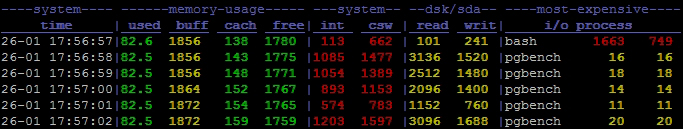
Oh! It looks like all of the I/O and load we saw earlier was due to a pgbench test. How embarrassing!