
While Nagios is well established in the system administration community, it retains a few shortcomings due to its long legacy. This is not to suggest that Nagios is a bad platform! However, we can make it better for our own uses and for other administrators that help us monitor our database clusters.
check_mk is a popular extension to Nagios that provides a better interface, more built-in monitors, and—for those interested—a GUI management system. This management GUI is actually one of the main things we will cover in this recipe, as it has some idiosyncrasies of its own. However, once we're done presenting the basics, we encourage you to experiment with some of its more powerful features.
To complete this recipe, we will need a configured Nagios installation. Please follow the steps in the Installing and configuring Nagios recipe. However, either skip the Configuring Nagios to monitor a database host recipe or follow these two steps:
- Delete the
db_conf.cfgfile that we created for our database host. - Reload the
nagiosservice.
For the purposes of this recipe, our database has a local hostname of pg-1, and the monitor server is named monitor-server. Follow these steps to use check_mk to create and configure the host and service monitors for our PostgreSQL server:
- Install
check_mkaccording to the comprehensive instructions at https://mathias-kettner.com/checkmk_manual_install.html. - Navigate to the monitor server in a web browser to the
check_mkURL:http://monitor-server/check_mk - Enter
nagiosadminas the username and the password created during the installation of Nagios in the Installing and configuring Nagios recipe. - Click on Hosts in the WATO – Configuration segment of the left sidebar.
- Click on the Create new folder icon.
- Name the folder
PostgreSQL Servers, and click on Save & Finish. - Click on the PostgreSQL Servers folder.
- Click on the Create new host icon.
- Set the Hostname to
pg-1, the Alias toPostgreSQL Node 1, and click on Save & Finish. - Click on the highlighted inventory link in the information box above the list of hosts.
- Click on Activate missing above the list of hosts.
- Click on the orange icon that says there are 2 Changes.
- Click on the Activate Changes! icon.
- Wait for 5 minutes; then, click on All services in the Views segment of the left sidebar.
While we could have included instructions on installing check_mk, they are actually very long and would have required several pages of explanation. The official check_mk site does an admirable job presenting the installation process, so why duplicate it? The abundant documentation is a great reason to use check_mk.
Once we log in, we see a very large and somewhat imposing interface. However, for now, we are only interested in the left sidebar. What we're looking for is the web administration tool (WATO) section, as seen here:
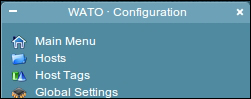
The interface is actually very friendly to new users. Once we click on Hosts, we can either create a new host right away or create a folder first. We recommend that you always group the servers in specific folders to make bulk actions easier. Thus, we click on this enticing icon:

After we name and save the folder, we can enter the folder and create the new host. After creating the host and saving its configuration, we are presented with this notice:
When check_mk inventories a server, it attempts to automatically detect the services and resources it can monitor. Nagios definitely can't do this! Once we activate all of the changes we made, we need to wait for a minute or two for check_mk to add the new checks and collect the status of each. Once some time has elapsed, we can click on All services to see our newly monitored PostgreSQL server:
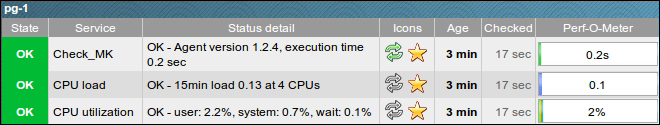
On our particular test server, check_mk found over 20 services it knew how to monitor. We don't have to select all of them, of course, but adding the same services to Nagios would have been much more difficult.
check_mk doesn't just provide a handy web interface, but it actually has a very advanced command-line utility. For instance, if we stopped the recipe after creating the folder and server and then activated the changes, we could have performed the server inventory with these two commands:
cmk -I pg-1
cmk -O
The first command checks the pg-1 server for new services. The second saves the services it found and reloads Nagios so that it can see them as well. The command-line tool makes a great companion to the web interface when handling several server clusters.
We really like the check_mk documentation. It's comprehensive, verbose, and full of examples. Check some of the following links for more information:
- Quick Manual Installation Guide: https://mathias-kettner.com/checkmk_turbostart.html
- Calling check_mk: https://mathias-kettner.com/checkmk_calling.html
- Catalog of check plugins: https://mathias-kettner.com/checkmk_check_catalogue.html