
Graphite has a good interface and a lot of graph options but no real data. collectd gathers a lot of data but has no real interface. Luckily, we can combine the two, thanks to a collectd module named write_graphite.
In order to feed the collectd data into Graphite, we simply need to modify two configuration files on the monitoring server and restart collectd. After we do this, we can enable more collectd modules, add more PostgreSQL queries, and so on. All the collectd data will be transmitted to Graphite until we break the connection.
This is powerful functionality, as we will demonstrate.
In this recipe, we will be using both collectd and Graphite. Please follow the instructions in the Installing and configuring collectd and Installing and configuring Graphite recipes before continuing.
To send the collectd data to Graphite, follow these steps only on the server monitoring our PostgreSQL nodes:
- Add the following section to the top of the
storage-schemas.conffile in the/opt/graphite/confdirectory:[collectd] pattern = ^collectd. retentions = 10s:1d,1m:7d,5m:30d,10m:90d,1h:1y
- Restart the
carbondaemon with the following commands:sudo /opt/graphite/bin/carbon-cache.py stop sudo /opt/graphite/bin/carbon-cache.py start
- Replace the contents of the
local.conffile in/etc/collectdwith the following contents:LoadPlugin write_graphite <Plugin write_graphite> <Node "mon1"> LogSendErrors true Prefix "collectd." StoreRates true SeparateInstances true </Node> </Plugin> - Restart the collectd daemon with the following command:
sudo service collectd restart
The first thing we need to do is prepare carbon and whisper for the data that will be arriving from collectd. By default, whisper will apply storage settings in the order they appear in the storage-schemas.conf file and has an existing default at the end. Thus, we must place our settings at the top of the file to ensure they're properly applied.
After naming the storage schema [collectd], we specify a pattern for carbon to recognize the collectd data. Any incoming data that fits this expression will use the retention periods that we've configured. Regarding these retention periods, we should be able to see detailed statistics for recent data and observe trends when viewing them over longer periods.
As such, we've told Graphite to keep every 10 seconds for 1 day, every minute for a week, every 5 minutes for a month, every 10 minutes for 3 months, and every hour for a year. Feel free to adjust these periods to reflect your preferences. Afterwards, we restart carbon to ensure that it reads the new configuration values we've set.
The next step is to configure the local collectd daemon on the monitoring server to send data to Graphite. Remember, collectd on the monitoring server is also aggregating performance metrics from several other servers. The collectd daemons in Listen mode will forward all the data to Graphite, so it makes sense to make our changes there.
We begin by loading the write_graphite module. The next step is to configure this module with the settings we want. Many of the default values are actually desirable, so we'll ignore them. Note that we set Prefix to collectd, because Graphite uses periods as separators for data points. This means that the interface will group all the collectd data under a single heading, as seen here:
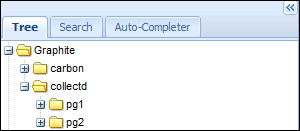
This makes it easier to group data. This also matches the pattern we used when setting the data retention periods. In our preceding example, we have two PostgreSQL servers monitored by collectd, and they're easy to find.
The other notable setting is SeparateInstances, which further groups related data. As an example, if data was named pg2.postgresql-production, it will now be named pg2.postgresql.production instead. By separating the sections with a period, the sections do not get their own header but are grouped together instead. This means we can group environments under the postgresql banner, for instance. Otherwise, we would have postgresql-production, postgresql-stage, postgresql-dev, or other separate entries for each system variation.
Finally, we restart the collectd daemon so that it incorporates the write_graphite plugin safely. If we wait for a few moments and reload our Graphite web interface, we should see new graph activity. After finding the appropriate node to view, we should be greeted by this:

As we've used write_graphite from collectd and storage schema settings for Graphite, we've included manuals for both. You may have to search, but these pages should provide more information on the elements covered in this recipe:
- Configuring Carbon: http://graphite.readthedocs.org/en/latest/config-carbon.html
- The collectd.conf Manpage: http://collectd.org/documentation/manpages/collectd.conf.5.shtml
- The write_graphite Plugin: https://collectd.org/wiki/index.php/Plugin:Write_Graphite