
Sometimes, the only way to truly observe a server process is by using the kernel itself. This kind of data is invaluable for troubleshooting or research into PostgreSQL activity.
The Linux strace utility provides detailed system trace data for any process or service running on the server. For use with PostgreSQL, this utility means we can target the database itself or any of the background processes it uses for maintenance.
Perhaps, more importantly, we can debug or examine any client connection. Is the network connection permanently hung? Is the client sending thousands of simple SQL requests instead of bulk-handling the results of a single large query? The strace command output is both intricate and verbose. Let's use strace to inspect our server and see what we can discover.
There are certain limitations to using strace. Because of its high-level access to process information, only root-level users are allowed to examine an application's activity. Make sure to have this capability before continuing.
As we want activity we can depend on, open a connection to PostgreSQL for us to locate later. We will be using this connection to generate debug output.
Follow these steps to examine the PostgreSQL processes in various ways:
- In our PostgreSQL connection, execute the following query to find the process ID of the server backend assigned to us:
SELECT pg_backend_pid() AS pid;
- As our root-capable user, attach
straceto the precedingpid(4200, for example) with this command:sudo strace -p 4200 - In our PostgreSQL connection, execute the following query to generate some activity:
SELECT 1;
- In the terminal where
straceis running, press Ctrl + C to disconnect. - Attach
straceagain, but collect the statistics with the following command:strace -c -S calls -p 4200 - Now, execute the following query to generate some complex activity:
SELECT * FROM information_schema.columns;
- In the terminal where
straceis running, press Ctrl + C to disconnect. - Attach
stracea final time, but limit the output with the following command:strace -e recvfrom -p 4200 - Execute the following query to generate a simple activity:
SELECT 1;
We can connect to any process with strace, but for demonstrative purposes, we elect to control the environment by watching a connection we directly control. The pg_backend_pid function returns the process ID of the backend process that serves our client, which then lets us monitor its activity on the server.
With the pid of the backend, we can monitor it with the -p parameter to strace, which watches the listed process ID. As we don't want too much output, we elect to execute a very simple query that does not touch the tables, functions, or views. Our output should resemble this:
Process 4200 attached - interrupt to quit recvfrom(11, "Q���16SELECT 1;�", 8192, 0, NULL, NULL) = 15 sendto(11, "T���!�1?column?����������27�4377377377377"..., 66, 0, NULL, 0) = 66
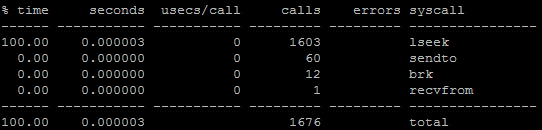
Once we press Ctrl + C, strace exits, and we can try a different combination of parameters. For example, the -c setting disables the normal output in favor of summarizing the kernel calls. If we use the -S parameter to change the sort column, we can focus on repeated calls. As counts will be boring with only a few columns, we've suggested a query that will touch on several database objects. Once we exit from the second strace command, the output looks like this:
Finally, we would like to introduce the -e parameter, which limits the strace output to the calls listed. In our case, we chose recvfrom, which is a network-related call that the backend uses to await requests. When in this mode, strace will only print recvfrom calls and nothing else.
Output from strace can be somewhat esoteric, especially as it limits the content length by default to increase readability. If we want to really capture a lot of data with extreme verbosity that will help a human make a diagnosis, we need to increase the string length. For strace, the parameter for that is -s. If we wanted to greatly extend the length of the string output, we can do that with this command:
strace -p 4200 -s 2000
Then, if we execute the following query:
SELECT 'This is a very long query to view.';
We would see this output:
recvfrom(11, "Q���001select 'This is a very long query to view.';�", 8192, 0, NULL, NULL) = 50
Instead of this:
recvfrom(11, "Q���001select 'This is a very long"..., 8192, 0, NULL, NULL) = 50
This is all that is required to monitor PostgreSQL, as even simple queries and data are truncated with default settings.