
Before we can really decide how to spread our data across several database servers, we need to find appropriate candidates. To do this, we should start at the database level for databases that are extremely active. What qualifies as extremely active? Databases that fit any of these criteria are a good start:
- The database experiences more than 10 million transactions per day
- The database handles more than 100 million queries per day
- The database writes more than 100 million tuples per day
Once we've chosen a database for horizontal scalability, we need to look at its tables and decide which should be distributed. Tables that make good choices are those that fit one or more of the following criteria:
- Tables that contain more than 10 million rows
- Tables that experience more than 1 million writes per day
- Tables that are larger than 10 GB
This recipe will discuss easy ways to find prospective tables for further study.
This recipe uses an existing database for concrete numbers. If you do not have one of these, create it with pgbench using the following commands as the postgres user:
createdb pgbench
pgbench -i -s 200 pgbench
The -i flag initializes a new series of benchmark tables, and the -s flag specifies the scale of the data. We started with a scale of 200, so our largest table has 20 million rows and is about 3 GB in size. Feel free to use a higher scale for demonstrative purposes.
We will also be using the pg_stat_statements extension that we discussed in the Checking the pg_stat_statements view recipe from Chapter 4, Troubleshooting. Make sure it's installed in every database with the following SQL statement:
CREATE EXTENSION pg_stat_statements;
As the postgres user on a suitable PostgreSQL cluster, follow these steps to find horizontal scalability candidates:
- Execute the following query while connected to any database:
SELECT * FROM ( SELECT d.datname AS database_name, d.xact_commit + d.xact_rollback AS transactions, d.tup_inserted + d.tup_updated + d.tup_deleted AS writes, (SELECT sum(calls) FROM pg_stat_statements s WHERE s.dbid = d.datid) AS queries FROM pg_stat_database d LEFT JOIN pg_stat_statements s ON (s.dbid = d.datid) WHERE d.datname NOT IN ('template0', 'template1', 'postgres') ) db WHERE db.transactions > 10000000 OR db.writes > 100000000 OR db.queries > 100000000; - Create the following view in the candidate database with this SQL statement:
CREATE OR REPLACE VIEW v_shard_candidates ASSELECT c.oid::regclass::text AS table_name, c.reltuples::NUMERIC AS num_rows, pg_total_relation_size(c.oid) / 1048576 AS size_mb, t.n_tup_ins + t.n_tup_upd + t.n_tup_del AS writes FROM pg_class c JOIN pg_namespace n ON (n.oid = c.relnamespace) JOIN pg_stat_user_tables t ON (t.relid = c.oid) WHERE n.nspname NOT IN ('pg_catalog', 'information_schema') AND c.relkind = 'r' AND (c.reltuples > 10000000 OR t.n_tup_ins + t.n_tup_upd + t.n_tup_del > 1000000 OR pg_total_relation_size(c.oid) / 1048576 > 10240); - Use this query to check the view to match tables:
SELECT *
  FROM v_shard_candidates
 ORDER BY size_mb DESC;
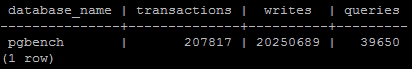
The first step checks the pg_stat_database system view. This provides various global statistics about all databases in the PostgreSQL database cluster. This is a very easy way to obtain a list of extremely active databases that we can break into smaller pieces. The query gives us all three numbers we want regarding database statistics.
Our example database isn't quite busy enough, so we omitted the entire WHERE clause to show the pgbench database statistics:
To get specific table measurements, we need to connect to any databases named by the database activity query. Then, we create a view that will always provide a list of tables that match our three criteria. This will probably be used much more often than the database query, so it's handy to have it defined at all times.
The view itself isn't too complicated but deserves some explanation. The pg_total_relation_size function provides the size of the table, including all indexes and TOAST data. This is important because the full impact of a table is much more than the data it contains. The pg_total_relation_size function returns results in bytes, so we transform it to megabytes so that it's more useful to us.
We restrict relkind to r because this restricts matches to relations, which is how PostgreSQL identifies tables. The last thing we do is apply our three conditions for candidate tables such that any criterion is enough for the table to appear in our list. The last query simply invokes the view and orders the results nicely for us.
Our pgbench database contained a single matching table, as seen here:
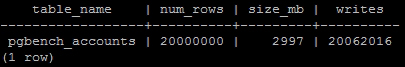
We can see that the pgbench_accounts table contains 20,000,000 rows and is 2997 MB in size.
Growth rates are also important. We recommend that you create a scheduled task that checks these results at the end of every day and either e-mails them to you or saves them into a table for further examination. After statistics are checked and logged, call these two functions to reset them to zero:
SELECT pg_stat_statements_reset();
SELECT pg_stat_reset();
Any tables that are growing quickly are even more critical to identify early.
We used quite a few system views in this recipe. Please use the following URLs to PostgreSQL documentation that provides further depth regarding statistic tables and system catalogs:
- The Statistics Collector: http://www.postgresql.org/docs/9.3/static/monitoring-stats.html
- pg_stat_statements: http://www.postgresql.org/docs/9.3/static/pgstatstatements.html
- pg_class: http://www.postgresql.org/docs/9.3/static/catalog-pgclass.html