
When monitoring multiple clusters of servers, we need a data collection method that's both scalable and configurable. The collectd daemon is a scalable statistics-gathering service, perfect for large clusters as it operates on a client-server model. A common collectd cluster may look like this, with collectd running on every server:
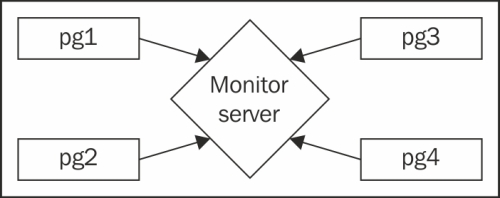
We can direct the statistics of several PostgreSQL servers to a central aggregate server. This server may process the data directly or forward it to a graph system for easy visualization. To gain this type of functionality, we need to spend some time installing and configuring collectd.
For the sake of completeness, obtain a copy of the latest collectd source code. At the time of writing this book, the latest version is 5.4.1, released on January 26, 2014. Obtain the latest copy of the collectd source code from http://collectd.org/download.shtml.
In order for collectd to interface with PostgreSQL, we need PostgreSQL development libraries in addition to the normally installed system binaries. For example, to build properly on a Debian-based system, we would also need to install libraries by executing this on the command line:
sudo apt-get install postgresql-server-dev-9.3
Red-Hat-based systems can sometimes lag behind, so we suggest that you obtain the postgresql93-libs package from http://yum.postgresql.org/rpmchart.php.
Later, we simply need a root-capable user to install collectd as a system-wide service.
Tip
Some companies have policies that disallow development tools from being installed on production hardware. If this is the case in your company, it may be necessary to use a staging or development server for these steps. Once the binaries are available, they should be deployed to the production system following the standard deployment protocol. This applies to all the recipes that call for development libraries.
Assume that we have a monitor server named mon1 and a PostgreSQL server named pg1. Follow these steps on both servers unless notified otherwise:
- Use these commands to extract the collectd source and enter the source directory:
tar -xzf collectd-5.4.1.tar.gz
cd collectd-5.4.1/
- Next, build and install the actual software with these commands:
./configure --sysconfdir=/etc/collectd
make
sudo make install
- Copy the
init/collectdinitialization script from the source code provided with this chapter, into the/etc/init.ddirectory on the server. - Change the copied initialization script to make it executable with this command:
sudo chmod a+x /etc/init.d/collectd - In the
/etc/collectddirectory, create a file namedcollectd.confwith the following contents:PIDFile "/var/run/collectd.pid" LoadPlugin load LoadPlugin syslog Include "/etc/collectd/network.conf" Include "/etc/collectd/local.conf"
- On the
mon1server only, create a file namednetwork.confin the/etc/collectddirectory with the following contents:LoadPlugin network <Plugin network> Listen "*" "25826" </Plugin>
- On the
pg1server only, create a file namednetwork.confin the/etc/collectddirectory with the following contents:LoadPlugin network <Plugin network> Server "192.168.56.10" "25826" </Plugin>
- On the
mon1server only, create a file namedlocal.confin the/etc/collectddirectory with the following contents:LoadPlugin csv <Plugin csv> DataDir "/tmp/collectd" </Plugin> - Then, add the service to the system startup and shutdown process:
- Finally, start the collectd service on both servers:
sudo service collectd start
Our initial steps focus mainly on extracting and building the collectd source. We pass one parameter to the configure script to set the configuration file's location and leave the rest at their defaults.
Our next steps involve copying the provided initialization script into the server's /etc/init.d directory to start and stop collectd. While there are several contributed scripts and configurations in the contrib directory of the collectd source code, ours will work with almost any Linux distribution.
Once collectd is installed, we need to configure it. The provided configuration file is a good example, but we need something simpler. The collectd.conf file we created is enough to ensure that collectd starts and operates as expected. We included two other configuration files as well so that we can share multiple configuration files on several servers.
The first of these is network.conf. This file should contain network-related collectd settings. In our particular example, the monitor server is configured to Listen, while our PostgreSQL server sends data to a collectd Server.
For the sake of demonstration, we configured the monitor server to store collected data to the /tmp/collectd directory in CSV format. We don't recommend this configuration in a production environment, but it's safe to use for now. After adding collectd to the list of services on this server and starting it, both servers should be linked. How can we prove this?
On the monitoring server, we should see a file named after the current date in the /tmp/collectd/pg1/load/ directory. The file should contain one or more lines like this:
1392592062.376,0.000000,0.010000,0.050000
In this case, the load plugin we declared in the collectd.conf file provides data on system load. Using commas as separators, the first column is the Unix time in seconds, followed by an average of 1, 5, and 15 minutes. In the preceding example, the server is essentially idle.
As collectd works on a client-server model and has several collection plugins available, it also has a lot of documentation. Please use these links for more information:
- The collectd Documentation: http://collectd.org/documentation.shtml
- The collectd Manpage: http://collectd.org/documentation/manpages/collectd.conf.5.shtml