
Once Nagios is installed, it will automatically configure a few basic monitors directed toward its own server. If we click on the Hosts link in the web administration site, we are presented with this:
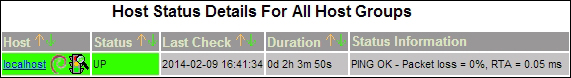
The local server is all that we are currently watching. This is useful to verify that Nagios is working as intended, but we need to monitor one or more database servers as well. In this recipe, we will learn how to watch external servers. By the end, we should see at least one more server listed by Nagios.
Initially, Nagios can only monitor remote servers by checking exposed services such as HTTP, FTP, or PostgreSQL. To check items such as CPU, RAM, or disk space, we need to rely on Nagios Remote Plugin Executor (NRPE) to forward system information to the monitoring server upon request. This means that NRPE must be installed on any server we want to monitor, including our PostgreSQL servers.
To install this on Debian-based servers, use the following command:
sudo apt-get install nagios-nrpe-server
Red Hat derivatives will need to use this command:
sudo yum install nrpe
Next, open /etc/nagios/nrpe.cfg and change the allowed_hosts setting to include the IP address or hostname of the monitor server. If 192.168.56.5 is the monitor server, it should look like this:
allowed_hosts=192.168.56.5
Follow these steps on the monitoring system to watch the 192.168.56.10 server, which is the first node of our PostgreSQL cluster:
- Find the configuration directory for Nagios:
- Debian-based servers should use this path:
/etc/nagios3/conf.d - Red-Hat-based servers should use this path:
/etc/nagios/objects
- Debian-based servers should use this path:
- As a root-level user, create a file named
db_conf.cfgin the preceding path. - In the
db_conf.cfgfile, define ahostgroupentry by adding this text:define hostgroup { hostgroup_name pg-servers alias PostgreSQL Servers } - In the
db_conf.cfgfile, define ahostentry by adding this text:define host { use generic-host host_name pg-1 alias PostgreSQL Node 1 address 192.168.56.10 hostgroups pg-servers } - In the
db_conf.cfgfile, define aserviceentry by adding this text:define service { use generic-service hostgroup_name pg-servers service_description Current Load check_command check_nrpe_1arg!check_load } - Red-Hat-based systems should modify
commands.cfgin/etc/nagios/objects/to include the following code:define command { command_name check_nrpe_1arg command_line $USER1$/check_nrpe -H $HOSTADDRESS$ -c $ARG1$ } - Reload the Nagios configuration files:
- Debian-based servers should use this command:
sudo service nagios3 reload - Red-Hat-based servers should use this command:
sudo service nagios reload
- Debian-based servers should use this command:
This recipe has a lot of moving parts, but it merely looks more complicated than it really is. We begin by locating the directory where supplementary configuration files are stored. Once this is located, we can create an entry to watch our PostgreSQL servers. To do this, we create a file named db_conf.cfg.
The order of the elements that we are creating does not matter; Nagios has a very advanced parser that checks configuration entries all at once. Knowing this, we feel it's logical to begin with the PostgreSQL hostgroup so that we have a way of grouping all of our database servers together. Once this is defined, we can create dozens or hundreds of PostgreSQL servers and apply the same checks to all of them.
The second entry we create in our db_conf.cfg file tells Nagios that this is a host it should monitor. Unless told otherwise, Nagios will ping this server to ensure that it's online, and this will be the only check until we configure more.
The meaning of the use line is probably not obvious. Nagios has several requirements to define a configuration entry. Instead of copying the same settings over and over again, we can create a template and then use it later. In this case, Nagios comes preconfigured with several basic templates, and we're making use of one for our newly created hosts.
The next entry we create in db_conf.cfg is a service we want to check. In this case, we are going to take advantage of NRPE to obtain the current system load. By setting hostgroup-name to pg-servers, Nagios will check the system load on all PostgreSQL servers; there's no need to create a service entry for each host.
The check-command is probably somewhat opaque as well. Every service requires a command to execute. Commands are defined like other Nagios objects and must be named for reference. The check_nrpe_1arg command is defined elsewhere, and we're using it here. Nagios separates commands from their parameters with an exclamation point. Therefore, in this example, we're invoking NRPE to check the system load on the remote server.
Red-Hat-based systems don't have a Nagios command named check_nrpe_1arg, so we create this one manually on those servers. With the newly defined command block, Nagios will use NRPE whenever the services invoke check_nrpe_1arg.
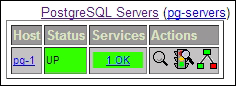
Finally, we tell Nagios to reload its configuration files. This causes Nagios to reread all configuration files, including the one we created. If everything goes well, clicking on Host Groups in the web interface should produce this summary:
Wait a minute! We never added a check for PostgreSQL itself! As we can't allow PostgreSQL to remain unmonitored, create a user on our PostgreSQL server with the following command:
CREATE USER nagios;
Then, make an entry in the pg_hba.conf file to allow trusted checks from the monitoring server with this line:
host template1 nagios 192.168.56.5/32 trust
Then, reload the PostgreSQL configuration with this command :
pg_ctl -D $PGDATA reload
Next, add a service entry to our db_conf.cfg file like this:
define service {
use generic-service
hostgroup_name pg-servers
service_description PostgreSQL Status
check_command check_pgsql
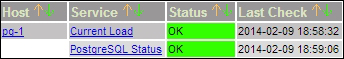
}After reloading our Nagios configuration files, click on the Services link in the web interface. It should now list two monitored services for the pg-1 server as seen here:
- Nagios configuration objects are fairly complicated. To use them properly, we strongly suggest that you browse the Nagios object manual located at http://nagios.sourceforge.net/docs/3_0/objectdefinitions.html.