The Graphite interface introduces several extensive capabilities. In order to use its complete functionality, we must log in. After doing so, we can save graphs, delete saved graphs, load graphs that other users have created and customized, and much more.
This recipe will take you through the interface to create a graph, save it, and load it later. Finally, we can avoid extremely technical discussions for a while!
In this recipe, we will be combining the results of all the previous recipes related to collectd and Graphite. We recommend that you have a functional monitor server configured, as discussed in those recipes.
When we installed and configured Graphite, it should have asked for a username and password for the primary administrative user. This information will be necessary to log in to the interface.
Follow these instructions to build, save, and load a saved graph:
- Direct a web browser at the monitor server on port 8080.
- Click on the Login link located at the top of the page.
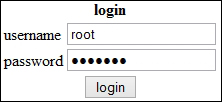
- Enter the username and password as requested, and click on login.
- Click on the Graphite link on the left pane.
- Click on the collectd link on the left pane.
- Click on the name of the server you wish to view.
- Continue by clicking on postgresql, Production, and then on derive.
- Select the item corresponding to a busy database or default to TPS-postgres.
- Select another item from the derive list so that both data points are in the same graph.
- Click on the save icon shaped like a floppy disk, and name this graph. We suggest that you name it
Production TPS. - Reload the browser window to clear out any selections.
- Click on My Graphs on the left pane.
- Choose the
Production TPSgraph.
Regular guest users can view graphs, but they cannot save views for later. When we installed Graphite, it created a default user, probably named root. For now, we can use this for demonstration purposes. The login screen is very terse:
Once we have logged into Graphite, we are free to build a graph. When we click on a link on the left pane, we expand its contents. Every expanded section leads to a list of one or more further sections. As such, we keep clicking on them until we reach items that can be represented on the graph pane. The data we are interested in is being supplied by collectd, so we start with it after expanding the Graphite section.
We recommended that you select two data series for two reasons. First, it shows that multiple data points can exist in the same graph. Secondly, we believe that saving a graph with only one data point is boring. After the two data points are activated, our interface should look like this:
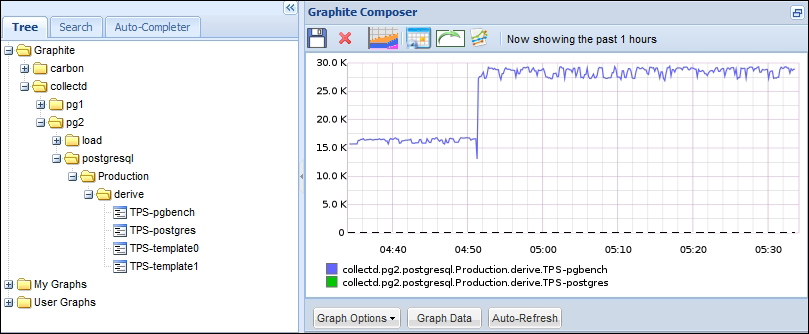
The active line through the graph represents the pgbench database in our test system, and it is quite busy. The dashed line at the bottom of the graph is the postgres database, which nobody uses, and it is zero for the duration of our view window. Regardless of the contents, we save this graph so that we can load it again later.
After we reload the browser window and expand the My Graphs link, we should see the graph that we just saved:
Click on the Production TPS chart, and it should load on the right pane automatically.
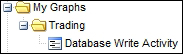
Graphite groups the items that contain a period anywhere in their names. We suggest that you develop a naming scheme to take advantage of this. A good naming scheme should incorporate the environment and a descriptive explanation of the graph's contents. If we used Trading | Database Write Activity, our saved graphs would look like this: