
You can configure many properties for the SOA infrastructure, such as Audit Level, Payload Validation, UDDI Registry, JNDI Data Source, Binding Properties, and so on.
When these properties set, they impact all deployed SOA composite applications.
While you are testing the process and things are not working as expected such as process instance takes the wrong branch or the approval flow is not that which you were expecting, then you can debug the process by setting the Audit Level to Development. Setting the Audit Level is carried out in Enterprise Manager. First, you set Audit Level to Development mode, and then initiate a new process instance in the Business Process workspace to witness the effect of this change in debugging.
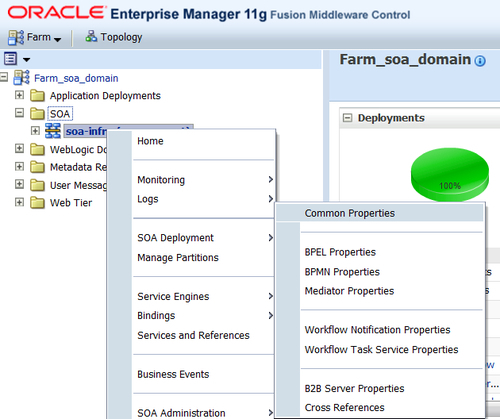
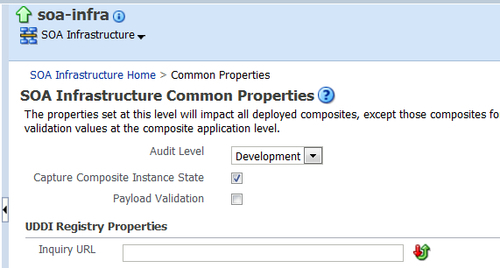
- Go to the Enterprise Manager console | soa-infra | SOA Administration and click on Common Properties. This will set the Audit Level to the Development mode.
- Also, check Capture Composite Instance State.
- Log in to Oracle BPM workspace with the salesrepresentative credentials and reinitiate the process instance by following the steps in the Testing process: Triggering the process section of Chapter 3, Process Deployment and Testing.
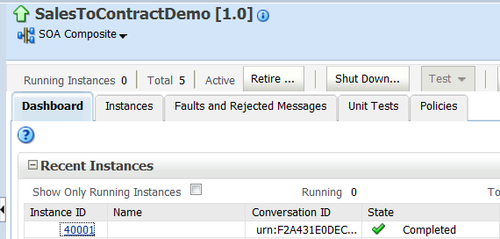
- You can find that a new instance is created in the Enterprise Manager console. Click on the given Instance ID.
- In the Trace section, click on the process name SalesToContract.
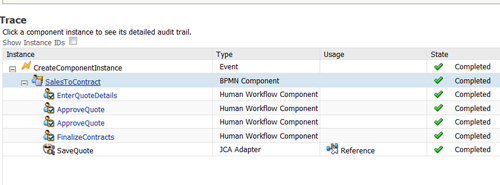
- In the Audit Trail tab, you will find that the blue links are clickable and display data values at that particular point in the process.
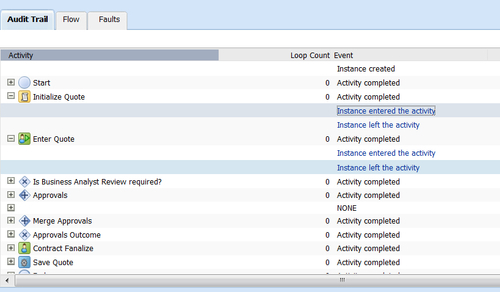
- Click on Instance entered the activity for the Enter Quote task, and you can find the data associated with the activity.
How it works...
Development mode makes available far more of these data value links, which is why it is so useful for debugging. Setting Audit Level to Development enables both composite tracking and payload details tracking. This option provides for separate tracking of the running instances. All instances are captured as either running or not running.
Note
You can enable the validation of incoming and outgoing messages. Non-schema compliant payload data is intercepted and displayed as a fault.
Also, the capture instance state flag should have these values only in development and testing environments, as they seriously affect the overall performance of the infrastructure.
There's more...
You can use the following method to set logging levels for troubleshooting.
To make troubleshooting simple, it is recommended that you set logging levels to the TRACE:32 FINEST level in Oracle Enterprise Manager Fusion Middleware Control. To set logging levels for troubleshooting:
- Log in to the Enterprise Manager console with the WebLogic user.
- Right-click on SOA infrastructure.
- Select Logs | Logs Configuration.
- From the Oracle Diagnostic Logging Level list, set the parent loggers to the TRACE: 32 FINEST level.