You will analyze the simulation results. Based on the analysis of the simulation results, the as-is Sales Quote process model is used as a starting point to produce the to-be Sales Quote process model. Simulation of the to-be Sales Quote process model helps to determine the benefits of the changes.
You can display results in either charts or as an log file, too. With charts, you can select the type of chart, such as Bar, Column, Table, and so on, to display the results. You have the choice to select which activities you want to analyze and what parameters you want to focus on, too.
In this section, you will analyze the simulation result to produce a to-be process, with the following steps:
- Double-click the Simulations window to bring it to full view mode.
- Next, you can chose the unit's indicator, as shown, and select Only Current Queue Size and Completed Instances:
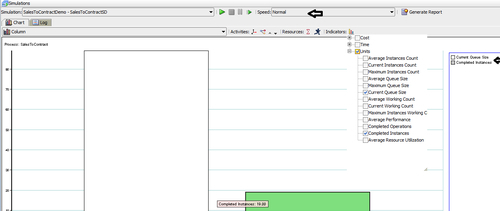
- You will find that Current Queue Size is greater than Completed Instance Size. This indicates that Queue Size is more.
- Now, you can analyze the time required for processing the process.
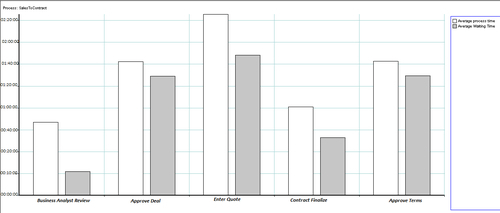
- Click on Indicators, choose Time, and select Average Waiting Time and Average process time.
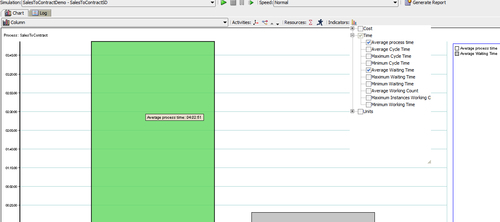
- It shows that Average process time is more than four hours and waiting time is also high.
- Click on Activities and select the activities Enter Quote, Approve Deal, Approve Terms, Finalize Contract, and Business Analyst Review, for which you want to analyze the processing time, as shown in the following screenshot:
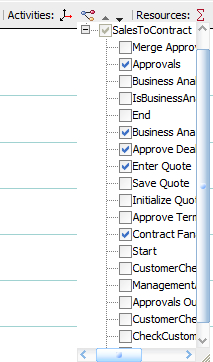
- You will find that Average process time for all major activities is quite high, and even the waiting time is high.
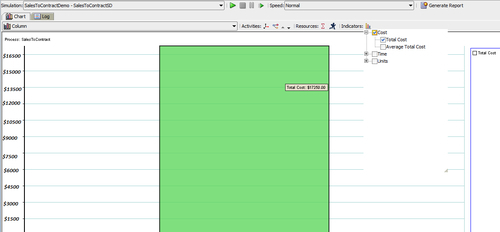
- Go to Indicators and tick Total Cost.
- You will find that the total cost comes to $17250, which is the cost to run this process for a day.
|
Process |
Units |
Time |
Cost |
|---|---|---|---|
|
SalesToContract |
Current Queue Size = 89 |
Average Processing Time- 4 hrs 30 min |
$17250 |
In this section, you will learn to create a Simulation Report.
- In the Simulation window, click on the Generate Documentation button, which will generate reports for this simulation run. The Simulation Report dialog opens.
- In the Directory Location field, enter a directory to store the report or click the button next to it to browse the file system and select a directory.
- In the Activities tab, select the option Summary
- In the tree below it, select the activities to include in the report. You can specify which activities to include, such as the ones you have selected for analyzing the results Enter Quote, Approve Deal, Approve terms, Business Analyst Review, and Finalize Contracts.
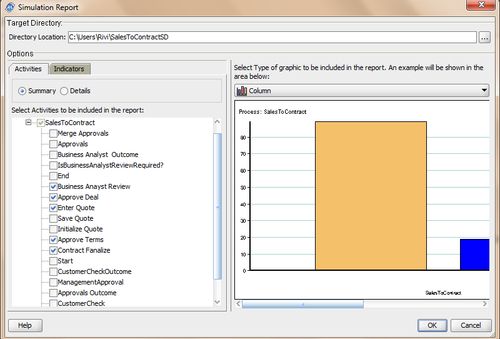
- Select Column as the chart type.
- Click OK.
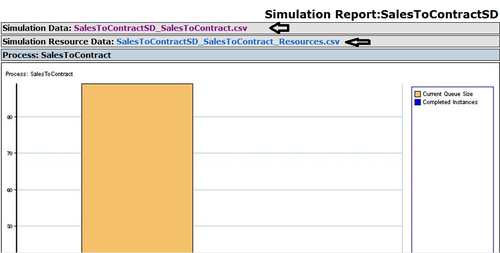
You will find that a directory is created using the name and location you have provided and that it contains an HTML file, as shown in the following screenshot. This graphically shows the simulation result and has a link to CSV files that have simulation data and simulation resource data.