In the previous chapter, you were introduced to symbols, which allow you to take greater control of your wireframes. In this chapter, we will continue to build on that theme as we introduce data tables into your wireframe design, turning data into useful, interactive, and engaging experiences for our end users.
The following list shows what we will cover in this chapter:
- Data tables
- Formatting data
- Deciphering the data
- Data table tips
- Wireframe project revisited
- Even more tips
For many Internet users, data tables can seem like the online equivalent of Excel spreadsheets. They are often dull, hard to read, and more often than not full of useful data that users want and need in order to do their jobs more effectively.
Yes, data tables are actually very useful tools for relaying information to users. But like Excel, data tables can go unnoticed and ignored simply because they are not formatted with the end user in mind.
But, building data tables does not have to be a dull or complicated experience. In fact, it can, and should, be an interactive one where users not only get the information they need, but where they can also take action on the data, making it more useful to them as a result.
Now, before we dig any deeper, let's start with the basics. Perform the following steps:
- Open
project_mockup_4.bmml.If you have been following along up until this point in the book, the canvas should already have a header and footer in place. If not, please add them.
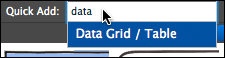
- In the Quick Add search field, type the word
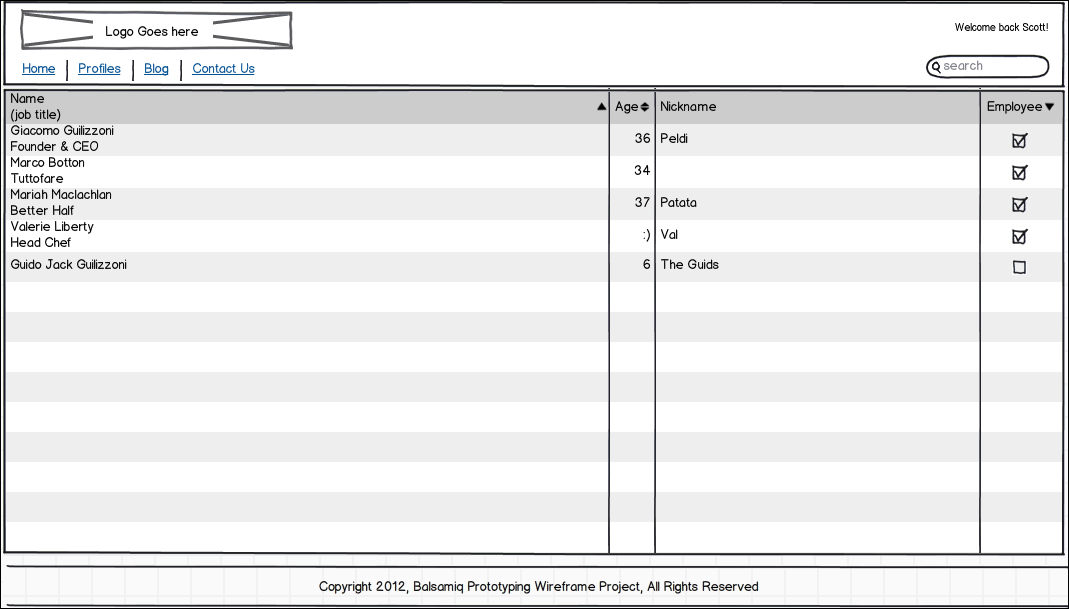
data. - Select Data Grid/Table, as shown in the following screenshot:
Once selected, a data table will appear on the canvas.
Let's position the data table and change its size.
- Set Size:
1062x468. - Set Pos:
79,100.