
Before we get into the details of the data, let's take a moment to review the basic data table structure.
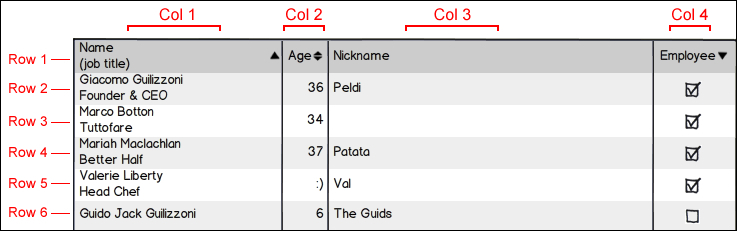
If you are not familiar with using data tables, there are two important things to remember: rows run top to bottom and columns run left to right, as shown in the following screenshot:
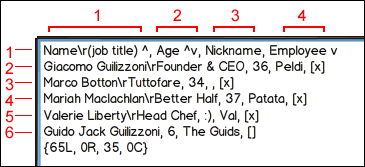
While it is a bit hard to see in edit mode, the rows and columns are still there. You just have to know how to look for them, as shown in the following screenshot:
In edit mode, creating columns is as simple as adding commas between words, as shown in the following screenshot:
Removing columns is just as easy. Simply delete the commas.
Pressing Return/Enter on your keyboard creates rows. In Balsamiq, the very first row is automatically designated as the table header. You can recognize the header because it is more darkly shaded than the other rows, as shown in the following screenshot:
In addition to the text, you will also notice some odd looking symbols, such as , ^, [x], []. Don't be alarmed. Balsamiq uses these as unique, but effective ways of formatting the data, as shown in the following screenshot:
Let's take a closer look:
(
)
: Creates a line break(^)Shift + 6: Displays a sorting/filtering arrow, ascendingUsed only in the header; these are used to depict arrows normally used in data tables to toggle data from top to bottom.
(v): Displays a sorting/filtering arrow, descendingIt is similar to the previous symbol, but is downward facing.
[x]: Displays a checked form checkbox[]:Displays an unchecked form checkbox()Shift + 9 + Shift + 0: Displays an unselected radio button(o)Shift + 9 + o + Shift + 0: Displays a selected radio buttonTip
There may be times when you need to display large, comma delimited, numbers in your data table's columns. Since commas create columns, you must place a backslash just after the number, followed by a comma. For example, if you wanted to display the numbers 1, 2, 3, you would type
1, 2, 3. 5,000 would be5,000, and so on.
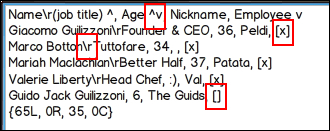
While the first row designates the data table header, the last row is reserved for controlling the width of your table's columns, the text alignment within them, and the number of columns, as shown in the following screenshot:
To understand how to use these correctly, there are some important things to remember such as the following:
- Your data table must be in the edit mode to use the number/letter functionality
- These numbers/letters must always go in the very last row in your data table
- All number/letter combinations must be placed in curly brackets
- Column width can be either relative or absolute
In Balsamiq, relative and absolute measurement is not perfect. However, you will find them to be more than adequate for the purposes of wireframing.
0is the smallest number you can use to control the width0is generally used to create very narrow column widths, often reserved for data that doesn't take up a lot of space, like zip codes, yes/no responses, checkboxes, a person's age, and so on.- Letters next to numbers assign the text alignment
Tip
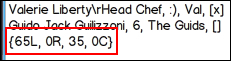
In our current data table example, {65L, 0R, 35, 0C}, the coordinates tell us that the table will have four columns. The first column is 65 percent wide with left-aligned text. The second coordinate creates a column as small as possible with right-aligned text. The third column is 35 percent wide with no text alignment assigned. The fourth coordinate creates a column as small as possible, but centers the text within it. Omitting an alignment setting, as in column three, will default its text to be left-aligned.
Lastly, single digits control the relative width. For example, {2L, 1R}
will create two columns, the first, 2L, being twice as big as the second with left-aligned text. The second column, 1R, is half the width of the first column with right-aligned text.
If you choose not to supply a letter alongside a width coordinate, you can still control its alignment using the Text alignment tool in the Property Inspector. Just note that any columns not formally assigned a letter will all move in the same direction when using this tool.
All that sounds like quite a lot to remember, but once you start using these data table controls and coordinates regularly, you will find them to be quite intuitive.