When designing a wireframe, you want your design to be as close to real life as possible. Although wireframes have their limitations, Balsamiq offers a few tricks that allow you to do just that.
Use this feature when you want to show a data table row as being selected.
Perform the following steps:
- Click on the data table to make it active.
- In the Property Inspector, locate the Selection menu, as shown in the following screenshot:
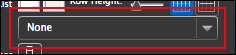
- Click the arrow on the right to expose a list of every row in your data table.
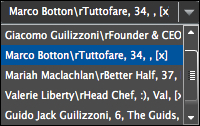
- Select one of the rows, as shown in the following screenshot:
- Deselect the data table and see the results, as shown in the following screenshot:
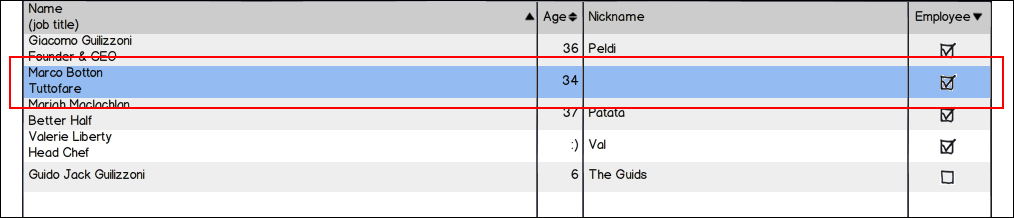
The row you selected is now highlighted. You will notice this functionality in most online forms and now you can depict it directly in your wireframes. It is very useful.
Scroll bars are used to display large amounts of data on a single page. This can come in handy when you want to keep the user's focus on the current page, while still being able to show multiple pages of data.
To add a scroll bar, perform the following steps:
- Click on the data table to activate the Property Inspector.
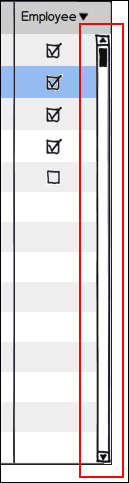
- Click on the Scrollbar tool, as shown in the following screenshot:

Once clicked, a scroll bar will appear on your data table. While not interactive, this added piece of wireframe functionality helps to set expectations for the viewer as to how this bit of functionality will work in real life. For most wireframes, that's often good enough.