Gaseous Emissions and the Environment
Abstract
Human activity creates a stress on the environment. Land, air, and water are inundated with the detrimental effects of industry. Air has received more attention and publicity than land and water in terms of the pollution it suffers. Besides, air pollution at some point affects land and water, either directly or indirectly. In the interests of brevity, this chapter will deal mostly with air pollution. Separate standards exist, for instance, for legislating the water effluent from power stations. Gas turbines running at optimal emissions status tend to have TIT profiles and internal air cooling that promote the best TBOs and component longevity, particularly in the hot section. If TITs or temperatures anywhere within the gas turbine increase over optimum design settings (due to blockage or partial blockage in any of the modules), component lives and emissions are adversely affected. Thus engineers, especially those who have considerable field and overhaul experience, frequently concur that environmental emissions-lowering technologies mean better turbine component lives, as they lead to the engine operating cooler (than it would without the technologies in question for a given power setting).
Keywords
Gaseous emissions; pollution; TIT profiles; emissions-lowering technologies; carbon capture
“Normal people . . . believe that if it ain’t broke, don’t fix it. Engineers believe that if it ain’t broke, it doesn’t have enough features yet.”
—Scott Adams, The Dilbert Principle
Human activity1 creates a stress on the environment. Land, air, and water are inundated with the detrimental effects of industry. Air has received more attention and publicity than land and water in terms of the pollution it suffers. Besides, air pollution at some point affects land and water, either directly or indirectly. In the interests of brevity, this chapter will deal mostly with air pollution. Separate standards exist, for instance, for legislating the water effluent from power stations.
Gas turbines running at optimal emissions status tend to have TIT profiles and internal air cooling that promote the best TBOs and component longevity, particularly in the hot section. If TITs or temperatures anywhere within the gas turbine increase over optimum design settings (due to blockage or partial blockage in any of the modules), component lives and emissions are adversely affected. Thus engineers, especially those who have considerable field and overhaul experience, frequently concur that environmental emissions-lowering technologies mean better turbine component lives, as they lead to the engine operating cooler (than it would without the technologies in question for a given power setting).
As noted in Chapter 4 on gas turbine components, high temperature promotes the formation of NOx emissions. When NOx emissions rise, so do other emissions. When TITs rise, the potential for hot section wear, due in part to elevated temperatures, rises. Less hot section wear generally means longer TBOs and reduced costs per fired hour.
Gaseous Emissions
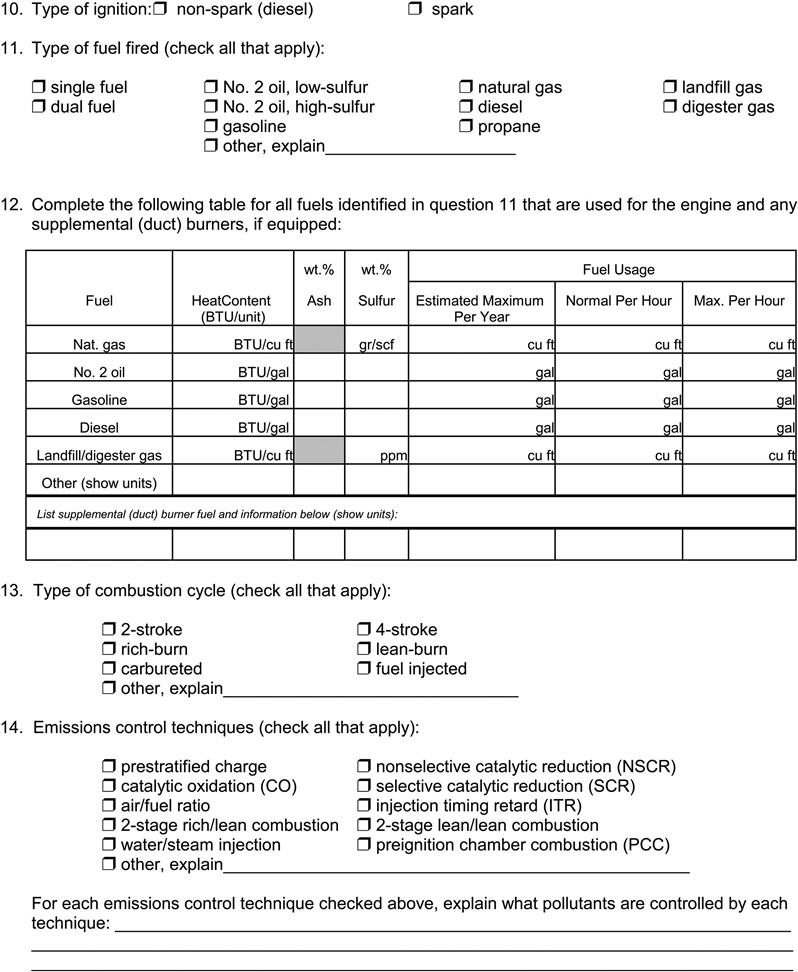
Traditionally, Europeans tend to be more environmentally proactive than people in the United States, except in the case of California. This is now changing as the United States realizes that the global warming “myth” is part of worldwide climate change, escalating formation of deserts and drought trends, increasingly felt by the United States. Countries like Canada, Australia, and New Zealand like to be environmentally conscious countries and work with the EU and the USA in information sharing agreements. New partnerships are formed increasingly. The USA and China now have an agreement to work together on CSS.
Environmental consciousness is growing overseas as well. India had considerable success with its tree planting program (for CO2 absorption purposes). This is a similar initiative to New Zealand’s calculations when building the Stratford station which led to a mandate that the station’s builders plant several acres of forest to absorb the increased CO2 emissions.
Brazil has instigated a sugar cane ethanol fuel program that has made the country energy independent and helped reduce its emissions, were it to use some of the cheaper alternatives to clean oil and gas. These alternatives used by countries poor in clean fossil fuels include residual or bunker oil.
It is a physical fact that CO2 does not proceed past the stratosphere and that it absorbs heat. One can argue “how much CO2,” but that amount is increasing with human activity and CO2's properties include heat retention. As do methane’s, the chlorofluorocarbons once used as refrigerants (they still are around in many post-Communism economies), unburned hydrocarbons from gas turbine combustion, and a variety of other gases less abundant than CO2. Granted some of them, like natural gas (25 times worse in terms of trapping the free oxygen in stratospheric ozone), are more dangerous per unit weight, but they are vastly less abundant than CO2.
Also CO2 ppm by volume in the atmosphere has increased by several hundred percent in just a few decades. Trapped bubbles, representative of atmosphere at the time, in glacial cores that represent a few centuries' worth of atmosphere (and other things) prove that beyond any doubt. That rate is without precedent in the planet’s history and there is no prior experience for where these trends may go.
As the industrial world continues to develop, storms become more severe, sea levels rise, entire species and human cultures are poised on the brink of extinction. The clearest evidence for global warming appears to be in the Arctic.
It is equally true that some areas of the world are growing colder (like parts of Labrador and northern Europe) and other areas of the world are growing ominously hotter, in some cases drier. What was permafrost beneath the supports of the Alaskan pipeline is becoming muskeg. True, engineers there can swiftly ensure that, with refrigeration coils or similar technology, the supports will not bend, that is, bend enough to contribute to the pollution from leaking oil pipelines (whose pervasive silent onslaught way exceeds the pollution committed by the Exxon Valdes) globally.
If you can produce power by burning less carbon per unit of power, then you are more efficient in terms of conserving fossil reserves. If you can design gas turbines with cogeneration and waste-heat-recovery systems that:
• Cool inlet air to a gas turbine compressor, thereby increasing the air mass per unit volume available for combustion given any set of atmospheric conditions that is available for combustion, and thereby increasing the power production potential of a gas turbine for a given set of atmospheric conditions,
• Inject water or steam into a gas turbine increasing the power potential of that turbine for a given set of atmospheric conditions,
• Intercool air during the gas turbine’s compression process, thereby increasing the mass flow per unit volume of air exiting the compressor,
• Raise stoichiometric efficiency (reduce unburned hydrocarbons and “excess fuel” required) in gas turbine combustors,
• Reheat turbine products of combustion during the turbine expansion process,
• Collect the products of combustion (which include some unburned hydrocarbons), add another burst of fuel, and ignite the mixture to produce still more power (that is what pilots call an afterburner, but some power generation engineers do it too now and use different terminology),
• Use the “waste” heat in products of combustion to help keep a town’s population warm (combined heat and power) or help grow tomatoes in a greenhouse,
• Reinject the exhaust CO2 somewhere for the purpose of making something else (like oil) rise to the surface faster (without having to spend energy on just that process),
you are then using less fuel per unit of work or energy (rate of change of work) for which you can potentially earn tax credits or charge a tariff. You are more efficient, which ultimately means less pollution, of CO2 and everything else that fossil fuel contains.
Contemporary gas turbines are no longer limited to burning just gas or even LNG. They can burn gasified coal (either pulverized coal or coal “gas” from steam injection into a coal seam), paper production (“black liquor”) waste, flue gases from steel mills, petrochemical waste, and a host of nonconventional fuels. Several of these fuels will release a larger load of CO2 to the atmosphere when burned, so end users would be well advised to follow New Zealand’s Stratford station example.
If we compare the weight of carbon in unburned coal, oil, and methane gas (input-to-power-production-system basis), we see that the values of weight of carbon in kg/GJ are as follows:3
Coal = 90 to 100
Oil = 73 to 74
Gas = 50
If we compare the weight of carbon dioxide (output-from-power-production-system basis) resulting from combustion of coal, oil, and gas, we see that the values of carbon dioxide in kg/MW-hr are as follows:
Coal = 1000 to 1200
Oil = 750 to 850
Gas = 200 to 500
Even without commitment to treaties such as the Kyoto protocol, countries with a tradition of responsible environmental behavior continue to try to find ways to mitigate CO2 production. This can be at pre-combustion stages (design, legislation, taxes) or post-combustion (reinjection into rock, absorption by some means), which is generally more expensive.
Statoil’s work in this vein is summarized as a case at the end of this chapter. It provides interesting insight into what can be done to limit CO2 atmospheric emissions when a company values doing that.
The entire field of environmental emissions deserves and gets its own books and separate books on each subtopic. So this book deals with the main topics in general gas turbine operation that affect environmental emissions, as follows:
• Combustion chamber (CC) and low-NOx CC technology (see Chapter 4)
• Alternative fuels (see Chapter 7)
• Cycle modifications (see Chapters 3 and 10)
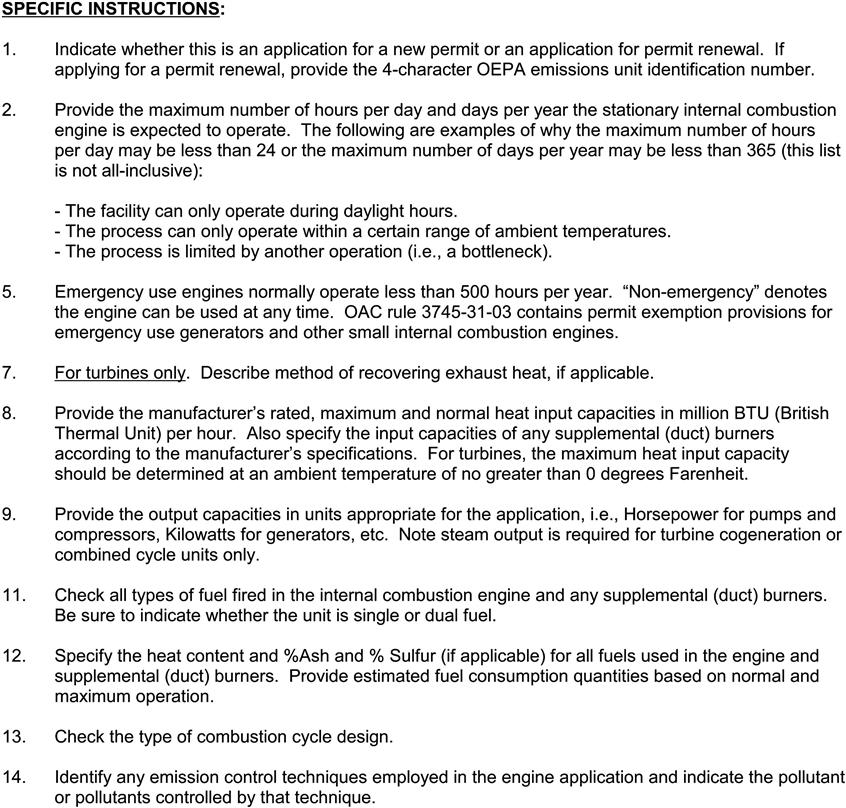
• Template for environmental emissions and permitting (this chapter)
Gas turbine operation intrinsically involves steam turbines, when in the combined-cycle mode. If supplementary fuel is involved to boost steam production, the emissions from those boiler processes are likely to be similar to those created by solo-steam turbine operation. Emissions that result will generally be higher (per unit weight of fuel) than emissions from gas turbines, regardless of what fuel the gas turbine uses. Depending on the quality of the coal used, SOx (oxides of sulfur) can be an issue.
The reader is asked to note that environmental affecting issues and implications occur in every facet of gas turbine technology either directly or indirectly. For instance, pulsation technology (see Chapter 9 on controls, instrumentation, and diagnostics) may pick up incipient failure in combustion liners, which in turn may have affected flame pattern, temperature distribution in the CCs, and therefore emissions produced (see Tables 11–1 to 11–9).
TABLE 11–1
Emission Factorsa for Nitrogen Oxides (NOx) and Carbon Monoxide (CO) from Stationary Gas Turbines
| Turbine Type | Nitrogen Oxides | Carbon Monoxide | ||
| Natural gas-fired turbinesb | (lb/MMBtu)c (fuel input) | Emission factor rating | (lb/MMBtu)c (fuel input) | Emission factor rating |
| Uncontrolled | 3.2 E-01 | A | 8.2 E-02d | A |
| Water-steam injection | 1.3 E-01 | A | 3.0 E-02 | A |
| Lean-premix | 9.9 E-02 | D | 1.5 E-02 | D |
| Distillate oil-fired turbinese | (lb/MMBtu)f (fuel input) | Emission factor rating | (lb/MMBtu)f (fuel input) | Emission factor rating |
| Uncontrolled | 8.8 E-01 | C | 3.3 E-03 | C |
| Water-steam injection | 2.4 E-01 | B | 7.6 E-02 | C |
| Landfill gas-fired turbinesg | (lb/MMBtu)h (fuel input) | Emission factor rating | (lb/MMBtu)h (fuel input) | Emission factor rating |
| Uncontrolled | 1.4 E-01 | A | 4.4 E-01 | A |
| Digester gas-fired turbinesj | (lb/MMBtu)k (fuel input) | Emission factor rating | (lb/MMBtu)k (fuel input) | Emission factor rating |
| Uncontrolled | 1.6 E-01 | D | 1.7 E-02 | D |
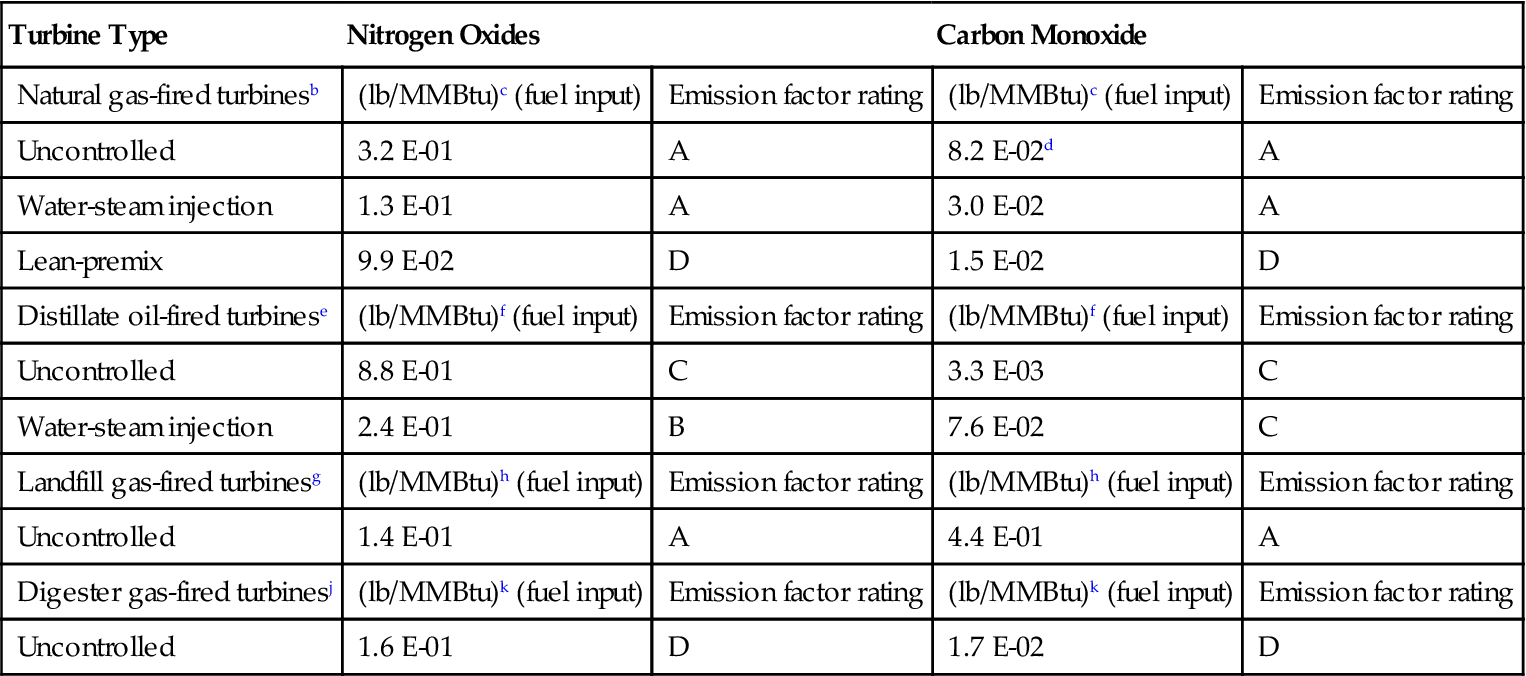
aFactors are derived from units operating at high loads (≥80% load) only. For information on units operating at other loads, consult the background report for this chapter, available at www.epa.gov/ttn/chief.
bSource classification codes (SCCs) for natural gas-fired turbines include 2-01-002-01, 2-02-002-01, 2-02-002-03, 2-03-002-02, and 2-03-002-03. The emission factors in this table may be converted to other natural gas heating values by multiplying the given emission factor by the ratio of the specified heating value to this average heating value.
cEmission factors based on an average natural gas heating value (HHV) of 1020 Btu/scf at 60°F. To convert from (lb/MMBtu) to (lb/106 scf), multiply by 1020.
dIt is recognized that the uncontrolled emission factor for CO is higher than the water-steam injection and lean-premix emission factors, which is contrary to expectation. The EPA could not identify the reason for this behavior, except that the data sets used for developing these factors are different.
eSCCs for distillate oil-fired turbines include 2-01-001-01, 2-02-001-01, 2-02-001-03, and 2-03-001-02.
fEmission factors based on an average distillate oil heating value of 139 MMBtu/103 gallons. To convert from (lb/MMBtu) to (lb/103 gallons), multiply by 139.
gSCC for landfill gas-fired turbines is 2-03-008-01.
hEmission factors based on an average landfill gas heating value of 400 Btu/scf at 60°F. To convert from (lb/MMBtu) to (lb/106 scf) multiply by 400.
jSCC for digester gas-fired turbine is 2-03-007-01.
kEmission factors based on an average digester gas heating value of 600 Btu/scf at 60°F. To convert from (lb/MMBtu) to (lb/106 scf) multiply by 600.
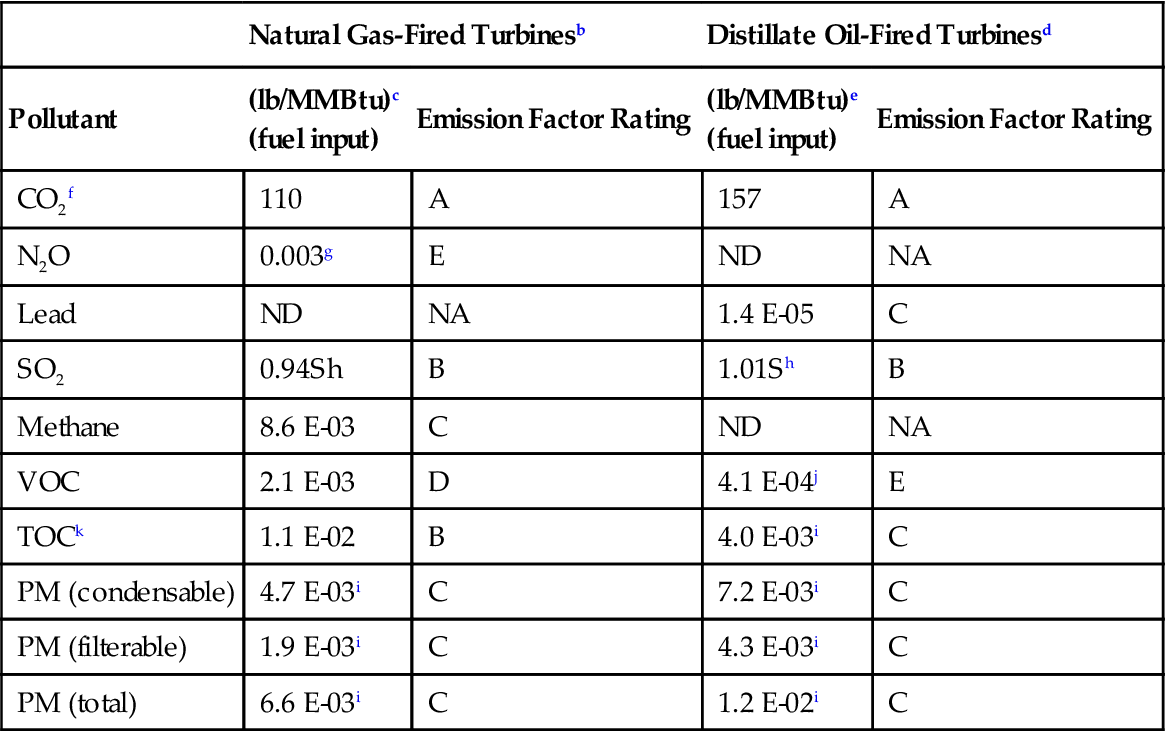
TABLE 11–2
Emission Factorsa (Uncontrolled) for Criteria Pollutants and Greenhouse Gases from Stationary Gas Turbines
| Natural Gas-Fired Turbinesb | Distillate Oil-Fired Turbinesd | |||
| Pollutant | (lb/MMBtu)c (fuel input) |
Emission Factor Rating | (lb/MMBtu)e (fuel input) |
Emission Factor Rating |
| CO2f | 110 | A | 157 | A |
| N2O | 0.003g | E | ND | NA |
| Lead | ND | NA | 1.4 E-05 | C |
| SO2 | 0.94Sh | B | 1.01Sh | B |
| Methane | 8.6 E-03 | C | ND | NA |
| VOC | 2.1 E-03 | D | 4.1 E-04j | E |
| TOCk | 1.1 E-02 | B | 4.0 E-03i | C |
| PM (condensable) | 4.7 E-03i | C | 7.2 E-03i | C |
| PM (filterable) | 1.9 E-03i | C | 4.3 E-03i | C |
| PM (total) | 6.6 E-03i | C | 1.2 E-02i | C |
aFactors are derived from units operating at high loads (≥80% load) only. For information on units operating at other loads, consult the background report for this chapter, available at www.epa.gov/ttn/chief. ND = no data, NA = Not applicable.
bSCCs for natural gas-fired turbines include 2-01-002-01, 2-02-002-01 & 03, and 2-03-002-02, and 03.
cEmission factors based on an average natural gas heating value (HHV) of 1020 Btu/scf at 60°F. To convert from (lb/MMBtu) to (lb/106 scf), multiply by 1020. Similarly, these emission factors can be converted to other natural gas heating values.
dSCCs for distillate oil-fired turbines are 2-01-001-01, 2-02-001-01, 2-02-001-03, and 2-03-001-02.
eEmission factors based on an average distillate oil heating value of 139 MMBtu/103 gallons. To convert from (lb/MMBtu) to (lb/103 gallons), multiply by 139.
fBased on 99.5% conversion of fuel carbon to CO2 for natural gas and 99% conversion of fuel carbon to CO2 for distillate oil. CO2 (natural gas) [lb/MMBtu] = (0.0036 scf/Btu)(%CON)(C)(D), where %CON = weight percent conversion of fuel carbon to CO2, C = carbon content of fuel by weight, and D = density of fuel. For natural gas, C is assumed at 75%, and D is assumed at 4.1 E+04 lb/106scf. For distillate oil, CO2 (distillate oil) [lb/MMBtu] = (26.4 gal/MMBtu) (%CON)(C)(D), where C is assumed at 87%, and the D is assumed at 6.9 lb/gallon.
gEmission factor is carried over from the previous revision to AP-42 (Supplement B, October 1996) and is based on limited source tests on a single turbine with water-steam injection (Reference 5).
hAll sulfur in the fuel is assumed to be converted to SO2. S = percent sulfur in fuel. Example, if sulfur content in the fuel is 3.4%, then S = 3.4. If S is not available, use 3.4 E-03 lb/MMBtu for natural gas turbines, and 3.3 E-02 lb/MMBtu for distillate oil turbines (the equations are more accurate).
iEmission factors are based on combustion turbines using water-steam injection.
jVOC emissions are assumed equal to the sum of organic emissions.
kPollutant referenced as THC in the gathered emission tests. It is assumed as TOC, because it is based on EPA Test Method 25A.
TABLE 11–3
Emission Factorsa (Uncontrolled) for Criteria Pollutants and Greenhouse Gases from Stationary Gas Turbines
| Landfill Gas-Fired Turbinesb | Digester Gas-Fired Turbinesd | |||
| Pollutants | (lb/MMBtu)c | Emission Factor Rating | (lb/MMBtu)e | Emission Factor Rating |
| CO2f | 50 | D | 27 | C |
| Lead | ND | NA | <3.4 E-06g | D |
| PM-10 | 2.3 E-02 | B | 1.2 E-02 | C |
| SO2 | 4.5 E-02 | C | 6.5 E-03 | D |
| VOCh | 1.3 E-02 | B | 5.8 E-03 | D |
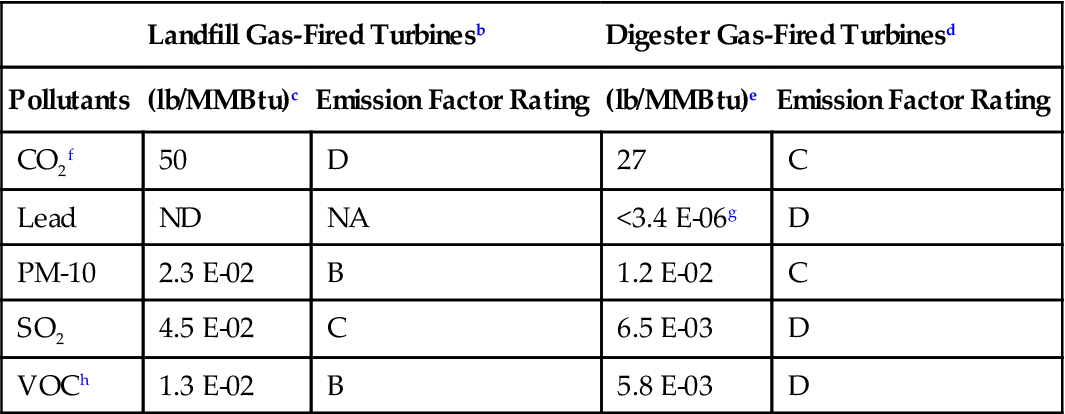
aFactors are derived from units operating at high loads (≥80% load) only. For information on units operating at other loads, consult the background report for this chapter, available at www.epa.gov/ttn/chief. ND = no data, NA = not applicable.
bSCC for landfill gas-fired turbines is 2-03-008-01.
cEmission factors based on an average landfill gas heating value (HHV) of 400 Btu/scf at 60°F. To convert from (lb/MMBtu) to (lb/106 scf), multiply by 400.
dSCC for digester gas-fired turbine include 2-03-007-01.
eEmission factors based on an average digester gas heating value of 600 Btu/scf at 60°F. To convert from (lb/MMBtu) to (lb/106 scf), multiply by 600.
fFor landfill gas and digester gas, CO2 is presented in test data as volume percent of the exhaust stream (4.0–4.5%).
gCompound was not detected. The presented emission value is based on one half of the detection limit.
hBased on adding the formaldehyde emissions to the NMHC.
TABLE 11–4
Emission Factors (Uncontrolled) for Hazardous Air Pollutants from Natural Gas-Fired Stationary Gas Turbinesa,b
| Pollutant | Emission Factor (lb/MMBtu)c | Emission Factor Rating |
| 1,3-Butadiened | <4.3 E-07 | D |
| Acetaldehyde | 4.0 E-05 | C |
| Acrolein | 6.4 E-06 | C |
| Benzenee | 1.2 E-05 | A |
| Ethylbenzene | 3.2 E-05 | C |
| Formaldehydef | 7.1 E-04 | A |
| Naphthalene | 1.3 E-06 | C |
| PAH | 2.2 E-06 | C |
| Propylene oxided | <2.9 E-05 | D |
| Toluene | 1.3 E-04 | C |
| Xylenes | 6.4 E-05 | C |
aSCC for natural gas-fired turbines include 2-01-002-01, 2-02-002-01, 2-02-002-03, 2-03-002-02, and 2-03-002-03. Hazardous air pollutants as defined in Section 112 (b) of the Clean Air Act.
bFactors are derived from units operating at high loads (≥80% load) only. For information on units operating at other loads, consult the background report for this chapter, available at www.epa.gov/ttn/chief.
cEmission factors based on an average natural gas heating value (HHV) of 1020 Btu/scf at 60°F. To convert from (lb/MMBtu) to (lb/106 scf), multiply by 1020. These emission factors can be converted to other natural gas heating values by multiplying the given emission factor by the ratio of the specified heating value to this heating value.
dCompound was not detected. The presented emission value is based on one half of the detection limit.
eBenzene with Sconox catalyst is 9.1 E-07, rating of D.
fFormaldehyde with Sconox catalyst is 2.0 E-05, rating of D.
TABLE 11–5
Emission Factors (Uncontrolled) for Hazardous Air Pollutants from Distillate Oil-Fired Stationary Gas Turbinesa,b
| Pollutant | Emission Factor (lb/MMBtu)c | Emission Factor Rating |
| 1,3-Butadiened | <1.6 E-05 | D |
| Benzene | 5.5 E-05 | C |
| Formaldehyde | 2.8 E-04 | B |
| Naphthalene | 3.5 E-05 | C |
| PAH | 4.0 E-05 | C |
aSCCs for distillate oil-fired turbines include 2-01-001-01, 2-02-001-01, 2-02-001-03, and 2-03-001-02. Hazardous air pollutants as defined in Section 112 (b) of the Clean Air Act.
bFactors are derived from units operating at high loads (≥80% load) only. For information on units operating at other loads, consult the background report for this chapter, available at www.epa.gov/ttn/chief.
cEmission factors based on an average distillate oil heating value (HHV) of 139 MMBtu/103 gallons. To convert from (lb/MMBtu) to (lb/103 gallons), multiply by 139.
dCompound was not detected. The presented emission value is based on one half of the detection limit.
TABLE 11–6
Emission Factors (Uncontrolled) for Metallic Hazardous Air Pollutants from Distillate Oil-Fired Stationary Gas Turbinesa,b
| Pollutant | Emission Factor (lb/MMBtu)c | Emission Factor Rating |
| Arsenicd | <1.1 E-05 | D |
| Berylliumd | <3.1 E-07 | D |
| Cadmium | 4.8 E-06 | D |
| Chromium | 1.1 E-05 | D |
| Lead | 1.4 E-05 | D |
| Manganese | 7.9 E-04 | D |
| Mercury | 1.2 E-06 | D |
| Nickeld | <4.6 E-06 | D |
| Seleniumd | <2.5 E-05 | D |
aSCCs for distillate oil-fired turbines include 2-01-001-01, 2-02-001-01, 2-02-001-03, and 2-03-001-02. Hazardous air pollutants as defined in Section 112 (b) of the Clean Air Act.
bFactors are derived from units operating at high loads (≥80% load) only. For information on units operating at other loads, consult the background report for this chapter, available at www.epa.gov/ttn/chief.
cEmission factors based on an average distillate oil heating value (HHV) of 139 MMBtu/103 gallons. To convert from (lb/MMBtu) to (lb/103 gallons), multiply by 139.
dCompound was not detected. The presented emission value is based on one half of the detection limit.
TABLE 11–7
Emission Factors (Uncontrolled) for Hazardous Air Pollutants from Landfill Gas-Fired Stationary Gas Turbinesa,b
| Pollutant | Emission Factor (lb/MMBtu)c | Emission Factor Rating |
| Acetonitriled | <1.2 E-05 | D |
| Benzene | 2.1 E-05 | B |
| Benzyl chlorided | <1.2 E-05 | D |
| Carbon tetrachlorided | <1.8 E-06 | D |
| Chlorobenzened | <2.9 E-06 | D |
| Chloroformd | <1.4 E-06 | D |
| Methylene chloride | 2.3 E-06 | D |
| Tetrachloroethylened | <2.5 E-06 | D |
| Toluene | 1.1 E-04 | B |
| Trichloroethylened | <1.9 E-06 | D |
| Vinyl chlorided | <1.6 E-06 | D |
| Xylenes | 3.1 E-05 | B |
aSCC for landfill gas-fired turbines is 2-03-008-01. Hazardous air pollutants as defined in Section 112 (b) of the Clean Air Act.
bFactors are derived from units operating at high loads (≥80% load) only. For information on units operating at other loads, consult the background report for this chapter, available at www.epa.gov/ttn/chief.
cEmission factors based on an average landfill gas heating value (HHV) of 400 Btu/scf at 60°F. To convert from (lb/MMBtu) to (lb/106 scf), multiply by 400.
dCompound was not detected. The presented emission value is based on one half of the detection limit.
TABLE 11–8
Emission Factors (Uncontrolled) for Hazardous Air Pollutants from Digester Gas-Fired Stationary Gas Turbinesa,b
| Pollutant | Emission Factor (lb/MMBtu)c | Emission Factor Ratings |
| 1,3-Butadiened | <9.8 E-06 | D |
| 1,4-Dichlorobenzened | <2.0 E-05 | D |
| Acetaldehyde | 5.3 E-05 | D |
| Carbon tetrachlorided | <2.0 E-05 | D |
| Chlorobenzened | <1.6 E-05 | D |
| Chloroformd | <1.7 E-05 | D |
| Ethylene dichlorided | <1.5 E-05 | D |
| Formaldehyde | 1.9 E-04 | D |
| Methylene chlorided | <1.3 E-05 | D |
| Tetrachloroethylened | <2.1 E-05 | D |
| Trichloroethylened | <1.8 E-05 | D |
| Vinyl chlorided | <3.6 E-05 | D |
| Vinylidene chlorided | <1.5 E-05 | D |
aSCC for digester gas-fired turbines is 2-03-007-01. Hazardous air pollutants as defined in Section 112 (b) of the Clean Air Act.
bFactors are derived from units operating at high loads (≥80% load) only. For information on units operating at other loads, consult the background report for this chapter, available at www.epa.gov/ttn/chief.
cEmission factors based on an average digester gas heating value (HHV) of 600 Btu/scf at 60°F. To convert from (lb/MMBtu) to (lb/106 scf), multiply by 600.
dCompound was not detected. The presented emission value is based on one half of the detection limit.
TABLE 11–9
Emission Factors (Uncontrolled) for Metallic Hazardous Air Pollutants from Digester Gas-Fired Stationary Gas Turbinesa,b
| Pollutant | Emission Factor (lb/MMBtu)c | Emission Factor Rating |
| Arsenicd | <2.3 E-06 | D |
| Cadmiumd | <5.8 E-07 | D |
| Chromiumd | <1.2 E-06 | D |
| Leadd | <3.4 E-06 | D |
| Nickel | 2.0 E-06 | D |
| Selenium | 1.1 E-05 | D |
aSCC for digester gas-fired turbines is 2-03-007-01. Hazardous air pollutants as defined in Section 112 (b) of the Clean Air Act.
bFactors are derived from units operating at high loads (≥80% load) only. For information on units operating at other loads, consult the background report for this chapter, available at www.epa.gov/ttn/chief.
cEmission factor based on an average digester gas heating value (HHV) of 600 Btu/scf at 60°F. To convert from (lb/MMBtu) to (lb/106 scf), multiply by 600.
dCompound was not detected. The presented emission value is based on one half of the detection limit.
Effects of Emissions on Aircraft Gas Turbine Engines
All gas turbines have to contend with the intake of emissions, solid, liquid or gaseous. The nature of these and their effect on the gas turbine will vary with the gas turbine’s application and physical site. Gas turbines offshore, for instance, ingest oil fumes offshore, which then provides a sticky “base” on which other airborne pollutants may stick. When offshore, for naval vessels, low flying craft (helicopters) and offshore platform gas turbines, salt ingestion can be an issue. In these applications, regular, even frequent online washing can help a great deal. Also the platform and marine vessels can also use inlet air filtration to help their problem. Gas turbines in the tropics may ingest huge hordes of insects (see the chapter on air filters) in their air filters requiring frequent filter element changes. In cold climates, air filtration has to reduce the possibility that ice may form in the gas turbine inlet.
However, aircraft gas turbines are particularly vulnerable to the increasing pollutants in the atmosphere. The extent of their problem will vary depending on their flight altitude and where in the world they fly. However, they do have a problem that requires some attention.
Consider, for instance, Iceland’s E15 volcano eruption in 2010, where ash often reached 30,000 feet. While no aircraft actually flew through the ash, airlines and related industries lost $5 billion with shutdowns and rerouting. An ASME IGTI panel convened in Vancouver in 2010 reached the consensus4 that 2 mg/cubic meter was a conservative upper limit for atmospheric volcanic ash density for safe jet aircraft flight.
Volcanoes aside, around five billion tons5 of dust and aerosol particles are emitted into the atmosphere, mainly due to natural processes. The dust from desert regions of the world averages 1.5 billion tons, the sand from the Sahara in Africa accounts for 60% of the sand.
Studies done by this reference used data from several hundred overhauls conducted by the MTU overhaul shop in Hannover, Germany. They found “the average MCpFH (maintenance costs per flight hour) of certain selected key customers vary by approx. 20 percent below and above the overall average. Operators with high activities in erosive areas have shown the highest negative cost variation. The combination of reduced durability and increased maintenance costs can raise the average MCpFH for engine maintenance for an average operator by between 35 and 50 percent.”
Emissions from Coal as a Fuel
The acceptance of the effect of human-activity-caused carbon dioxide emissions has been slower in some countries, even highly developed ones like the United States. There is still a school of thought that says that climate changes will happen humans or not. However, gas turbine engineers accept that if they burn less fuel, they save on fuel bill money and emissions. If they work in a country where emissions are taxed, they save more money. Some maintenance engineers realize that lower emissions in many cases means a cooler running engine, great component life and therefore reduced costs per fired hour. Especially in the world’s largest industry (power generation), lowering emissions was therefore always a bright idea, despite a political tendency to call Kyoto threatening because it “makes us uncompetitive” in both the USA and Australia.
The current gas supply boon (from fracking) notwithstanding, coal is still the world’s most plentiful fossil fuel. Renewables and smart grids (which make renewables easier to add to the power supply mix) notwithstanding, the global power demand growth is nothing short of a surge and everyone alive today will not live to see the death of fossil fuel use.
In the USA, fervent campaigns by organizations like the Sierra Club have literally forced some coal power plants to shut down. That in turn forced many coal miners out of work. The coal lobby may not be as strong as the gas and oil equivalents in Washington DC, but the loss of jobs during an already rough economy has resulted in proactivity in research areas that will benefit coal. The truth is that China, many countries in Asia, Europe, and Africa have already been proactive, within their means, for many decades already. However, the economic resources of the USA are always a great ally for the rest of the world to have.
Given that conventional coal plants are inefficient and give off twice as much CO2 as a GT natural gas plant, countries other than the USA had installed many supercritical steam plants. Supercritical steam teachnology has been around since the 1950s. However, now the US DOE is working on metallurgy that will accept steam that is over 700°C. This then takes us to ultra-supercritical (USC) and advanced USC steam plants, with consequential increases in efficiency.
The Europeans, particularly the Norwegians and Swedes, have actively researched and practiced CO2 sequestration. Statoil experience in this area is discussed later in this chapter. Now the USA is assigning resources to this field as well, most significantly in the FutureGen project in Illinois. One slated to employ IGCC technology, FutureGen will use oxycombustion that is expected to reduce emissions more than IGCC would. There are also plans to employ CO2 sequestration in this project.
Carbon Dioxide Sequestration6
Underground sequestration of CO2 presents technical, legal and public acceptance issues. Current demonstration project will require years of operation in order to determine the long-term impact in the injection process on the environment. Alternative methods are used to convert CO2 into minerals that can be reused or at least stored in a solid form.
The only storage technology that has reached the demonstration phase is geologic sequestration. Although geological storage is considered permanent, additional CO2 plume monitoring data are required to address the possibility of CO2 leakage. A question also remains as to who would be liable for the CO2 should a leak occur from a geologic storage site. Continuous research programs have been done into ways to store CO2 in solid phase as a carbonate that is permanent and has no chance of leakage. These technologies are not so energy intensive as those requiring the compression and transport of the elemental CO2. These technologies include a process that uses the CO2 to produce carbonates, permanently sequestering CO2 as environmentally benign carbonate materials.
Post-Combustion Capture
Post-combustion capture (PCC) of CO2 from flue gases can be done by various methods: distillation, membranes, adsorption, physical and chemical absorption. Absorption in chemical solvents, such as amine types, is a proven technology and in many applications performed consistently and reliable. It is used in natural gas sweetening and hydrogen production. The reaction between CO2 and amines offers currently the most cost-effective solution to directly obtain high purity CO2 The flue gases from the power plant are cooled and treated for reduction of particulates and SOx and NOx. Then the flue gases, boosted by a fan to overcome pressure drops in the system, pass through an absorber. A lean amine solution counter-currently interacts with the flue gases and absorbs the CO2. The clean flue gases continue to the stack. The CO2 rich amine solution is pumped into a stripper (regenerator) to separate the amine from the CO2. The energy to desorb the CO2 from the solution is provided by steam. The CO2- rich solution at the top of the stripper is condensed for water removal and the gaseous CO2 is sent for further drying and compression.
Post-Combustion Chilled Ammonia
Ammonia is the lowest form of amine. Like other amines, it can absorb CO2 at atmospheric pressure, but at a slower rate than that of MEA. The chilled ammonia system uses a CO2 absorber similar to SO2 absorbers and is designed to operate with slurry. The process requires the flue gas to be chilled to 35°F before entering the cleanup system. The cooled flue gas flows upwards in counter current to a slurry containing a mix of dissolved and suspended ammonium carbonate (AC) and ammonium bicarbonate (ABC). More than 90% of the CO2 from the flue gas is captured in the absorber. The CO2-rich spent ammonia is regenerated under pressure. This reduces the CO2 liquefaction compression energy requirement. The remaining low concentration of ammonia in the clean flue gas is captured by cold-water wash and returned to the absorber. The clean flue gas, which now contains mainly nitrogen, excess oxygen, and low concentration of CO2, flows to the stack.
Pre-Combustion Capture IGCC
The main advantage of IGCC pre-combustion CO2 capture is the fact that the amount of the fluid to be processed is much smaller than in the case of post-combustion for a coal-fired plant or a combined cycle. In the IGCC case only the syngas is treated, whereas in the PCC case the entire exhaust flue gas flow must be processed. For the oxygen blown IGCC, the syngas main components are hydrogen and carbon monoxide (CO) with some CO2, steam, N2 and traces of other elements. The raw syngas produced by the gasifier must be cleaned from contaminants including mercury, sulfur, and fluorides. The chemical processes, known commercially as Rectisol or Selexol, are capable of removing a certain amount of CO2. However, the actual conversion of the CO into CO2 and H2 occurs in a water shift process. In this process steam and syngas are mixed in the presence of a catalyst to covert the CO to CO2 in an exothermic reaction. The shift stage can be integrated into the process either before (sour shift) or after the sulfur removal (sweet shift) stage. The fuel to be burnt in the gas turbine is mainly H2 with additives.
Oxy-Combustion
In an oxy-combustion-based power plant, oxygen rather than air is used to combust fuel resulting in a highly pure carbon dioxide (CO2) exhaust that can be captured at relatively low cost and sequestered. Often, the oxygen is mixed with flue gas to regulate burning as well as achieve a high carbon dioxide level in the flue gas. In the case of Rankine steam cycle, the volume of flue gas leaving the boiler is considerably smaller than the conventional air-fired volume (explained by the fact that nitrogen in the air is not part of the flue gas and that the amount of flue gases is approximately 75% less for combustion with oxygen than with air) and consists primarily of carbon dioxide.
The process utilizes an air separation unit (ASU), a facility requiring high electricity consumption. To reduce the auxiliary load, new and less energy intensive oxygen separation technologies are in development, including ion transport membrane (ITM), oxygen transport membrane (OTM) and BOC’s ceramic auto thermal recovery (CAR) oxygen production process.
Oxy-combustion is also associated with other promising combined cycles involving gas and steam turbines. The Graz cycle and the semi-closed oxy-combustion combined cycle are two examples, which at the present time are under theoretical investigation. This oxy-combustion concept is applicable for a variety of fuels, including methane, syngas, or biomass gasification. In the Graz cycle the working fluid following the combustion process is a mixture of steam (approx. 75%) and CO2 (approx. 24%), with some small amounts of N2 and O2. The expected cycle efficiency is in the range of 50%. Pilot demonstration plants will be operational around 2015.
Post-Capture CO2 Treatment
An important aspect of post-capture CO2 processes is related to its compression or liquefaction in order to be transported to an underground storage place. This process is associated with large energy penalties. According to P. Baldwin (“Capturing CO2. Gas compression vs. liquefaction,” Power Magazine, May 2009), a typical 1000 MW coal-fired plant requires 120 MW of auxiliary power to produce the required compression needed.
CO2 Compression Issues
A typical CO2 processing system includes compression, dehydration, and purification/liquefaction. As mentioned above, this process is one of the major contributors to auxiliary power consumption and higher costs for the power plant. The compression process includes at least two compressors, intercoolers, water separators, dehydrators, and purifiers. The amount of impurities in the CO2 stream has a major impact on the process. The presence of H2O may decrease the amount of compression work, while the existence of N2, O2, and Ar may increase it. In the selection process, the intercooler temperature must be above the condensing temperature of the mixture. Additionally, CO2 compression equipment requires stainless steel construction due to the presence of water vapors and potential corrosion.
A discussion of turbo-machinery for the sequestration part of the plants would not be complete without mentioning CO2 compression technology. The major effort in this area is dedicated to identifying processes capable of reducing power consumption, which represents 40% of the auxiliary loads. In some cases it represents 8–12% of plant power output.
Other Methods of CO2 Sequestration
In order to find more economic solutions beside the sequestration and storage underground, several technologies have been developed that require less energy and offer an alternative solution to geological storage of CO2.
Brief Description of Technologies
SkyMine Process
SkyMine™ is a technology that converts CO2 from power plant flue gas into sodium bicarbonate (baking soda) suitable for long-term landfill storage. The process uses sodium hydroxide produced on site through seawater electrolysis to react with the CO2.
Hydrogen and chlorine are produced as byproducts of the seawater electrolysis that creates sodium hydroxide and may be sold as a revenue stream for the system. The developer claims that this process is capable of removing between 85% and 97% of the mercury, acid rain gases, and CO2 from the flue gases that pass through the system.
Figure 11–1 shows the schematic for the process. The CO2 enters a series of absorption chambers. Once inside, sodium hydroxide is injected (produced from electrolysis of NaCl in seawater) into the chambers. A chemical reaction takes place: CO2 + H2O + Nacl → NaHCO3 + H2 + Cl2.
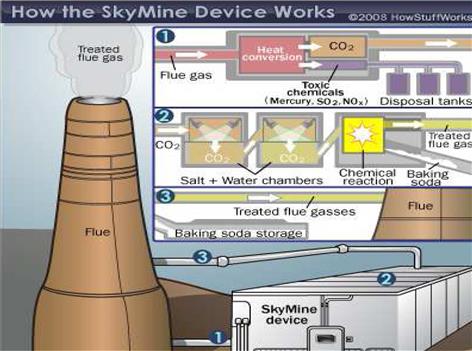
The sodium bicarbonate (baking soda) is in solid (crystalline) form, and the absorption chambers dump it into a storage area. The hydrogen and chlorine gases are stored separately from the baking soda. SkyMine then returns the remaining, mostly harmless, flue gases to the power plant, where they are released into the atmosphere. The reaction's main byproduct, sodium bicarbonate, is harmless and potentially useful commercially. However, the most practical way to deal with the byproduct is landfill disposal.
The Calera Process
The Calera process was originally designed to use a base to absorb CO2 to create calcium and magnesium carbonates as cement additive materials. One of them, seawater contains about 1290 ppm of magnesium and 410 ppm of calcium and other minerals. Calera’s research work has also included using base materials extracted from other sources such as fly ash from ash ponds or ash piles to make mineral carbonates.
Fly ash contains calcium oxide and magnesium oxides that, when mixed with water, form calcium and magnesium hydroxides. Hydroxides can be used to capture CO2 to form carbonates based on the following equation:
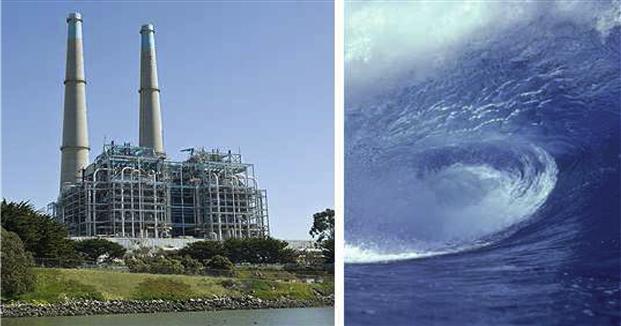
A 10 tpd pilot plant is located at the Moss Landing plant near Los Angeles (see Figure 11–2). A number of tests have been performed to test the reactivity of calcium oxide in waste fly ash.
The Calera process can have applications in the utility industry, at power plants where high quality fly ash materials are available. Note that the reactivity of waste fly ash with CO2 is slower than that of other reagents such as amine or ammonia, but waste fly ash is free in most cases. This process can be economical for some coal-based projects. Waste mineral piles including iron/steel slag, fly ash, and blast furnace and mine tailings containing mineral oxides that may be used to capture CO2 have been investigated by other process developers. Mine slime—water that is left over after a mining operation—has a high concentration of calcium and magnesium that can be used for carbonation reagents.
LLNL Seawater Carbonation Process
The Lawrence Livermore National Laboratory (LLNL) has developed a novel seawater scrubbing system using calcium carbonate to capture CO2. This reaction will result in the production of calcium bicarbonate according to the following equation. The resulting water-soluble calcium bicarbonate is then returned to sea, where it will provide necessary nutrients for marine life.
The process employs a reactor vessel that allows a CO2-rich flue gas stream to flow over or through a porous bed of limestone particles that are wetted by a continuous spray or flow of water. CO2 passes through the reactor to contact the water and wetted surfaces, forming carbonic acid, which in turn reacts with the carbonate solids (e.g., calcium carbonate) to produce bicarbonate HCO3 in solution.
When the calcium bicarbonate is returned to the sea, it will eventually decompose back to calcium carbonate and the absorbed CO2 will be released back to the seawater. However, due to the wide dispersion, the CO2 released can dissolve in the seawater and may not release to the atmosphere.
Silicate Mineral Carbonation
Calcium and magnesium carbonates form in nature during a process referred to as weathering of rocks. Although this reaction is exothermic and thermodynamically favored, it occurs very slowly over geologic time scales. In this process, calcium and magnesium ions are leached from rocks in the presence of water. The ions react with CO2, forming solid calcium and magnesium carbonates that are stable and can be disposed of as mine filler materials for long-term storage of the CO2. In theory, the metal oxides in the earth’s crust could permanently bind all CO2 that could be produced from the combustion of all existing fossil fuel reserves. The idea behind mineral carbonation is to find a way to speed up this natural weathering process so that CO2 from large point sources, such as fossil power plants, can be permanently stored.
Many institutions are studying ways to increase the reaction rate for mineral carbonation. Most involve some sort of pretreatment or grinding of the minerals, as well as increased pressures and temperatures in the reactor. Pretreatment alone, although it creates much faster kinetics by dissolving the mineral in solution, could result in as high as a 20% energy penalty to the plant, and grinding may have an even higher energy penalty. This penalty would be in addition to the energy penalty associated with capturing and transporting the CO2 to the mineral carbonation site.
Although mineral carbonation, unlike geologic sequestration, does not have the issue of leakage, it is not a completely environmentally benign sequestration option. Minerals need to be mined, and environmental impacts will be similar to those of coal mining.
Figure 11–3 is a process block flow diagram showing the potential route for using calcium silicate (CaSiO3) as CO2 sequestration material. Using a carbonation reactor at 30 bar pressure, calcium silicate and CO2 will combine to form CaCO3 using acetic acid (CH3COOH) as the reactant.

Algae Farming
Algae is the fastest-growing vegetation known. Based on recent tests at Arizona Public Service’s (APS’s) Redhawk station, the US Department of Energy (DOE) has estimated that a growth rate of about 70 metric tons per acre per year can be achieved. Algae cultivation methodologies under investigation include photo bioreactor, open pond, and closed loop system. Photo bioreactor employs nutrient-laden feedstock to grow algae such as carbonates or bicarbonates to supply the required CO2 for algae photosynthesis reaction. CO2 gas or flue gas can be sparged into the circulating water in lieu of using solid carbonates as its nutrient. Open pond methodology is more suitable for use in subtropical or tropical regions, where pond temperature variations are limited. The closed loop system prevents contact of air with algae-growing water and controls residual emissions from the algae farm.
When harvested, algae contain up to 50% moisture. Some algae species contain up to 40% lipid on a dry basis. Algae lipid can be processed into biodiesel, and the remaining material can be used to make methanol through fermentation. Algae can also be gasified into syngas, which can be used to make hydrocarbon liquid via the Fischer-Tropsch (FT) reactor process. The cost and land requirement for algae farming are expected to be high. DOE has awarded funds to APS to support its research and development in algae farming and processing technologies.
Case Study 1: The Capture, Storage, and Utilization of Carbon Dioxide by Statoil7
Climate Change
Carbon dioxide gas (CO2) is a natural, fluctuating component of the earth’s atmosphere and has been present throughout most of geological time. However, since the industrial revolution the concentration has risen by about a third (from 280–370 parts per million) and may well reach at least twice the preindustrial level by 2100. Most of this increase is attributed to the burning of carbon-rich fossil fuels—coal, natural gas, and oil—and is widely thought to be a contributory factor in trapping heat radiating from the earth’s surface. This, in turn, may lead to global warming—the greenhouse effect—and stimulate climate change. To what extent this may happen is not known; some say it will lead to disastrous consequences while others foresee relatively slight but noticeable variations. Either way, something has to be done about it. The obvious answer is to increase energy efficiency and rapidly convert to alternative energy sources, such as solar and wind power. But this is easier said than done. Switching to alternative sources will be a gradual process, because about 85% of the world’s present energy needs are being met by plentiful and relatively inexpensive fossil fuels. In contrast, non-fossil fuel energy sources are expensive, and onshore renewables need large land areas to produce even modest quantities of power (e.g., windmill parks).
A more pragmatic approach is to stabilize atmospheric concentrations gradually at or below 550 parts per million. But this too is an enormous challenge, requiring a 50% reduction in CO2 emissions from projected levels by 2050. New technologies are therefore needed to lower the cost of alternative energy sources, strengthen the removal and storage of CO2 from today’s fossil-fueled industries, and replace oil and coal by less carbon-intensive natural gas. Nevertheless, this is the more attractive proposition as it promises to allow present fossil-fuel industries and fossil-fuel-rich countries to continue operating profitably while giving time for alternative energy sources to realistically come to the fore.
Statoil and Climate Policy8
For Statoil the issue is not whether the world faces a climate problem or how severe it may be, but how harmful emissions may best be overcome. The Kyoto protocol is therefore acceptable as a good basis for a rational global policy, including the introduction of a broad-based system of emission trading,9 as long it is tied to Kyoto mechanisms. Statoil also cooperates widely with other companies and authorities and is a significant player in global affairs through its membership in the World Business Council for Sustainable Development, the Energy and Biodiversity Initiative (EBI), and bodies such as the IEA Greenhouse Gas R&D Programme and the IPIECA. At home our specialists keep abreast of the latest developments in scientific knowledge about the greenhouse effect and the social, economic, and competitive impact of climate policies aimed at the petroleum industry and the energy market. The chief executive officer also regularly meets environmental and consumer organizations to discuss issues ranging from the disposal of produced water10 to reducing greenhouse gas11 emissions, of which CO2 is the most important.
The company’s intention is to reduce CO2 emissions from its operating facilities by about one third by 2010. Based on the findings of a comprehensive corporate program (1997–2001), the primary measures are the injection of CO2 into saline aquifers and reservoir rocks for long-term storage or to improve oil recovery, using hydroelectricity from the Norwegian grid to power installations presently employing on-site generation, and increasing energy efficiency.
Research History in Brief
One of our earliest engagements in CO2 capture and storage was in the late 1980s when the Continental Shelf Institute12 was commissioned to carry out a pilot study on environment-friendly gas power and CO2 injection for improved oil recovery. Similar research began at the Statoil Research Centre in 1989, but it was not until the early 1990s that internal activities really began to intensify. In 1992 Statoil joined forces with Kværner Process Systems, NTNU, and SINTEF to examine whether membrane technology for capturing CO2 from power station emissions would lead to significant weight, space, and cost reductions.
At about the same time, Statoil and partners decided that excessive amounts of CO2 contained in natural gas from the offshore Sleipner field should be stripped off and injected into a saline aquifer situated above the hydrocarbon reservoirs. The primary goal was long-term storage to protect the natural environment. To learn as much as possible from the Sleipner case, Statoil and the IEA Greenhouse Gas R&D Programme organization set up the European Commission’s SACS5 project (phases 1 and 2, 1998–2003), which led to the Sleipner experience becoming a truly multinational concern with global applications in mind. The present CO2 Store project (2003–2005) is essentially a SACS extension, addressing long-term predictions of the aquifer’s behavior and the transfer of approaches and methods to onshore and nearshore industrial sites.
The aims of the complementary, BP-coordinated CO2 Capture Project (2001–2003) were to reduce capture costs by more than 50% at existing plants and by 75% at new ones. Emphasis was placed on the development and qualification of technology for capturing CO2 emitted by gas turbines and power stations. The project involved eight major oil and energy companies,13 and included three distinct regional programs run in the United States, Norway, and the European Union. Statoil headed the Norwegian “Klimatek–NorCap” contribution. And in common with the SACS initiative, the participants wished to demonstrate that CO2 storage is safe, measurable, and verifiable.
Statoil is also looking at ways of transforming the CO2 challenge into viable business opportunities. One area under investigation is the transport of CO2 by ship and pipeline to mature offshore fields requiring gas-based improved oil recovery (IOR) programs. The idea is to use CO2 instead of hydrocarbon gas as an oil-miscible component to improve sweep efficiency.
Awards
In 2002 the group received two major awards: the World Petroleum Congress’s technology development prize for its pioneering efforts in underground carbon dioxide storage and a 2002 World Summit Business Award for Sustainable Development Partnerships, in association with EBI colleagues. These awards testify that Statoil’s long-term efforts in environmental stewardship are paying off both in terms of industrial application and global awareness.
Options
Long-term oceanic and underground storage promises to help nature cope with excessive carbon dioxide emissions to the air—the latter being the most realistic solution, at least in the near future.
Trees and other plants use up vast quantities of CO2 by absorbing it as they grow and retaining it throughout their lifetimes: much is also taken up by seas and oceans. However, these natural mechanisms appear to be inadequate to constrain current levels of anthropogenic (human-made) emissions, especially with continuing denudation of the rain forests and the ravaging of fertile ground by sprawling urbanization. Clearly, there is a pressing need for new measures to be introduced, such as the disposal of CO2 in the ocean and long-term underground storage.
The oceanic storage concept involves the bubbling of gas directly into the sea at concentrations low enough to avoid damaging surrounding ecosystems, and at sufficient depths to ensure that it stays there. Various methods have been suggested, including droplet plumes emanating either from the outlets of deep pipelines linked to onshore CO2 pumping stations or from pipes dangled from CO2 transport ships. Other possibilities include the injection of CO2 from offshore pumping stations into abyssal depths to accumulate as stagnant lakes, and the dropping of solid CO2 into the sea in the form of dry ice.
Although oceanic storage offers the greatest storage capacity, there are major uncertainties about the environmental impact and retention times. Statoil is therefore no longer actively engaged in oceanic disposal storage research but closely follows the latest scientific developments.
Long-term underground (subsurface) storage is regarded as the more reliable solution, requiring CO2 to be injected into deeply buried geological formations. The main candidates are depleted oil and gas reservoirs, deeply buried saline aquifers and unminable coal seams.
The attraction of using depleted oil and gas reservoirs is obvious: they are proven traps; the reservoir geology is well known; and infrastructures can be readily adapted for CO2 transport and injection. Indeed, depleted hydrocarbon gas fields and saline aquifers have long been used on a commercial basis to inject, store and withdraw natural gas according to supply and demand. At present there are 595 underground storage sites worldwide, whose collective working gas storage capacity is equivalent to 11% of the world’s consumption.
There are also innumerable saline aquifers around the world that could be used for long-term CO2 storage. In both cases—depleted reservoirs and saline aquifers—much of the injected gas will eventually dissolve in the formation water, while some may react with the minerals to form carbonate precipitates.
An important storage issue is sealing capacity; that is, the ability of the overlying (cap) rocks to stop the CO2 from leaking out and rising back to the surface. To fulfill this criterion, cap rocks should be almost impermeable and ductile rather than brittle if natural and induced fractures are to be avoided. Onshore leakage can affect water supplies and devastate vegetation cover.
For coal seams, the theory is that injected CO2 will be permanently locked in the coal by adsorption while enhancing methane production by preferential displacement.
Rough IEA estimates of how much CO2 could be stored in these various geological options are >15 Gt14 in unminable coal seams, 920 Gt in depleted oil and gas fields, and 400–10,000 Gt in deep saline aquifers. With the atmosphere today containing about 730 Gt of CO2, saline aquifers obviously hold considerable promise. Onshore CO2-based improved oil recovery is an established practice, which is yet to be tried offshore (see later).
Sleipner West Gas Field
The Sleipner asset notched up two world firsts in pursuit of environmental protection—large-scale offshore carbon dioxide separation and injection into a saline aquifer 1000 meters below the sea bed.
The Statoil-operated Sleipner West15 field is one of the largest gas producers in the Norwegian sector of the North Sea, with a daily gas export capacity of 20.7 million cubic meters and a daily output of 60,000 barrels of stabilized condensate (light oil). It was discovered in 1974 close to the British/Norwegian sector divide and is linked to Sleipner East. Both fields are produced by a single operations organization.
During field development planning (1990), it was realized that the 4–9.5% CO2 content in the natural gas would have to be reduced to less than 2.5% if it were to be fed directly into sales gas pipelines to Europe. A small team of technical experts came up with the unprecedented idea of capturing the CO2 offshore and injecting it into a saline aquifer beneath the Sleipner installations. In this way, the Sleipner asset would minimize CO2 emissions—the prime motive—while avoiding environmental taxes.16 Despite its pioneering nature, this became the partner-approved solution.
Of various possibilities, the Elf-patented separation process was selected for CO2 capture, because it was deemed cheaper to run and more compact than competing systems. One of the greatest challenges, however, was to scale down the process plant sufficiently so that it could be accommodated on a platform. Even so, the “miniaturized” version of the extraction module weighed 8200 tons—the heaviest module ever to be lifted offshore—and measured 50 m × 20 m × 35 m.
By the time the field came onstream in 1996, the Sleipner organization had notched up two world firsts: the installation of a large-scale offshore CO2 extraction plant at the Sleipner T (Treatment) platform and the facilities for saline aquifer injection from the Sleipner East A platform.
Carbon Dioxide Capture and Injection
The carbon dioxide content in the natural gas can now be kept below 2.5% by increasing the amine circulation rate and total heat input.
Carbon Dioxide Capture Process
The first stage in the Sleipner CO2 capture process entails the mixing of an amine-water solution with the natural gas in two parallel columns (absorbers A and B), both of which are kept at high pressure (100 bara17) and moderate temperature (60–70°C). The amine—an organic compound derived from ammonia—selectively absorbs the CO2 by weak chemical bonding and separates out at the bottom of the columns. Thereafter it is transferred via a turbine to a 15 bara flash drum in which the coabsorbed hydrocarbons are removed. The amine is subsequently heated and depressurized to 1.2 bara in a second flash drum where the CO2 is boiled off. By now the gas is almost (95%) pure CO2.
As the lean liquid amine still contains residual CO2, some 10% is subject to thermal regeneration where the CO2 is stripped off by steam in a desorber column operating at 120°C. The remaining, even leaner amine is then mixed with the regenerated amine and pumped back to the absorbers for a new separation cycle.
Experimental Investigations
In practice it has been difficult to keep consistently within the 2.5% goal because the process has proved somewhat unstable. This led to several modifications, including new internals for the gas scrubber to reduce carryover (1997–1998), a comprehensive rebuilding of absorber A (1999), and new internals for absorber B (2000). However, faced with continuing irregularities, the Sleipner Amine Task Force asked this source [Statoil] to devise a solution.
By now this source had become familiar with the removal of CO2 at high pressure while attempting to improve the plant’s performance. Indeed, one of the most important experimental observations was that pressure has a significant effect on the absorption capacity of the amines—adsorption capacity decreases with increasing pressure. This was a cause for concern as it could impact the effectiveness of CO2 capture in the absorber columns.
Spurred on by the task force’s request, the company stepped up its engagement through a major experimental and modeling investigation aimed at better understanding and predicting high-pressure CO2 capture mechanisms. This involved experimenting with genuine natural gas under realistic pressures and temperatures. The effects of various amine solution additives were tested under similar conditions.
However, it was not until 2003 that a major breakthrough was made. Exploiting the research center’s unique laboratory facilities, the answer was found to lie in increasing the amine circulation rate and the heating energy used to separate CO2 from the amine. Subsequent offshore tests at Sleipner resulted in a stable performance while reducing the CO2 content to 2.25%. The new operational procedure and equipment can now be installed at Sleipner T, enabling the amine plant to meet quality specifications when operating at full capacity.
Aquifer Injection
Once the CO2 has been captured, its pressure is boosted by four compressors to 80 bara prior to being transferred to the Sleipner East A platform for pumping into the base of the saline aquifer. Since 1996 about 1 million tons of compressed CO2 have been injected annually.
Another requirement is that the well casing and other hardware used in the capture and injection plant have to be made of stainless steel, because even minute quantities of water mixed with CO2 produce a weak corrosive carbonic acid (H2CO3).
Investment costs amounted to some US $80 million (CO2 capture costs excluded). Although this was a considerable sum, the partners would otherwise have faced an annual tax bill of about US $50 million if the CO2 had simply been vented into the air.
Geological Aquifer and Cap Rock Characterization
The storage capacity of the saline Utsira aquifer is thought to be greater than 100 times the volume of annual European carbon dioxide emissions from power plants.
The aquifer in question is the Utsira Formation, which the SACS team believes was deposited as part of a submarine turbidite fan system18 above the Sleipner reservoir rocks. Today it is encountered some 1000 meters below the seabed,19 and comprises an exceptionally porous and permeable sequence of poorly consolidated, fine- to medium-grained quartz-rich sandstones. Subcropping almost exclusively in the Norwegian sector of the North Sea, it is more than 200 meters thick, over 50 kilometers wide, and extends for some 500 kilometers in a sinuous strip beneath the Brage, Oseberg, Grane, and Sleipner fields and the Tampen production center to the north. The aquifer’s areal coverage is thus about 26,000 square kilometers.
Delineation and mapping of the top of the formation is particularly important for defining its closure. If aquifers form large domal structures, the CO2 will be constrained and slight structural uncertainties can be ignored. However, precise and detailed depth mapping is vital if they undulate gently, as at Sleipner, where the top of the aquifer above the injection point is relatively flat. This is because minor variations may have a major effect on CO2 movement (migration routes), areas of accumulation, and overall storage potential.
The regional mapping was done using 2D seismic datasets, while more detailed work was carried out around the injection point using 3D seismic.20 Petrophysical data from some 300 wells were also available for study, plus limited rock samples in the form of drill cuttings and cores. Much sedimentological, geochemical, and rock-mechanical research is still being done on the complex cap rock/overburden sequence, which at Sleipner is about 700 meters thick. A dedicated 9-meter core was cut from this interval in the summer of 2002.
Another consideration is the possible presence and continuity of faults running through the aquifer and cap rock along which CO2 may escape to the seabed. Fortunately, no significant faults have been detected from the seismic surveys (also see later). The injection process itself could lead to local microseismicity or the opening of incipient, pressure-induced fractures, but the required injection pressures at Sleipner are sufficiently low for this to be regarded as unlikely.
Furthermore, current thinking suggests that the plasticity of the overburden is such that faults and fractures are unlikely to serve as escape conduits. In other words the sealing capacity appears to be good.
Seismic Monitoring
Seismic monitoring has revealed no carbon dioxide leakage in the overburden
Another taxing question was whether the dynamic behavior of the injected CO2 and its potential impact on cap rock integrity could be monitored using modern geophysical techniques, especially seismic. After much discussion, it was agreed that time-lapse seismic would probably be suitable, because the velocity of sound waves should be able to differentiate between saltwater-bearing (higher velocity) and CO2-bearing (lower velocity) sandstones. Time-lapse seismic, which is also known as 4D seismic, involves comparing the results of 3D seismic surveys repeated at considerable time intervals: differences between the survey results are attributed to fluid or pressure changes.
Four seismic surveys have been conducted so far: a pre-SACS baseline survey in 1994 prior to CO2 injection and three monitoring surveys carried out in 1999, 2001, and 2002 during CO2 injection. The latter have not only successfully traced the injection of the CO2 and expansion of the “bubble” but have also yielded extremely sharp images of the aquifer’s overall geometry, internal structure and flow behavior. As expected, gravitational separation is the dominant physical process because of the CO2's buoyancy.
A particularly striking result is that the distribution and migration paths of the CO2 are strongly controlled by intraaquifer mud rock horizons. With an extraordinary seismic detection limit of about 1 meter or less, much of the CO2 can be seen to have migrated upwards between the Utsira Formation mud rock terminations, as witnessed by a distinct seismic chimneylike column appearing on repeated seismic surveys. What is more, it has traveled up to about 1450 meters laterally beneath individual mud rock layers after six years of injection. The lateral speeds at which the CO2 fronts move range from 0 to about 100 meters per annum—at least in recent years.
This remarkable precision prompted the team to estimate seismically the quantity of injected CO2—on the assumption (among others) that none has been dissolved in the saline formation water. By comparing the seismically based result with the injected volumes, it appears that all of the CO2 is accounted for by the seismic data. This, of course, is another argument for suggesting that no significant leakage has occurred, although the lack of seismically observed CO2 in the overburden remains the most persuasive factor. It is wise, however, to recall that there is always a margin of error associated with the seismic method—albeit relatively minor in this case.
Gravimetric Aquifer Monitoring
Time-lapse gravity can potentially be used to better determine carbon dioxide density and mass distribution.
Although gravimetry has a lower spatial resolution than its seismic counterpart, repeated high-precision microgravity monitoring potentially provides better constraints on CO2 density and mass distribution. It may also give an early warning signal if considerable amounts are escaping upwards through the overburden, as well as yielding relatively inexpensive information on the long-term dissolution of the CO2 in the formation water once injection has ceased.
The company’s latest offshore time-lapse gravity surveying technique is being used, having been successfully employed at the Troll field to image and monitor changes in the (hydrocarbon) gas/water contact. Developed in association with Scripps (University of California, San Diego) and cofunded by the US Department of Energy, the state-of-the-art seafloor gravimeter contains three gravity sensors and three pressure sensors, which enable the instrument to monitor small vertical changes in the seafloor as well as small gravity changes. The gravitational accuracy is about 5 × 10⁻⁹ of the earth’s total gravity field.
A 7 × 3 kilometer baseline survey was obtained at Sleipner in August 2002, against which future surveys will be compared. So far the results have exceeded expectations: not only may it be possible to detect vertical changes in the seafloor as small as 0.5 centimeters, but the time-lapse detection threshold may also be as low as 5 μGal21—some 50% better than that suggested by a presurvey modeling exercise.
However, there are other considerations to be taken into account, such as the gravitational effect of further production from the underlying Sleipner gas-condensate reservoirs. The technique also depends on lowering the gravimeter onto separate concrete blocks installed on the seafloor one at a time, although this did not prove to be a hindrance.
Aquifer Flow Modeling
Simulations suggest that the carbon dioxide “mega-bubble” may reach its ultimate size after a few hundred years, thereafter shrinking and finally disappearing within a few thousand years
Whereas geophysical surveys are designed to determine rock and fluid distributions, reservoir simulations are designed to predict how fluids will behave with time. In a case like this, it is naturally wise to make a preinjection simulation to test operational feasibility, as was done at Sleipner before the SACS project started.
The SACS team has subsequently built a detailed postinjection model to verify and improve the seismic and geological interpretation of the aquifer around the injection site; and a coarser, larger-scale model to predict CO2 migration over a period of several thousand years. The areas covered by the models are 7 square kilometers and 128 square kilometers, respectively. In both cases, the seismically inferred mud rock distributions were imported into the reservoir models, because it is almost impossible to trace individual mudstone layers from well to well, even when they are close together. Calibration of the 3D repeated seismic data with a local reservoir model is thus a fundamental prerequisite.
The results from the larger model suggest that most of the CO2 will eventually coalesce to form a single “mega-bubble” beneath the cap rock a few years after injection has ceased. It will also gradually spread along the top of the salty formation water according to the local topography of the cap rock seal. This, however, must be tempered by the fact that CO2 will diffuse from the “mega-bubble” into the underlying brine column, a phenomenon that is usually ignored in standard reservoir simulations because it is extremely slow compared with other transport processes. But given time, the CO2-enriched brine on top of the column will become denser than that beneath, resulting in a downward flow compensated by convection plumes. This, in turn, will enhance dissolution and increase the probability of the CO2 remaining in the aquifer.
When dissolution is included in the simulations, the “mega-bubble” will probably reach its ultimate size after a few hundred years, thereafter shrinking and finally disappearing within a few thousand years.
Further Investigations
The ultimate objective is to combine chemical- and flow-oriented modeling approaches for making reliable, long-term predictions.
The main product of the SACS project is a comprehensive Best Practice Manual (2003). This contains a suggested procedure for evaluating CO2 storage from a technical point of view, besides information aimed at satisfying authorities and the general public as to the feasibility, safety, and reliability of the storage process.
The Sleipner case, which is being used as a full-scale natural laboratory, has yielded copious information on CO2 transport rates and geophysical properties and has gone some way towards assessing the sealing capacity of the overburden.
These are considerable shorter-term achievements, of which the seismic monitoring is the most conspicuous. However, some of the most telling challenges still lie ahead, particularly the making of reliable long-term predictions, recalling that long-term in this context refers to several hundred to several thousand years hence.
Ongoing investigations in the CO2 Store program (2003–2005) include assessments of whether the free and dissolved CO2 remain in the host aquifer or migrate elsewhere and whether the sealing capacity of the cap rock will be maintained, realizing that CO2-rich water is slightly acidic and may lead to mineral dissolution.
Other important issues are whether and how much of the injected CO2 can be permanently fixed by chemical reactions and in what form and whether such chemical changes will impair porosity and permeability, thereby reducing aquifer storage capacity while (possibly) improving retention. The conditions under which CO2 might ultimately be dissolved in its entirety are also receiving attention.
In short, the CO2 Store program aims to extend the capabilities of two-phase (gas, water) reservoir simulators to better handle extremely long-term simulations, including the migration of CO2 in its dissolved form, and chemical-oriented modeling to predict the maximum potential for CO2 reaction with the Utsira Formation sediments and the cap rock.
The ultimate objective is to combine chemical modeling with the flow-oriented modeling approach of reservoir simulation to produce merged “chemical and reactive transport models” constrained by geological and geochemical understanding—a highly ambitious undertaking. Geomechanical modeling is also coming to the fore in a number of related investigations.
Snøhvit and In Salah Projects
With the addition of Snøhvit and the In Salah gas projects, the company is now involved in the world’s first three carbon dioxide storage projects solely aimed at protecting the natural environment.
The Snøhvit Development in the Barents Sea
Statoil and partners are planning the second largest offshore carbon dioxide storage project at Snøhvit based on the Sleipner West experience.
Moving on from Sleipner West, Statoil and partners22 are planning the world’s second largest offshore CO2 storage project for the Snøhvit unit in the central part of the Hammerfest basin in the Barents Sea. The production area extends across seven unitized licences, covering the Snøhvit field itself and the Albatross and Askeladd satellites. All three accumulations contain natural gas and small quantities of condensate. The Snøhvit unit is scheduled to come on stream in 2006, some 25 years after the first gas discovery was made at Askeladd in 1981.
The unitized complex will be developed entirely using subsea production installations, linked by a record-breaking 143-kilometer multiphase flow pipeline to a processing and cryogenic gas liquefaction plant located at Melkøya—a small island outside Hammerfest.
The main product, LNG (liquefied natural gas), will be shipped to the United States and continental Europe in four purpose-built vessels, each 290 meters long and capable of carrying about 140,000 cubic meters of LNG in spherical tanks. Condensate and liquefied petroleum gas (LPG) will also be produced in relatively minor quantities. The LNG plant’s production capacity will be about 5.7 billion cubic meters of gas per year.
The Snøhvit LNG project is the first oil and gas development in the environmentally sensitive Barents Sea and the first LNG-based gas field development in Europe. Furthermore, it is the first Norwegian offshore development with no surface installations. With all of the production equipment residing in water depths of 250–345 meters, none will interfere with fishing activities. Operations will be remotely controlled from land.
The gas in all three accumulations contains 5–8% CO2, which will have to be reduced to less than 50 parts per million prior to liquefaction. This means that about 700,000 tons of CO2 will have to be captured each year. Having reviewed several disposal options, it was decided that the CO2 will be injected into the Tubåen Formation—a deeply buried saline sandstone aquifer encountered at the Snøhvit field about 2600 meters below the seafloor and about 60 meters beneath the main natural gas reservoir in the Stø Formation.
The Tubåen Formation contains some shale intervals that are difficult to correlate from well to well. Good interconnection between the sand bodies is thus anticipated. And with a thickness of about 47–75 meters, a net-to-gross ratio23 of 0.8–0.9, and good reservoir properties,24 the formation should be able to cope easily with the estimated storage requirement of about 23 million tons of CO2 during the 30-year lifetime of the Snøhvit project. The formation is sealed by shaley cap rocks of the intervening Nordmela Formation, which should be sufficient to stop the injected CO2 from rising to contaminate the natural gas reservoirs above.
The separation process will again be amine-based and cost about US $100 million. The main difference between the Sleipner T and the Snøhvit plants is that the latter will be capable of stripping residual CO2 from all of the lean amine solution after initial separation. And it goes without saying that Statoil’s world-class expertise gained at Sleipner is being fully exploited during the planning phase. The In Salah Gas Project, Central Algeria25 plans are under way to reduce greenhouse gas emissions from the jointly operated In Salah Gas project by about 60%.
The third CO2 injection project concerns the jointly operated Sonatrach26-BP-Statoil In Salah dry gas project—the third largest of its kind in Algeria. The agreement covers the development of eight hydrocarbon gas discoveries in the Ahnet-Timimoum Basin in the central Saharan region of the country and proposes to deliver 9 billion cubic meters per annum.
Some of the gas streams will contain CO2 concentrations as high as 10%, whereas export sales gas specifications require a CO2 concentration of less than 0.3%. To achieve this target, it has been estimated that some 1.2 million tons of CO2 will probably have to be stripped off and stored each year from mid-2004 when the gas comes on stream.
Prior to Statoil’s entry in 2003, BP and Sonatrach began searching for suitable subsurface sites close to the planned In Salah processing facilities that would be blessed with large storage potentials, reasonably good reservoir properties, and good sealing capacities. Several possibilities emerged, ranging from storage sites at each field to a single centralized facility. Of these various options, the latter solution was favored because of the high cost and complexity associated with distributed subsurface storage.
BP and Sonatrach thereafter identified the Krechba field as the most appropriate candidate. Here the CO2 will be pumped through two or three horizontal wells directly into the aquifer section (below the gas-oil contact) around the northern periphery of the shallow Krechba sandstone reservoir. The reservoir rocks are of carboniferous age and were deposited by a tidally influenced estuary infilling an incised valley system. Reservoir thicknesses vary from 5–24 meters within a broad, largely unfaulted, anticlinal fold. It is thought that the injected CO2 will migrate only upwards into the producing structure of the main field once the field has been fully depleted and abandoned.
From a rigorous evaluation using reservoir simulation models, BP estimated that breakthrough of the injected CO2 into central gas wells is unlikely to occur within the first 15 years of production. By then, reductions in CO2 production from the other In Salah fields will have freed CO2 handling capacity at the Krechba surface facilities. The model, which will be updated, has also been used to identify well locations that satisfy criteria such as accessing connected sandstone volumes to accommodate the predicted quantities of CO2 and minimizing flow line distances.
The separation plant will again be amine based.
Power Plants
Past and present research is bringing the possibility of cost-effective carbon dioxide capture and storage from power plants ever closer.
Kårstø and Osaka Pilot Plants
Membrane technology promises to reduce weight and space at CO2 separation plants, as well as costs.
Besides CO2 capture and storage from gas fields, the company has done much research on the cleaning of flue gas emissions from coal- and gas-fired power plants. Although the power industry is the greatest contributor to global CO2 emissions, CO2 capture remains an elusive goal because of the low concentrations of CO2 contained in exhaust fumes and the cost of removing them.
Initial work was largely centered on a flagship venture, which started in 1992 as a joint industry project with Kværner Process Systems, NTNU, and SINTEF. The main aim was to investigate whether membrane contactors could replace the bulky amine towers currently used for CO2 absorption and desorption. Ongoing studies are concerned with verifying the current technology and making further improvements.
The membrane concept is simple: a gas absorption membrane serves as a contact device between a CO2-rich flue gas flow on one side and the flow of an absorption fluid on the other. Separation occurs as the CO2 is selectively drawn through the membrane by the attraction of the absorption fluid. The CO2 is then removed from the liquid at elevated temperature and pressure by essentially reversing the procedure so that the membrane acts as a desorption device. The membranes are generally made from porous, hydrophobic materials, although their exact constructions are far more complex.
W L Gore and Associates (Gmbh) supplied designer membranes for installation at two major pilot plants—one in Norway (at Kårstø) and one in Japan (Osaka). The Japanese leg was in cooperation with the Kansai Electric Power Company, Mitsubishi Heavy Industries, and the Carbon Dioxide Capture Project (see later). The main difference between the two investigations is that a conventional amine was used at Kårstø, while a recently developed alternative was tested at Osaka.
The main advantage of membrane technology is that it reduces weight and space by about 50%, thus making it especially suitable for offshore CO2 as well as onshore capture. What is more, degradation of the absorbent can be reduced and entrainment and foaming are totally avoided.
The results from both pilot plant tests are very encouraging, not only because of the weight/space advantages but also because of potential cost reductions.
Carbon Dioxide Capture Project
While this work was under way, the company decided to widen its technological net by participating in several broad-based international studies, the latest and most comprehensive being the Carbon Dioxide Capture Project (CCP).
As stated in the Introduction, the main aim of the project (2001–200327) was to reduce the costs of CO2 separation and capture by more than 50% for existing plants and by 75% for new ones. Other objectives included ways of demonstrating to authorities and the public that CO2 storage is safe, measurable, and verifiable and to advance technologies towards a “proof of concept” stage.
With such an immense scope, it is hardly surprising that most of the conclusions point to further research. Even so, there are many significant results. For CO2 capture, the consortium developed a broad portfolio of technologies that will serve as the basis for the next generation and has shown that all three of the main technical areas—pre-combustion, post-combustion, and oxyfuel—have considerable potential for reducing costs. Furthermore, a new set of tools has been developed for managing long-term CO2 storage, as well as a unique risk-based approach covering both aspects.
However, it was concluded that CO2 capture and storage from heat and power production is still too expensive in the light of current oil and gas prices and taxes. Moreover, no technology is emerging as a clear leader, although several promising areas may be on the brink of commercialization.
Perhaps the project’s most resounding achievement was that industries and governments came together in an international forum to promote strong technical leadership.
The CO2 Store Project
Another investigation is currently assessing whether the Sleipner experience can be extended to onshore industrial sites. This is being done as part of the aforementioned CO2 Store project, in which four European locations have been earmarked for extensive feasibility studies:
1. Denmark: The Energi E2-operated power plant and Statoil’s Kalundborg refinery, which constitute the largest, single Danish CO2 emission point source accounting for some 6 million tons of CO2 per year. The power plant fuel is coal and orimulsion—a fuel consisting of a bitumen-in-water emulsion.
2. South Wales (UK): A prospective gasification/combined-cycle power station to be developed by Progressive Energy using a mixture of anthracitic coal and green petcoke. The proposed technical solution involves pre-combustion CO2 capture, possibly amounting to 1–2 million tons per year.
3. Part of the Trøndelag Platform: An area off the Norwegian coast that contains several CO2 point sources and where others are being planned.
4. Germany: The Schwarze Pumpe power plant operated by Vattenfall’s subsidiary VEAG (Vereinigte Energiwerke AG). The plant is fueled with lignite and each block emits about 5 million tons of CO2 per year.
Both onshore and nearshore repositories will be investigated, including those with large structural closures, depleted fields and regional deep saline aquifers.
The intention is that research will progress to such a stage that industry and national authorities can make an informed decision as to whether injection is a practical proposition in their respective areas. This, however, is not as straightforward as it seems, because judicial, safety and geological considerations will differ significantly from place to place. The Sleipner experience will therefore have to be adapted to meet local conditions.
By the time this part of the CO2 Store project has run its course, the participants hope to offer a tool kit of various technologies and procedures that can be matched to suit the requirements of any deep saline aquifer, wherever it may be. The SACS 2003 Best Practice Manual will be updated accordingly.
Other Projects
Although space limitations preclude extensive coverage of all but the most eye-catching projects, it is important to mention that other collaborative ventures and proprietary in-house projects are systematically examining the entire range of available technologies. Among them, Statoil is a partner in three integrated, multipartner ventures which are partly funded by the European Union; namely, ENCAP, CASTOR, and CO2Sink. These are concerned with pre-combustion, post-combustion, and storage, respectively.
The company is also jointly involved in several basic research projects, two of them dealing with CO2 capture and one with the use of CO2 for improved oil recovery (discussed next). The aims are to elucidate fundamental physicochemical phenomena in the hope of making significant breakthroughs.
Carbon Dioxide Utilization
The world’s consumption of brewed and carbonated drinks falls well short of using up the vast quantities of excessive anthropogenic CO2, and the European market for so-called food grade CO2 is currently running at only 2.7 million tons per year.
Other enticing possibilities are self-defeating in the sense that they normally involve the use of energy, thereby producing even more CO2.
One way of overcoming this is to use CO2 as a means of improving oil recovery. When the conditions are right, the injection of CO2 into a petroleum reservoir results in partial storage while improving the cash flow.
At the last count, some 70 or more onshore fields in the United States use CO2-based miscible28 gas injection to squeeze more oil out of the reservoirs. Here there are several natural sources29 of high-grade, high-pressure CO2, as well as a pipeline infrastructure linked to the fields in question.
A comprehensive study30 of 115 onshore fields concluded that the average improvement in the oil recovery factor is about 12% for sandstone reservoirs and as high as 17% for carbonates. Moreover, about 71% of the injected CO2 (on average) remains in the reservoirs while back-produced31 CO2 is recovered and reinjected.
The next step—although a major one—is to transfer this decade-old practice from onshore to offshore, using industrial rather than natural sources of CO2.
The North Sea and even parts of the Norwegian Sea are regarded as potentially suitable targets, because numerous oil fields, gas processing sites, and CO2 sources are relatively concentrated when compared with other offshore regions around the world.
But where will the CO2 come from?
Industrial Sources and Transport
The world’s industrial sources can be classified according to their CO2 concentration, and the costs of capturing high-concentration sources are usually lower than those for low-concentration sources.
The most prolific sources are ammonia plants, hydrogen plants, gas processing centers, cement factories, and iron and steel blast furnaces.
Another source for Statoil is its own gas processing sites (e.g., Sleipner and Snøhvit), where the gas consumer has already paid for the CO2 capture.
But how would the CO2 be transported to the fields?
On land, much CO2 is transported via pipelines and is thus a proven technology.32
This means that the adaptation of present and new pipelines systems is a feasible proposition in parts of the North and Norwegian Seas. However, another serious contender is the shipment of CO2 in tankers that are somewhat akin to those for transporting liquefied petroleum gas. In certain cases shipping may prove to be the cheaper alternative and will certainly be the more flexible of the two solutions.
Statoil, SINTEF, Vigor AS, and the Teekay Shipping Corporation33 have just completed a research project aimed at designing a suitable vessel. The planned ship is 177 meters long by 31 meters wide, and contains four to six tanks capable of holding 20,000 cubic meters of liquefied CO2 at around 7 bara and a temperature of –50°C. One notable innovation is the development of equipment for directly discharging liquefied CO2 at production platforms. The ship is also designed as a multipurpose carrier suitable for transporting LPG and similar products.
Having weighed up the relative costs of initially supplying about 10 million tons of CO2 by pipeline or ship, Statoil believes that both alternatives could be involved either separately or in combination.
But what about the technical and economic viability of offshore CO2-based improved oil recovery?
Carbon Dioxide-Based Improved Oil Recovery
Detailed screening studies show that several Statoil-operated fields may be suitable candidates.
Over the years, Statoil has made enormous strides in improved oil recovery processes, not least the injection of water and natural gas to sweep more oil out of reservoirs (e.g., WAG34) and the use of bacteria to mobilize more oil from pore surfaces (M IOR35). The IOR potential for Statoil-operated fields is thought to be significant, particularly in the Tampen and Halten production centers off the southern and mid-Norwegian coast.
The possibility of using CO2 instead of natural gas has long been discussed, but it is only during the last five years that the topic has received rigorous attention. The question is not whether CO2-based IOR is feasible—this has already been proved on land—but whether it is viable for the specific conditions encountered in the North Sea.
The general principle is broadly the same as that for natural gas-based techniques, bearing in mind that CO2 under elevated pressure and temperature is far denser than natural gas. After natural (primary) depletion36 and (secondary) water injection, CO2 can be injected into reservoirs where it mixes with the remaining oil and pushes a bank of additional oil towards production wells. CO2 injection is sometimes referred to as a tertiary recovery process.
Many of the determining factors are common to any CO2-based IOR project whether on land or at sea; others, however, are peculiar to the offshore operating environment.
On one side of the equation is cost, where gross and net values of additional oil have to be balanced against operational and investment expenditure. Examples include the importation of vast quantities of CO2, its mode of transport, and the distances involved. Platform modifications also come into the picture, including the construction of production and injection systems and facilities for handling back-produced CO2.
On the other side of the equation are technical considerations; for example, well coverage and drainage areas, bearing in mind that distances between offshore wells are far greater than their onshore counterparts.
Other issues concern the ways in which the physical and chemical characteristics of the reservoir rocks and fluids may be affected by CO2 and the influence of recovery processes and drainage strategies used earlier in the life of a field.
The eventual challenge of injecting CO2 through subsea wells (i.e., those installed on the seabed) must also be taken into account now that subsea IOR is much in focus.
And in some cases there is a possibility of CO2 infiltrating natural gas and weak carbonic acid corroding pipe work and pipelines.
The most important aspect, however, is the potential cost-effectiveness of CO2-based IOR compared with other recovery processes.
Taking all of this into account, it is clear that the importation of a land-based practice into the offshore arena cannot be undertaken lightly. Even so, there are certain technical advantages: CO2 increases miscibility, which leads to improved displacement efficiency; its high density results in better sweep efficiency; and the consequent swelling of the oil improves mobility. Oil production is also generally high when the conditions are right.
Screening evaluations have been performed on numerous Statoil-operated and partner oil fields, each of which has been categorized on a scale ranging from “promising” to “inappropriate.”
As expected, reservoir performance simulations show that there are considerable variations in the amounts of extra oil that could be produced. In the worst cases there is almost no benefit at all, whereas in the best cases additional production could amount to some 10% of the original oil in place.
The challenge facing Statoil’s reservoir experts is to reduce the economic and technical risks by improving the precision of reservoir simulation and discuss the pros and cons of implementation with asset teams and partners.
Of those fields falling into the “promising” category, the Statoil-operated Gullfaks field is the most extensively studied candidate for a CO2-based M WAG pilot (M = miscible).
The field is located on the western flank of the North Viking Graben (Norwegian sector, North Sea), and largely comprises highly faulted and compartmentalized marine and fluvio-deltaic sandstone reservoirs belonging to the prolific Middle Jurassic Brent Group. Production at Gullfaks began in 1986 and the field has 112 wells drilled from three production platforms.
In short, Statoil’s plan is to reduce the costs of CO2 capture, generate electricity and hydrogen from natural gas, and consolidate its position in renewables.
The case above represents the most thorough information I could find on Statoil’s work in 2006, when I submitted the first edition of this book for publication. Overall, it still is.
MIT retains a log of sequestration sites worldwide and the information below37 on Mongstad comes from there. MIT reference the Statoil website, so that is also provided below.
However, Statoil’s website38 provides more current updates on new and individual projects. An example follows.
Statoil Mongstad Fact Sheet: Carbon Dioxide Capture and Storage Project
Company/Alliance: Phase 1: The European CO2 Test Centre Mongstad (TCM) owned by the Norwegian Government, Statoil, Sasol and Shell
Phase 2: Statoil and Norwegian Government
Location: Mongstad, Norway
Feedstock: Natural gas
Process: Exhaust gases from a Residue Catalytic Cracker (RCC) and Natural Gas Combined Heat and Power (CHP) plant
Size: Combined Heat and Power Facility: 350 MW heat, 280 MW electricity
Phase 1: 100,000 T/Yr CO2
Phase 2: 1.5 MT/Yr
Capture Technology: Phase 1: Post-combustion: Chilled ammonia (80,000 T/Yr CO2) and amine-based capture (20,000 T/Yr CO2)
CO2 Fate: Sequestration in Saline Formation
Timing: Phase 1: Start-up of the cogeneration facility and pilot plant (2012)
Phase 2: Awaiting Norway's Government funding decision (2016): a decision basis for the construction of the larger scale Phase 2 project is to be submitted to the authorities in 2013/2015
Motivation/Economics:
The project will be developed in two phases to reduce technical and financial risk. Phase 1 includes capturing at least 80,000 tons of CO2 using chilled ammonia and 20,000 tons of CO2 with amine technology.
In September 2010 an estimate was that the CCS plant at the Mongstad refinery and power station will cost about 6 billion kroner ($1.02 billion). In October 2010 the Norwegian Government announced that it was increasing CCS spending by 1/3 to Nkr 2.7 billion ($462 million). The majority of this would go to the Mongstad Project.
Comments:
The Mongstad CCS project was started in May 2012.
Phase 1: The goal of the TCM is to develop the most cost effective way to capture CO2 with post-combustion technology. The TCM will test two capture technologies:
1: Aker Clean Carbon's amine-based CO2 capture; and
2: Alstom's chilled ammonia-based technology. There is availability to test other technologies. In July 2012 Alstom successfully completed the feasibility study and has proceeded to the next step of the CO2 capture technology qualification program for the full scale CCS plant.
Phase 2: The Norwegian oil and energy ministry said in March 2011 that they were postponing the decision to invest in Mongstad until 2016. The Norwegian Government had originally said in May 2011 that it would delay the decision to fund the CCS project at Mongstad until after 2014 when the present parliament's term is over. However, there may be a possible compromise if Statoil decreases the total size of the Mongstad. The emissions permit from the Norwegian Ministry of Environment requires that the development of the full scale CCS project proceed in parallel with the construction of the CHP plant.
Appendix 11A: Emissions Legislation
If an end user in any NIC (newly industrialized country) were to state BAT (best available technology) as his requirement, he would then probably have cleared the environmental legislation limits in his own country with a safety margin. However, frequently, legislators in NICs chose a template that they can work towards or adopt in increments, realistic to their own circumstances.
If one were to exclude CO2 from consideration (other than it is reduced by using more efficient thermodynamic cycles), then most templates from Western countries would suffice as a guide template. Not all Western countries have adopted CO2 taxes. Many now have NOx and SOx taxes. Countries like the United States trade NOx and SOx emissions between power plants, in each individual state.
The information on these standards is publicly available, and while there are some differences, the air quality agreement between the United States and Canada makes their standards relatively compatible. The United States has a federal Environmental Protection Agency (EPA) and each state has its own EPA, which may all have slightly different standards.
What follows are extracts from a version of the US EPA limits on stationary gas turbines (their section 3.1). The reader is referred to the source for the latest update and revisions. What follows is merely a guide and is deliberately not current. The parameters and substances discussed within are still the substances tracked by emissions monitoring; however, limits change with expanding technology. For instance, the version below does not include any NOx ppm information on Xonon flameless combustors. It would, however, be fair to say that any standard for emissions from stationary gas turbines would involve these pollutant substances in roughly these percentages, until gas turbine technology takes the next giant leap forward. The author has left in a partial reference list for this document, so that the reader can seek updates for those sources as well.
From the US EPA’s Section 3.1.1 General [1]39
Gas turbines, also called “combustion turbines,” are used in a broad scope of applications including electric power generation, cogeneration, natural gas transmission, and various process applications. Gas turbines are available with power outputs ranging in size from 300 horsepower (hp) to over 268,000 hp, with an average size of 40,200 hp [2]. The primary fuels used in gas turbines are natural gas and distillate (No. 2) fuel oil [3].
From 3.1.3 Emissions39
The primary pollutants from gas turbine engines are nitrogen oxides (NOX), carbon monoxide (CO), and to a lesser extent volatile organic compounds (VOC). Particulate matter (PM) is also a primary pollutant for gas turbines using liquid fuels. Nitrogen oxide formation is strongly dependent on the high temperatures developed in the combustor. Carbon monoxide, VOC, hazardous air pollutants (HAP), and PM are primarily the result of incomplete combustion. Trace to low amounts of HAP and sulfur dioxide (SO2) are emitted from gas turbines. Ash and metallic additives in the fuel may also contribute to PM in the exhaust. Oxides of sulfur (SOX) will only appear in a significant quantity if heavy oils are fired in the turbine. Emissions of sulfur compounds, mainly SO2, are directly related to the sulfur content of the fuel.
Available emissions data indicate that the turbine’s operating load has a considerable effect on the resulting emission levels. Gas turbines are typically operated at high loads (greater than or equal to 80% of rated capacity) to achieve maximum thermal efficiency and peak combustor zone flame temperatures. With reduced loads (lower than 80%), or during periods of frequent load changes, the combustor zone flame temperatures are expected to be lower than the high load temperatures, yielding lower thermal efficiencies and more incomplete combustion. The emission factors for this section are presented for gas turbines operating under high load conditions. Section 3.1 background information documents and emissions database contain additional emissions data for gas turbines operating under various load conditions.
Gas turbines firing distillate oil may emit trace metals carried over from the metals content of the fuel. If the fuel analysis is known, the metals content of the fuel ash should be used for flue gas emission factors assuming all metals pass through the turbine.
If the HRSG is not supplementary fuel fired, the simple cycle input-specific emission factors (pounds per million British thermal units [lb/MMBtu]) will also apply to cogeneration/combined-cycle systems. If the HRSG is supplementary fired, the emissions attributable to the supplementary firing must also be considered to estimate total stack emissions.
3.1.3.1 Nitrogen Oxides
Nitrogen oxides formation occurs by three fundamentally different mechanisms. The principal mechanism with turbines firing gas or distillate fuel is thermal NOx, which arises from the thermal dissociation and subsequent reaction of nitrogen (N2) and oxygen (O2) molecules in the combustion air. Most thermal NOx is formed in high temperature stoichiometric flame pockets downstream of the fue linjectors where combustion air has mixed sufficiently with the fuel to produce the peak temperature fuel/air interface.
The second mechanism, called prompt NOx, is formed from early reactions of nitrogen molecules in the combustion air and hydrocarbon radicals from the fuel. Prompt NOx forms within the flame and is usually negligible when compared to the amount of thermal NOx formed. The third mechanism, fuel NOx, stems from the evolution and reaction of fuel-bound nitrogen compounds with oxygen. Natural gas has negligible chemically-bound fuel nitrogen (although some molecular nitrogen is present). Essentially all NOx formed from natural gas combustion is thermal NOx. Distillate oils have low levels of fuel-bound nitrogen. Fuel NOx from distillate oil-fired turbines may become significant in turbines equipped with a high degree of thermal NOx controls. Otherwise, thermal NOx is the predominant NOx formation mechanism in distillate oil-fired turbines.
The maximum thermal NOx formation occurs at a slightly fuel-lean mixture because of excess oxygen available for reaction. The control of stoichiometry is critical in achieving reductions in thermal NOx. Thermal NOx formation also decreases rapidly as the temperature drops below the adiabatic flame temperature, for a given stoichiometry. Maximum reduction of thermal NOx can be achieved by control of both the combustion temperature and the stoichiometry. Gas turbines operate with high overall levels of excess air, because turbines use combustion air dilution as the means to maintain the turbine inlet temperature below design limits. In older gas turbine models, where combustion is in the form of a diffusion flame, most of the dilution takes place downstream of the primary flame, which does not minimize peak temperature in the flame and suppress thermal NOx formation.
Diffusion flames are characterized by regions of near-stoichiometric fuel/air mixtures where temperatures are very high and significant thermal NOx is formed. Water vapor in the turbine inlet air contributes to the lowering of the peak temperature in the flame, and therefore to thermal NOx emissions. Thermal NOx can also be reduced in diffusion type turbines through water or steam injection. The injected water-steam acts as a heat sink lowering the combustion zone temperature, and therefore thermal NOx. Newer model gas turbines use lean, premixed combustion where the fuel is typically premixed with more than 50% theoretical air which results in lower flame temperatures, thus suppressing thermal NOx formation.
Ambient conditions also affect emissions and power output from turbines more than from external combustion systems. The operation at high excess air levels and at high pressures increases the influence of inlet humidity, temperature, and pressure [4]. Variations of emissions of 30% or greater have been exhibited with changes in ambient humidity and temperature. Humidity acts to absorb heat in the primary flame zone due to the conversion of the water content to steam. As heat energy is used for water to steam conversion, the temperature in the flame zone will decrease resulting in a decrease of thermal NOx formation. For a given fuel firing rate, lower ambient temperatures lower the peak temperature in the flame, lowering thermal NOx significantly. Similarly, the gas turbine operating loads affect NOx emissions. Higher NOx emissions are expected for high operating loads due to the higher peak temperature in the flame zone resulting in higher thermal NOx.
3.1.3.2 Carbon Monoxide and Volatile Organic Compounds
CO and VOC emissions both result from incomplete combustion. CO results when there is insufficient residence time at high temperature or incomplete mixing to complete the final step in fuel carbon oxidation. The oxidation of CO to CO2 at gas turbine temperatures is a slow reaction compared to most hydrocarbon oxidation reactions. In gas turbines, failure to achieve CO burnout may result from quenching by dilution air. With liquid fuels, this can be aggravated by carryover of larger droplets from the atomizer at the fuel injector. Carbon monoxide emissions are also dependent on the loading of the gas turbine. For example, a gas turbine operating under a full load will experience greater fuel efficiencies, which will reduce the formation of carbon monoxide. The opposite is also true, a gas turbine operating under a light to medium load will experience reduced fuel efficiencies (incomplete combustion), which will increase the formation of carbon monoxide.
The pollutants commonly classified as VOC can encompass a wide spectrum of volatile organic compounds, some of which are hazardous air pollutants. These compounds are discharged into the atmosphere when some of the fuel remains unburned or is only partially burned during the combustion process. With natural gas, some organics are carried over as unreacted, trace constituents of the gas, while others may be pyrolysis products of the heavier hydrocarbon constituents. With liquid fuels, large droplet carryover to the quench zone accounts for much of the unreacted and partially pyrolized volatile organic emissions.
Similar to CO emissions, VOC emissions are affected by the gas turbine operating load conditions. Volatile organic compounds emissions are higher for gas turbines operating at low loads as compared to similar gas turbines operating at higher loads.
3.1.3.3 Particulate Matter [13]
PM emissions from turbines primarily result from carryover of noncombustible trace constituents in the fuel. PM emissions are negligible with natural gas firing and marginally significant with distillate oil firing because of the low ash content. PM emissions can be classified as “filterable” or “condensable” PM. Filterable PM is that portion of the total PM that exists in the stack in either the solid or liquid state and can be measured on a EPA Method 5 filter. Condensable PM is that portion of the total PM that exists as a gas in the stack but condenses in the cooler ambient air to form particulate matter. Condensable PM exists as a gas in the stack, so it passes through the Method 5 filter and is typically measured by analyzing the impingers, or “back half,” of the sampling train. The collection, recovery, and analysis of the impingers is described in USA EPA Method 202 of Appendix M, Part 51 of the Code of Federal Regulations. Condensable PM is composed of organic and inorganic compounds and is generally considered to be all less than 1.0 micrometers in aerodynamic diameter.
3.1.3.4 Greenhouse Gases [5–11]
Carbon dioxide (CO2) and nitrous oxide (N2O) emissions are all produced during natural gas and distillate oil combustion in gas turbines. Nearly all of the fuel carbon is converted to CO2 during the combustion process. This conversion is relatively independent of firing configuration. Methane (CH4) is also present in the exhaust gas and is thought to be unburned fuel in the case of natural gas or a product of combustion in the case of distillate fuel oil.
Although the formation of CO acts to reduce CO2 emissions, the amount of CO produced is insignificant compared to the amount of CO2 produced. The majority of the fuel carbon not converted to CO2 is due to incomplete combustion.
Formation of N2O during the combustion process is governed by a complex series of reactions and its formation is dependent upon many factors. However, the formation of N2O is minimized when combustion temperatures are kept high (above 1475°F) and excess air is kept to a minimum (less than 1%).
3.1.3.5 HAP Emissions
Available data indicate that emission levels of HAP are lower for gas turbines than for other combustion sources. This is due to the high combustion temperatures reached during normal operation. The emissions data also indicate that formaldehyde is the most significant HAP emitted from combustion turbines. For natural gas-fired turbines, formaldehyde accounts for about two thirds of the total HAP emissions. Polycyclic aromatic hydrocarbons (PAH), benzene, toluene, xylenes, and others account for the remaining one third of HAP emissions. For No. 2 distillate oil-fired turbines, small amounts of metallic HAP are present in the turbine’s exhaust in addition to the gaseous HAP identified under gas-fired turbines. These metallic HAP are carried over from the fuel constituents. The formation of carbon monoxide during the combustion process is a good indication of the expected levels of HAP emissions. Similar to CO emissions, HAP emissions increase with reduced operating loads. Typically, combustion turbines operate under full loads for greater fuel efficiency, thereby minimizing the amount of CO and HAP emissions.
3.1.4 Control Technologies [12]39
There are three generic types of emission controls in use for gas turbines, wet controls using steam or water injection to reduce combustion temperatures for NOx control, dry controls using advanced combustor design to suppress NOx formation or promote CO burnout, and post-combustion catalytic control to selectively reduce NOx or oxidize CO emission from the turbine. Other recently developed technologies promise significantly lower levels of NOx and CO emissions from diffusion-combustion-type gas turbines. These technologies are currently being demonstrated in several installations.
Emission factors in this section have been determined from gas turbines with no add-on control devices (uncontrolled emissions). For NOx and CO emission factors for combustion controls, such as water-steam injection and lean premix units, are presented. Additional information for controlled emissions with various add-on controls can be obtained using the section 3.1 database. Uncontrolled, lean-premix, and water injection emission factors were presented for NOx and CO to show the effect of combustion modification on emissions.
3.1.4.1 Water Injection
Water or steam injection is a technology that has been demonstrated to effectively suppress NOx emissions from gas turbines. The effect of steam and water injection is to increase the thermal mass by dilution and thereby reduce peak temperatures in the flame zone. With water injection, there is an additional benefit of absorbing the latent heat of vaporization from the flame zone. Water or steam is typically injected at a water-to-fuel weight ratio of less than 1.
Depending on the initial NOx levels, such rates of injection may reduce NOx by 60% or higher. Water or steam injection is usually accompanied by an efficiency penalty (typically 2–3%) but an increase in power output (typically 5–6%). The increased power output results from the increased mass flow required to maintain turbine inlet temperature at manufacturer’s specifications. Both CO and VOC emissions are increased by water injection, with the level of CO and VOC increases dependent on the amount of water injection.
3.1.4.2 Dry Controls
Since thermal NOx is a function of both temperature (exponentially) and time (linearly), the basis of dry controls are to either lower the combustor temperature using lean mixtures of air or fuel staging or decrease the residence time of the combustor. A combination of methods may be used to reduce NOx emissions such as lean combustion and staged combustion (two-stage lean/lean combustion or two-stage rich/lean combustion).
Lean combustion involves increasing the air-to-fuel ratio of the mixture so that the peak and average temperatures within the combustor will be less than that of the stoichiometric mixture, thus suppressing thermal NOx formation. Introducing excess air not only creates a leaner mixture but it also can reduce residence time at peak temperatures.
Two-stage lean/lean combustors are essentially fuel-staged, premixed combustors in which each stage burns lean. The two-stage lean/lean combustor allows the turbine to operate with an extremely lean mixture while ensuring a stable flame. A small stoichiometric pilot flame ignites the premixed gas and provides flame stability. The NOx emissions associated with the high temperature pilot flame are insignificant. Low NOx emission levels are achieved by this combustor design through cooler flame temperatures associated with lean combustion and avoidance of localized “hot spots” by premixing the fuel and air.
Two-stage rich/lean combustors are essentially air-staged, premixed combustors in which the primary zone is operated fuel rich and the secondary zone is operated fuel lean. The rich mixture produces lower temperatures (compared to stoichiometric) and higher concentrations of CO and H2, because of incomplete combustion. The rich mixture also decreases the amount of oxygen available for NOx generation. Before entering the secondary zone, the exhaust of the primary zone is quenched (to extinguish the flame) by large amounts of air and a lean mixture is created. The lean mixture is preignited and the combustion completed in the secondary zone. NOx formation in the second stage is minimized through combustion in a fuel lean, lower temperature environment. Staged combustion is identified through a variety of names, including dry-low NOx (DLN), dry-low emissions (DLE), or SoLoNOx.
3.1.4.3 Catalytic Reduction Systems39
Selective catalytic reduction (SCR) systems selectively reduce NOx emissions by injecting ammonium (NH3) into the exhaust gas stream upstream of a catalyst. Nitrogen oxides, NH3, and O2 react on the surface of the catalyst to form N2 and H2O. The exhaust gas must contain a minimum amount of O2 and be within a particular temperature range (typically 450–850°F) in order for the SCR system to operate properly.
The temperature range is dictated by the catalyst material, which is typically made from noble metals, including base metal oxides such as vanadium and titanium, or zeolite-based material. The removal efficiency of an SCR system in good working order is typically from 65–90%. Exhaust gas temperatures greater than the upper limit (850°F) cause NOx and NH3 to pass through the catalyst unreacted. Ammonia emissions, called NH3 slip, may be a consideration when specifying an SCR system.
Ammonia, either in the form of liquid anhydrous ammonia or aqueous ammonia hydroxide, is stored on-site and injected into the exhaust stream upstream of the catalyst. Although an SCR system can operate alone, it is typically used in conjunction with water-steam injection systems or lean-premix system to reduce NOx emissions to their lowest levels (less than 10 ppm at 15% oxygen for SCR and wet injection systems). The SCR system for landfill or digester gas-fired turbines requires a substantial fuel gas pretreatment to remove trace contaminants that can poison the catalyst. Therefore, SCR and other catalytic treatments may be inappropriate control technologies for landfill or digester gas-fired turbines.
The catalyst and catalyst housing used in SCR systems tend to be very large and dense (in terms of surface area to volume ratio) because of the high exhaust flow rates and long residence times required for NOx, O2, and NH3, to react on the catalyst. Most catalysts are configured in a parallel-plate, “honeycomb” design to maximize the surface area-to-volume ratio of the catalyst. Some SCR installations incorporate CO catalytic oxidation modules along with the NOx reduction catalyst for simultaneous CO/NOx control.
Carbon monoxide oxidation catalysts are typically used on turbines to achieve control of CO emissions, especially turbines that use steam injection, which can increase the concentrations of CO and unburned hydrocarbons in the exhaust. CO catalysts are also being used to reduce VOC and organic HAPs emissions. The catalyst is usually made of a precious metal such as platinum, palladium, or rhodium. Other formulations, such as metal oxides for emission streams containing chlorinated compounds, are also used. The CO catalyst promotes the oxidation of CO and hydrocarbon compounds to carbon dioxide (CO2) and water (H2O) as the emission stream passes through the catalyst bed. The oxidation process takes place spontaneously, without the requirement for introducing reactants. The performance of these oxidation catalyst systems on combustion turbines results in 90+% control of CO and about 85–90% control of formaldehyde. Similar emission reductions are expected on other HAP pollutants.
3.1.4.4 Other Catalytic Systems [14,15]
New catalytic reduction technologies have been developed and are currently being commercially demonstrated for gas turbines. Such technologies include, but are not limited to, the Sconox and the Xonon systems, both of which are designed to reduce NOx and CO emissions. The Sconox system is applicable to natural gas-fired gas turbines. It is based on a unique integration of catalytic oxidation and absorption technology. CO and NO are catalytically oxidized to CO2 and NO2. The NO2 molecules are subsequently absorbed on the treated surface of the Sconox catalyst. The system manufacturer guarantees CO emissions of 1 ppm and NOx emissions of 2 ppm. The Sconox system does not require the use of ammonia, eliminating the potential of ammonia slip conditions evident in existing SCR systems. Only limited emissions data were available for a gas turbine equipped with a Sconox system. These data reflected HAP emissions and were not sufficient to verify the manufacturer’s claims.
Emissions Permits [11-1]
When seeking building permission, any operator of a stationary gas turbine needs to go through the permitting procedure for the country, state, or province in which it will operate. This is a complex procedure and can vary depending on where in the world one is and which governing body has jurisdiction over the project. For instance, in China, for a power plant under 200 MW, the individual province and not the federal government has authority. The licenses generally take a much shorter time.
Even in the United States, where brownouts in the late 1990s California raised the demand for power considerably, technology affects the time taken by the licensing process. At a panel session during the 1998 IGTI annual meeting, a company (now out of business) that was then in the business of making flameless combustors informed the audience that they were fitting catalytic flameless combustors that emitted only 2–3 ppmv NOx and got their permits a few months before other stations with conventional low NOx burners. Depending on the station size, that represents millions of revenue dollars to the power seller. Research work on flameless combustors continues today.
Figure 11–4 is an example, deliberately not current, of an Emissions Activity Category form (source: Ohio EPA). If the reader needs to use this form, current ones are available on the Internet (for example: http://www.epa.ohio.gov/dapc/fops/eac/eacforms.aspx. Accessed July 2014).